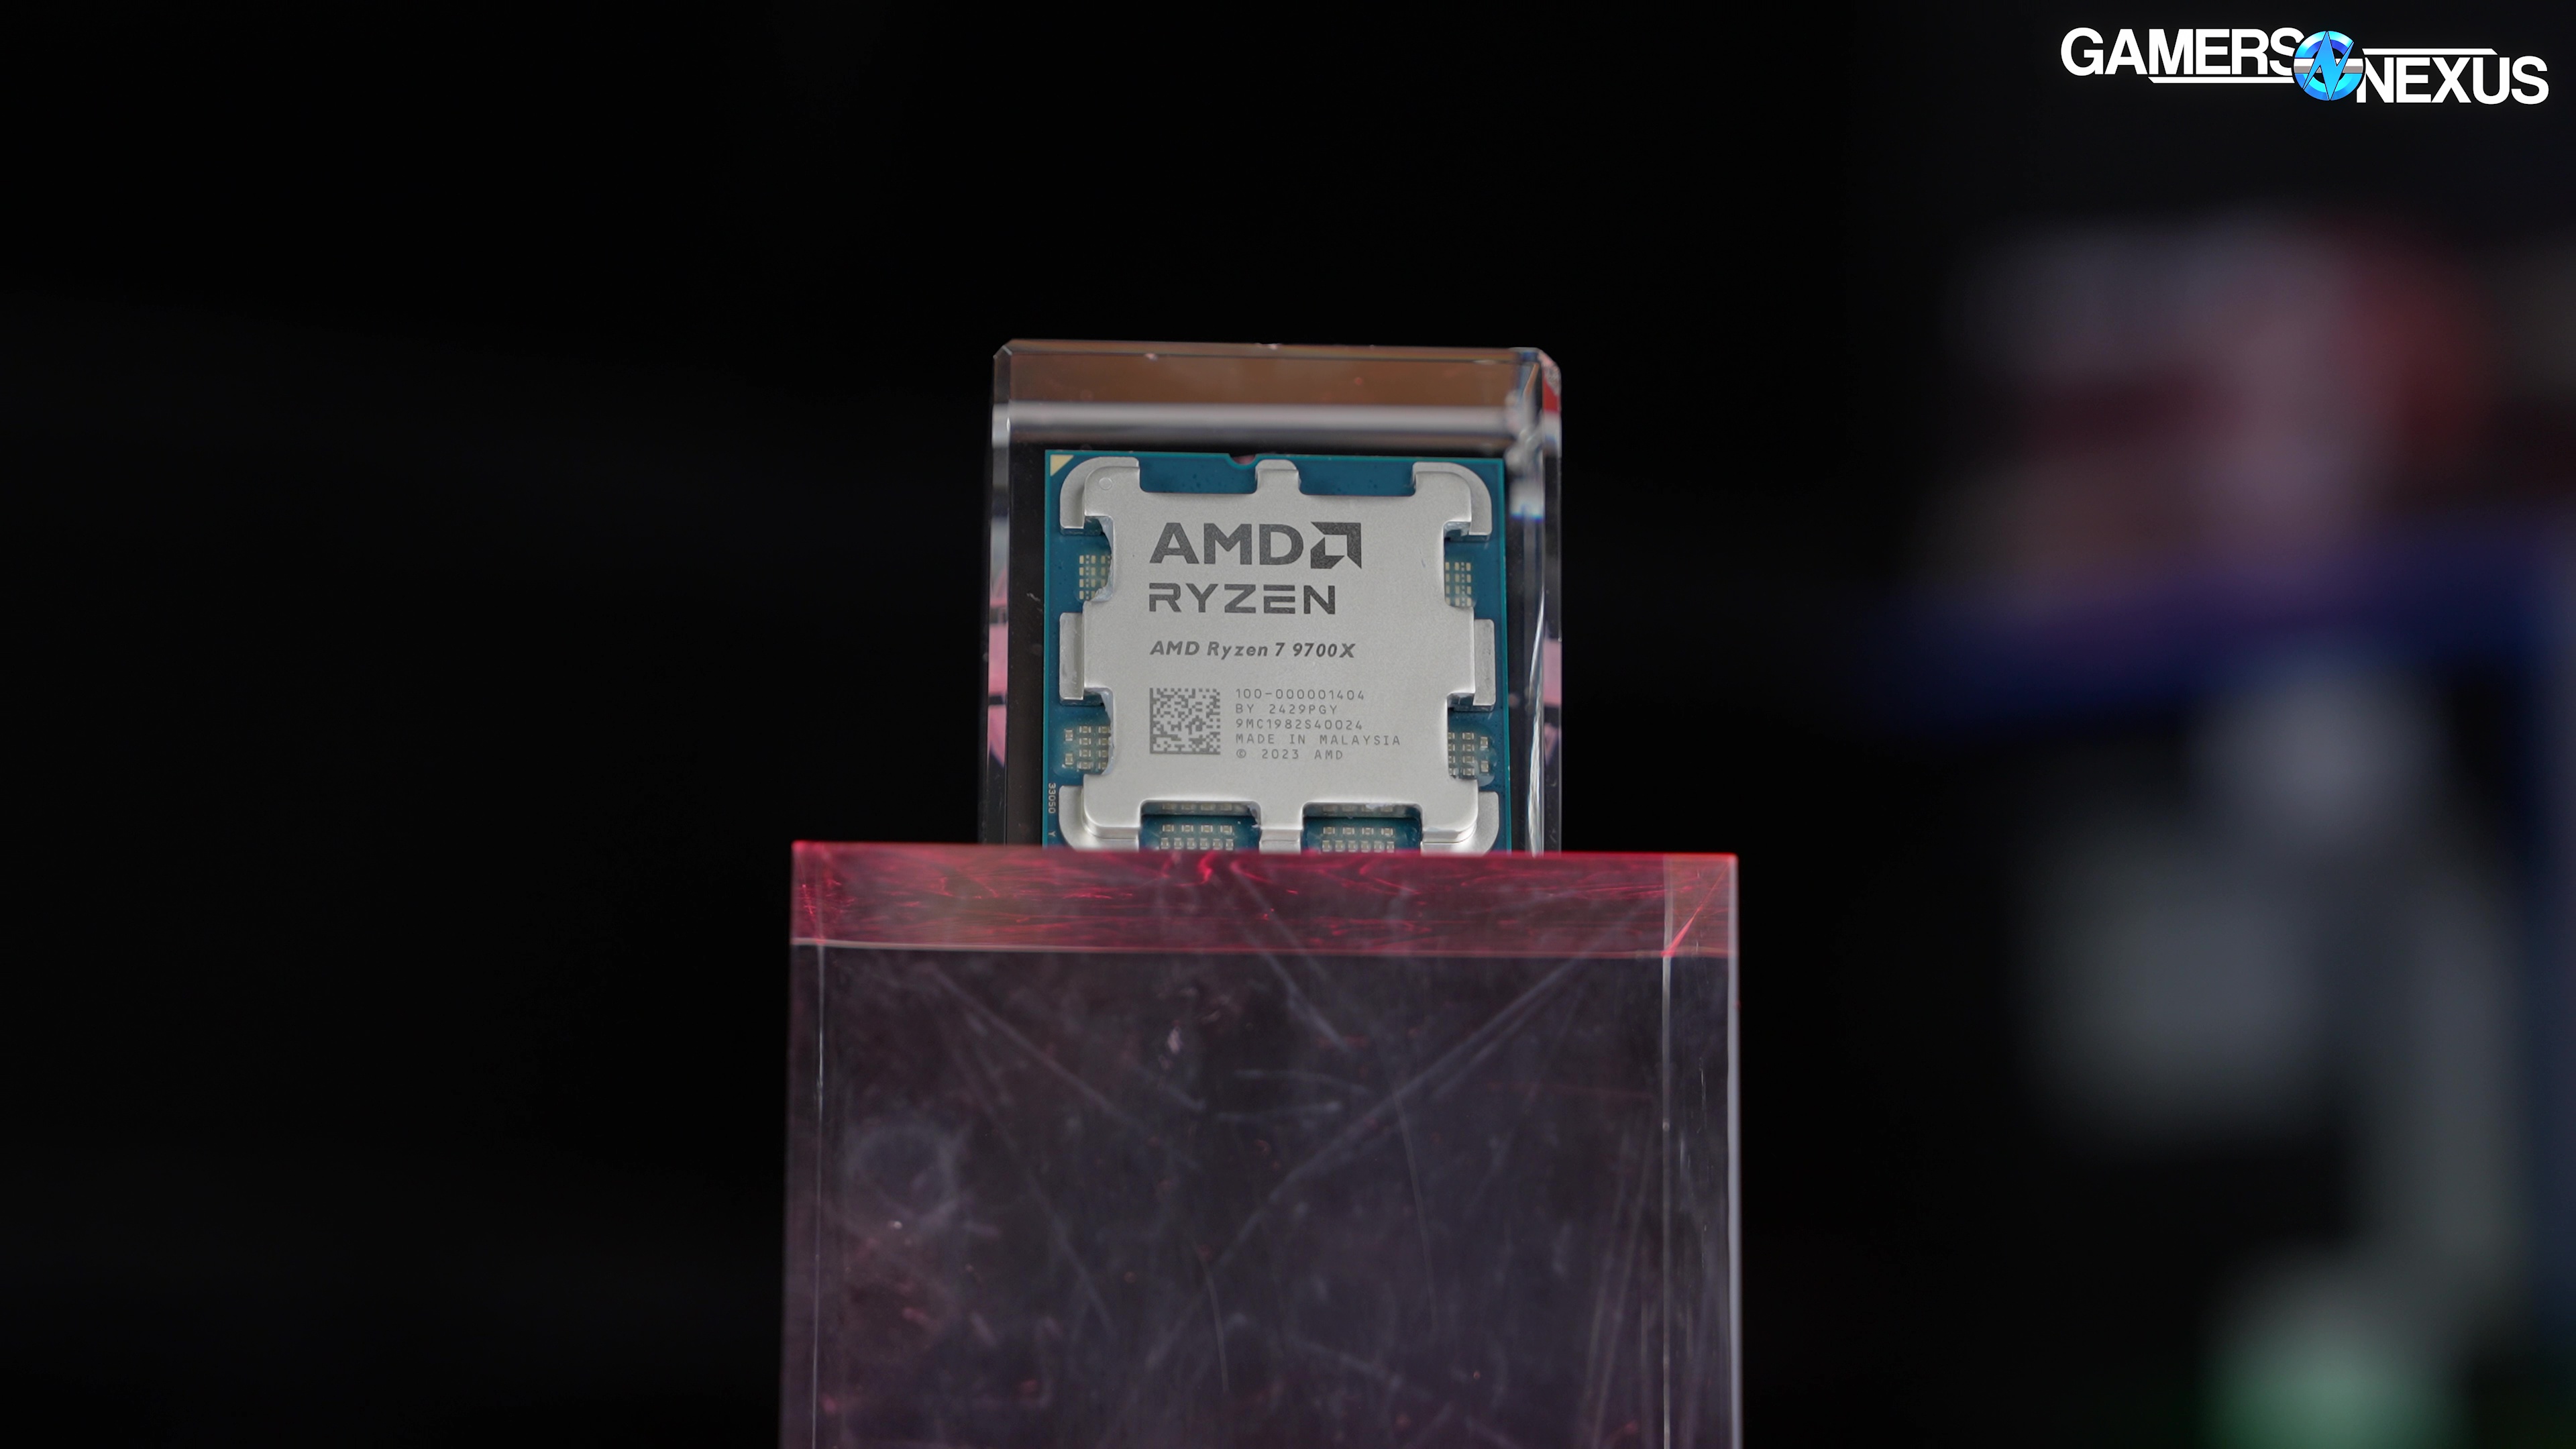
We take a deep-dive look at AMD’s Zen 5 CPU efficiency, introducing gaming efficiency and compression efficiency to our testing suite.
The Highlights
- AMD’s 9000-series CPUs usher in its Zen 5 architecture
- Even when FPS-normalized or power normalized, Zen 5 CPUs can prove less efficient than Zen 4 in many scenarios.
- Our benchmarks show that Zen 5 can be extremely efficient at times in things like all-core workstation tasks but can be inefficient in gaming scenarios
- Release Date: August 2024
Table of Contents
- AutoTOC

Intro
Here are some Zen 5-related comments we received in response to some of our recent AMD CPU reviews:
“First time I have completely disagreed with Steve's take. Same price, same performance, 30+% less power is huge.”
“That power reduction is HUGE. I feel GN didn’t give enough emphasis to that.”
“Don’t get me wrong, I really like what GN is doing. But am I alone in thinking that it’s a problem if reviewers complain about power consumption, then when a corporation decides to take a generation where they instead reduce consumption, 90% of the review is spent harping about how the part using less power has no meaningful performance upgrade?”
Editor's note: This was originally published on August 13, 2024 as a video. This content has been adapted to written format for this article and is unchanged from the original publication.
Credits
Test Lead, Host, Writing
Steve Burke
Testing
Patrick Lathan
Jeremy Clayton
Testing, Video Editing
Mike Gaglione
Video Editing
Vitalii Makhnovets
Writing, Web Editing
Jimmy Thang
We dove into Zen 5 efficiency because of dozens of comments like this and we found that, actually, Zen 5 isn’t universally more efficient than Zen 4; in fact, our new testing indicates it’s sometimes worse.
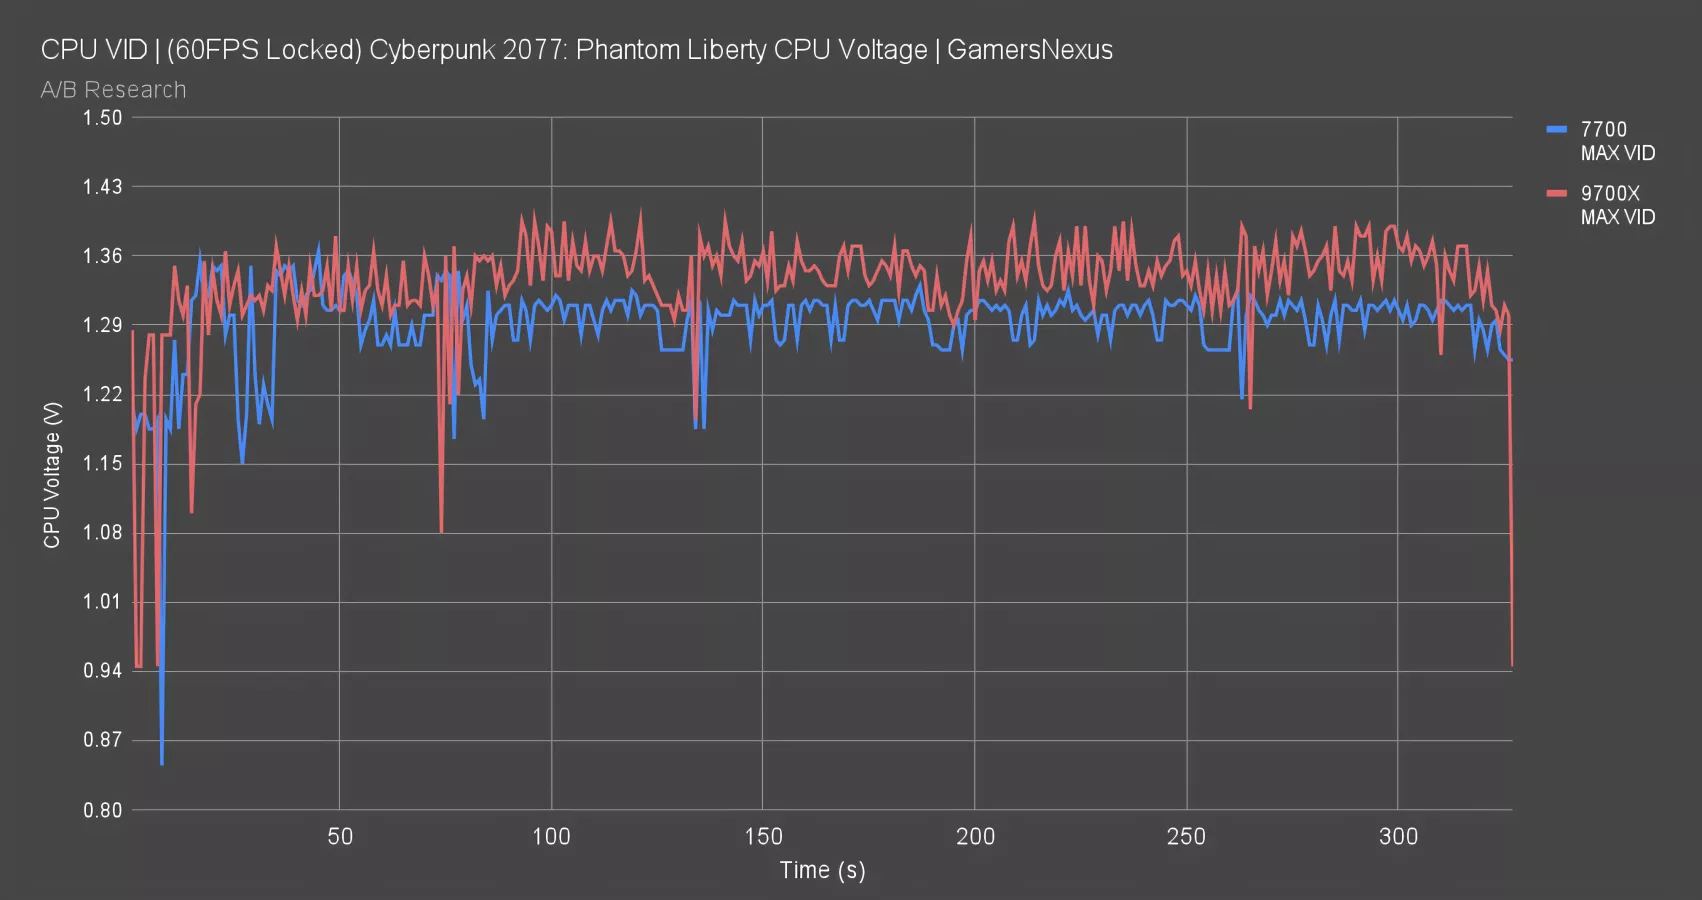
This chart shows the max VID of our 9700X vs. our 7700 when both are locked to 60 FPS, with the 9700X running higher voltage.
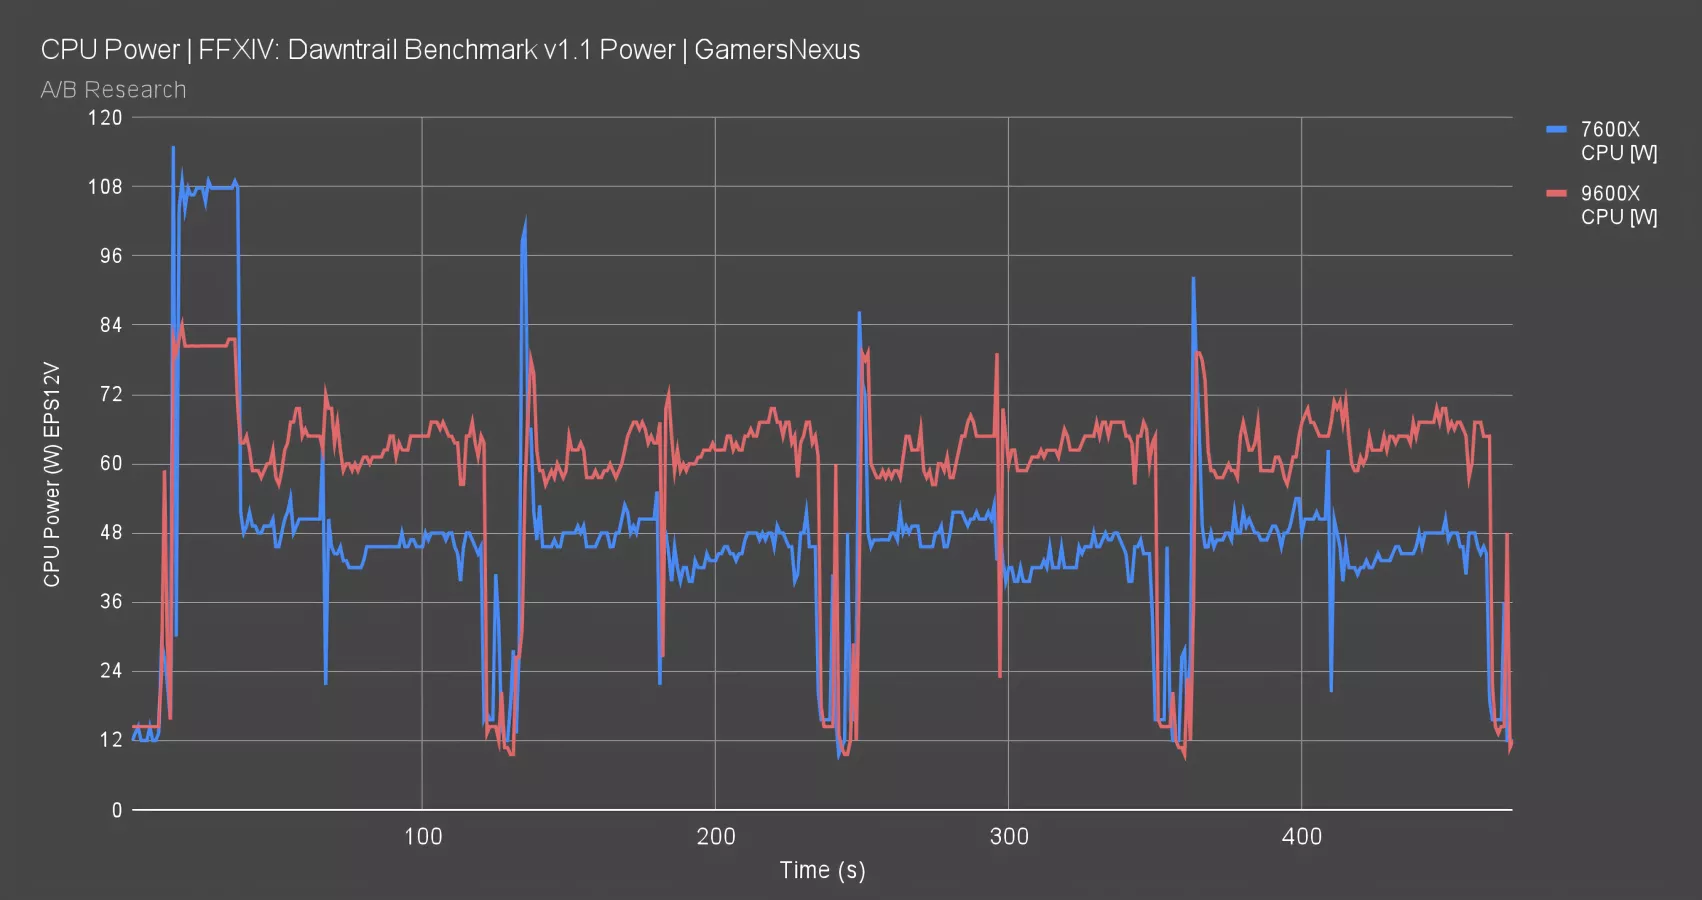
This one shows the power over time, and while we see our Zen 5 CPU drew far less power in the loading screen for the game, it also draws significantly more power at times in gaming scenarios (which comprise more of the total experience).
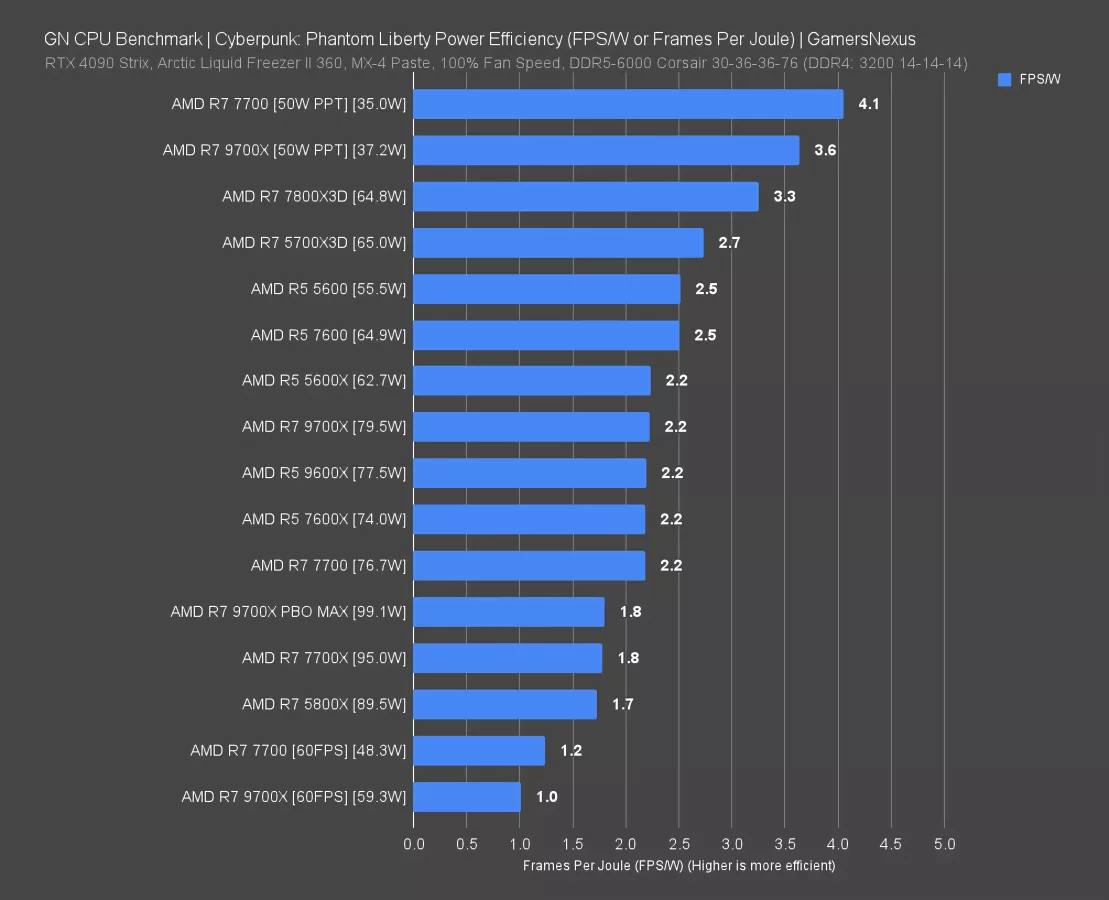
This chart shows the FPS/W in Phantom Liberty, where the 9600X in particular gets crushed by not only the 7800X3D but also by the 7600 and only barely equates the 7600X.
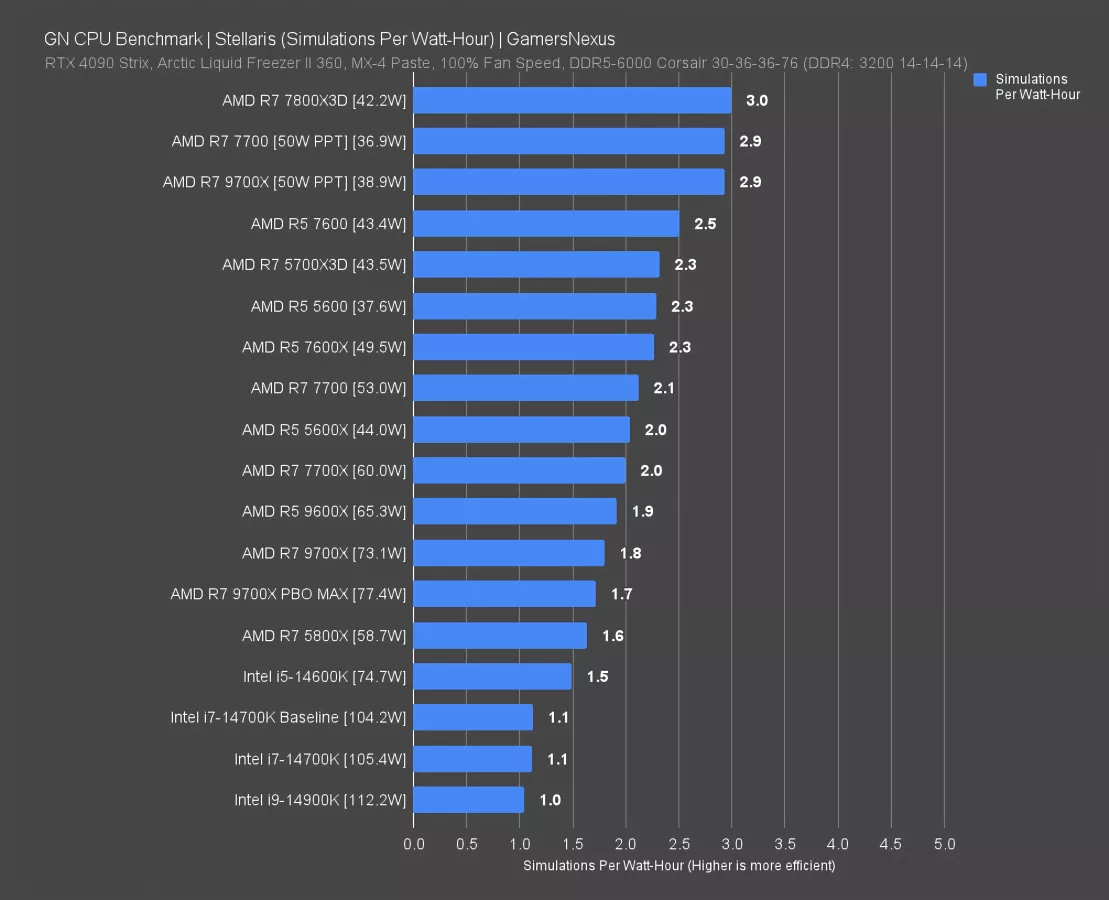
This one shows simulations per watt-hour in Stellaris, establishing again that the 9000 series surprises everyone with its lack of efficiency.
CPU efficiency isn’t a simple thing to measure because it’s so massively variable. We talked about this last year in a dedicated deep-dive methodology piece, but gaming workloads can consist of times when a CPU is both efficient and inefficient, depending on what it’s doing. Loading is different from playing, and likewise, 100% isn’t 100%. “100% load” can mean different things at different times: A CPU might be 100% bound on a single thread in a game, or could be 100% bound on all cores during a production load. It could be 100% cache limited in some compile tasks. All of this means that efficiency is complicated to evaluate.
But now, having spent a week evaluating only the efficiency of the AM5 CPUs, we have come to the new and updated conclusion that they are not universally more efficient. They are sometimes, but those scenarios are restricted largely to something like rendering in Blender.
Today’s goal was scientific: We wanted to know how the lineup shifted with efficiency testing across gaming, not just production workloads.
A quick recap first:
Our stance on the Zen 5 CPUs so far was that you generally shouldn’t buy them. Our reasons for this were these: The value is worse than Zen 4, we experienced memory compatibility and BIOS issues, we had a completely broken chip off the line following AMD’s recall (creating uncertainty if they can’t even get a reviewer a working chip after a recall), and the performance was sometimes regressive from Zen 4. Worse performance and higher price is already enough to generally advise a 7800X3D (watch our review) instead, but we said there was one upside: Efficiency, which we saw specifically in our all-core rendering production test.
That’s true, but the bad news for Zen 5 is that in gaming scenarios and even some other production workloads, it’s not more efficient. In fact, in a lot of gaming scenarios, it’s worse.
The short version of today’s testing is that we are now hardening that stance: We still think the 9700X (read our review) qualifies as “meh,” but in gaming scenarios, it also loses that efficiency advantage in most situations. Not all, like sometimes in loading, but in most.
Methodology
Here’s how this works.
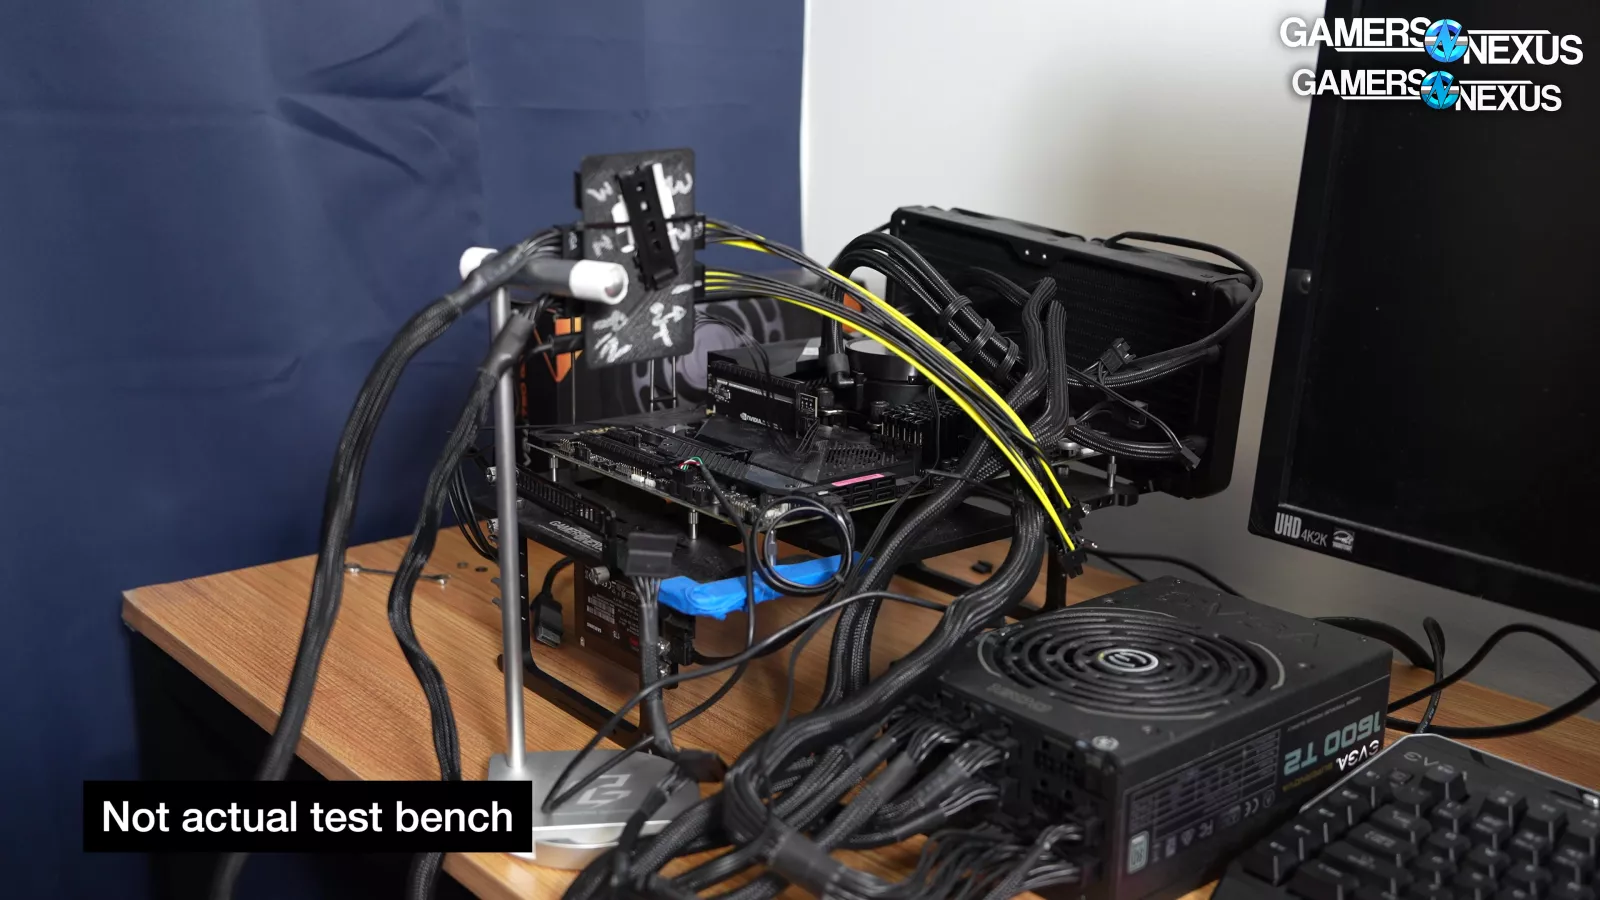
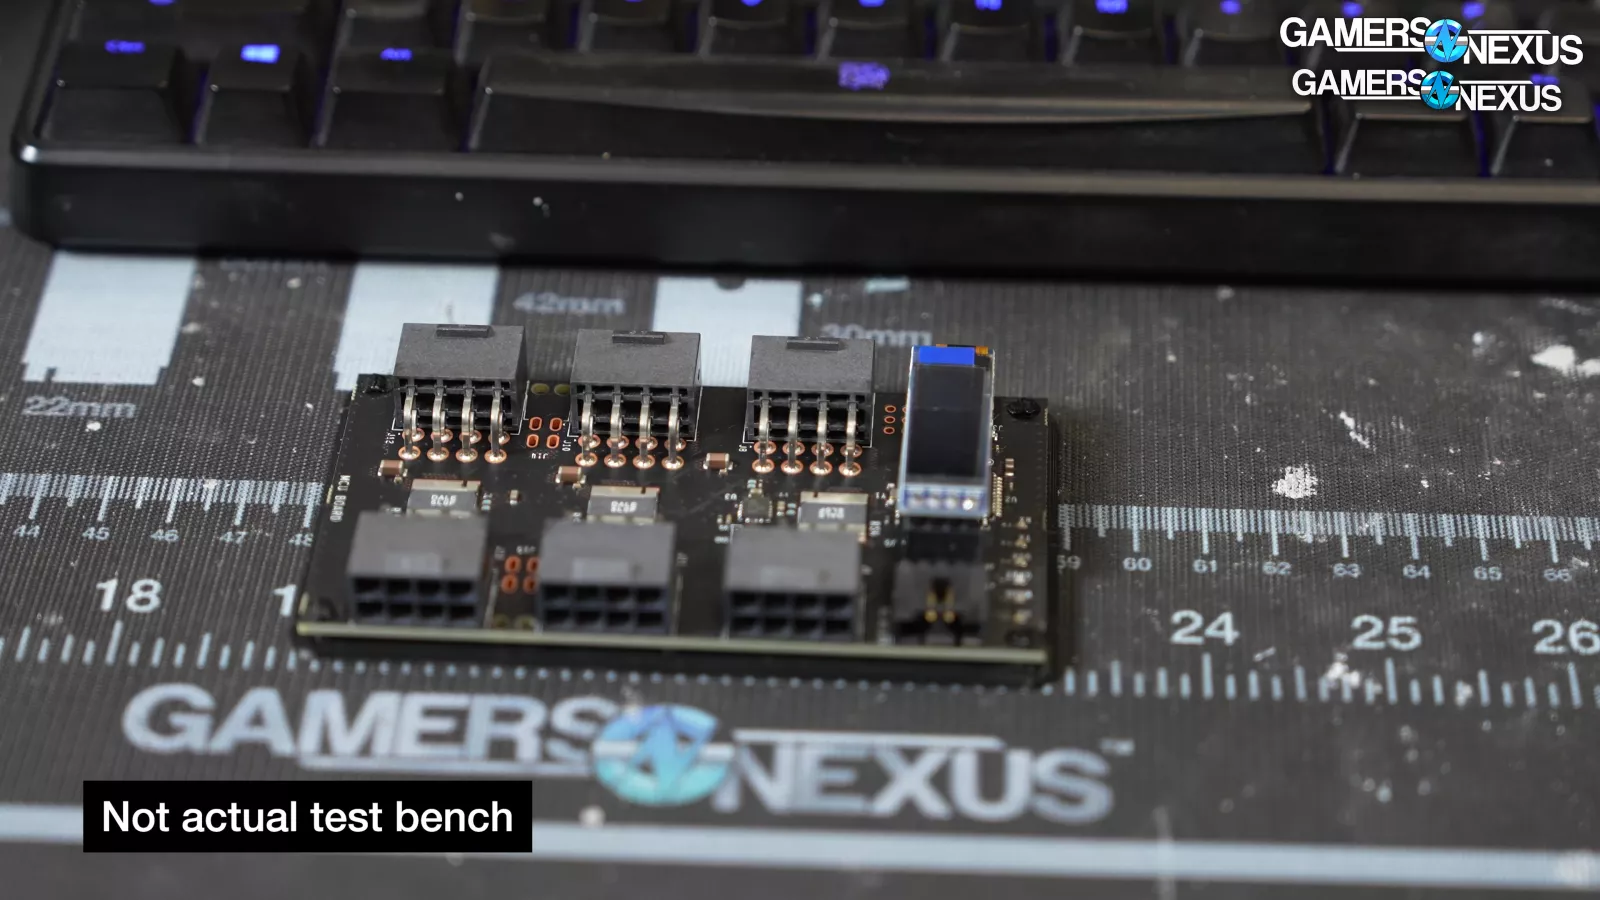
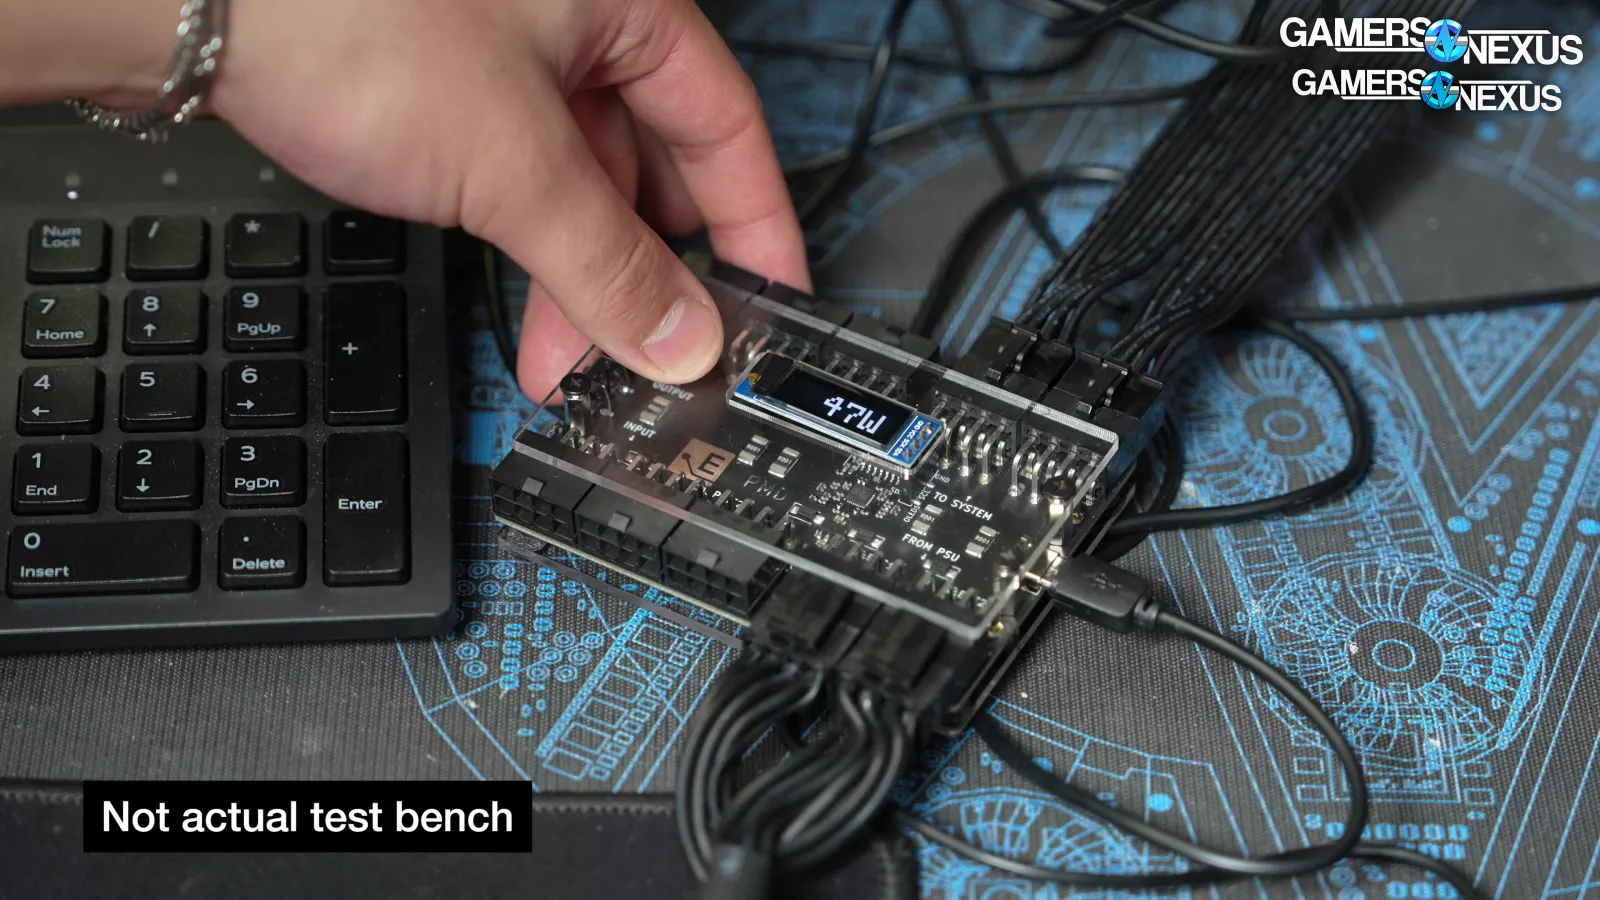
For this benchmarking, we’re testing by analyzing the power drawn at the EPS12V cables that go into the motherboard. We use an interposer between the power supply and motherboard and combined it with custom software we wrote that automates the test procedure to collect the same data at the same points in each test. This allows us to create these nice charts where the start and stop times, as well as the game loading times, perfectly align to allow us to analyze every aspect of the game.
We’re testing 7 games and 2 applications using an Elmor PMD, or Power Measurement Device, of which we bought about 8 from Elmor’s Lab’s websites.
We use a current clamp and HWINFO to evaluate each PMD.
The metric is FPS/W for gaming. FPS is frames per second, whereas a Watt is 1 joule per second. Because that’s frames per second per joules per second, we can simplify that to just say “frames per joule,” or FPJ. This is the same as FPS/W, but with unit cancellation.

We ran a poll on our Community page asking you all if you’d prefer us to use Frames Per Joule or FPS/W, and the overwhelming majority voted for FPS/W. Reading the comments, the primary reason was that it’s easier for most people to understand and instantly relate back to power consumption. Our preference was for frames per joule, but after reading the reasoning from our viewers, I agreed with their reasoning and we’ll primarily use FPS/W language. We will put both on the chart labels, though.
Stellaris’ base metric is simulation time in seconds, where lower is better. In order to stick with “higher is more efficient” and to make it algebraically easy, we are converting the Stellaris data into simulations per hour. We take the average simulation time in seconds and see how many of those will fit in 60 minutes, then use that to calculate the simulations per watt-hour.
We are defining “efficiency” as completing the same unit of work with less total energy or achieving more work with the same or less total energy. We use 3 variations for this: Stock / out-of-box testing, 60 FPS locked, and 50W PPT. The 60 FPS lock gives us a fixed unit of work that allows us to evaluate the 7700 non-X and 9700X on even ground. The 50W PPT normalizes for power, but allows FPS to be unlocked.
There are limitations to this methodology:
The biggest one is that we can’t analyze transients of the CPU with this method. It’s much faster than using an oscilloscope, but it also means we aren’t polling the data on the microsecond scale.
The second limitation is that we are not using complicated combinations of tests to evaluate a total aggregate platform-wide efficiency. For example, assuming equal characteristics, a CPU hitting a GPU bottleneck can’t be fully leveraged and will pull less power than one which is otherwise the same but runs at a lower framerate and is CPU bottlenecked. That means that there are scenarios where a high-end, high-power CPU could feasibly underdraw power because it can’t keep up with the GPU. We tried to eliminate this possibility by picking games that are heavily CPU-bound.
One other limitation of methodology is that we don’t have any insight into GPU power behavior. If there is a key driver or other characteristic of the platform that fundamentally changes how the GPU behaves, we are not capturing that power data. In general, this shouldn’t happen; however, it is a possibility, and we wanted to be transparent about the limitations of our tests here.
We believe in the scientific method and disclosures.
OK, with all of that understood, let’s get started.
Efficiency
Blender Power Efficiency
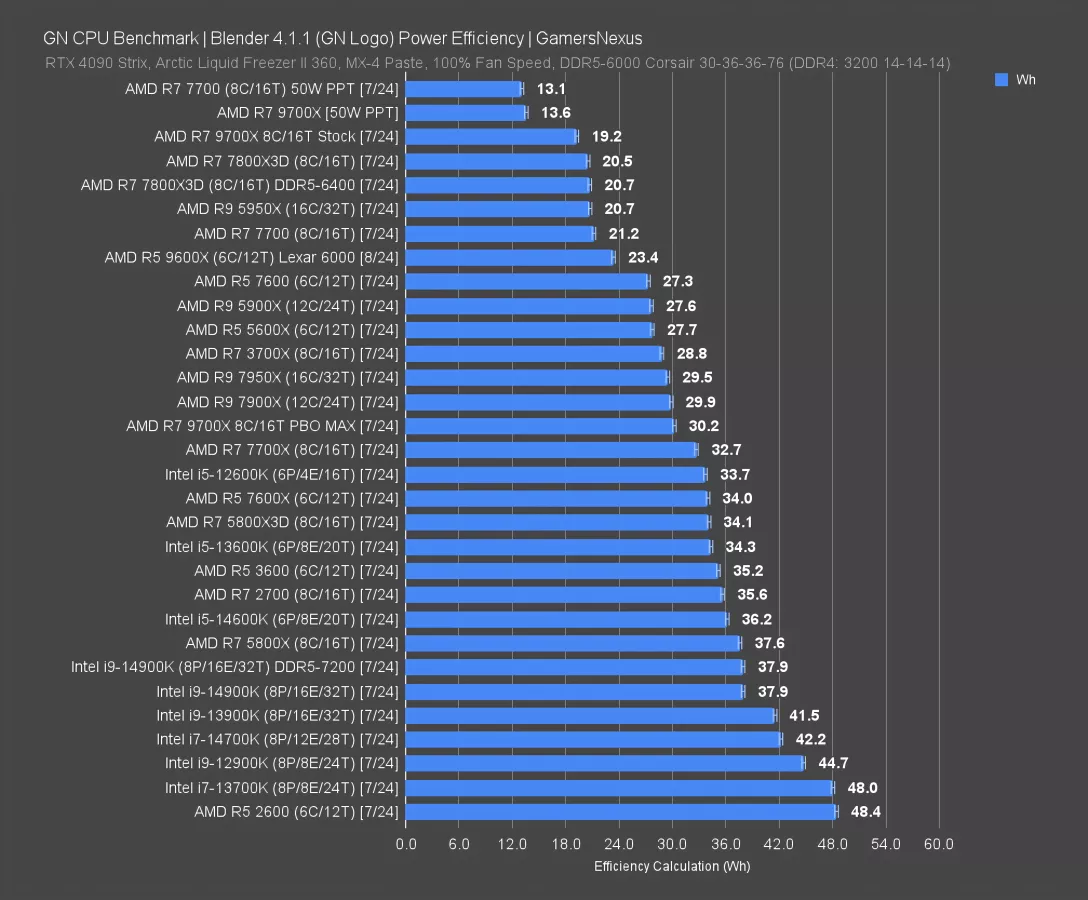
As a reminder, this is where we started. This is the Blender workload, which is 100% loaded on all threads constantly. Because of the way PPT or power limits behave, this can manifest in different efficiency results than in games where we’re more likely to have power headroom to boost higher (and potentially run higher voltages on some cores).
We added the 7700 (watch our review) here. The 9700X at 19.2 Wh remains more efficient than even the 7700 non-X at 21.2 Wh, which remains a great and very positive result for AMD’s 9700X. It’s clear that the CPU absolutely can be efficient, and even with the addition of the non-X 7700, that remains the case. Limiting the 7700 to 50W PPT and 9700X to 50W PPT has them functionally tied and within error, although the 9700X burns more of its PPT budget on voltage.
As for the 9600X, its efficiency here is also better than that of the 7600 (by a lot, actually) and the 7600X by even more. This chart remains the most positive for AMD’s Zen 5 and is what makes it not as simple to just call it “inefficient,” because that’s not accurate. But in other tests, it’s not as positive and can be less efficient.
Phantom Liberty Power Efficiency

Here’s Phantom Liberty for a heavy gaming workload. We’ve removed the Intel results from this chart as we are still collecting data for this game.
The 7800X3D is a clear leader for stock CPU performance at 3.3 FPS/W, followed by the 5700X3D at 2.7. Both are at about 65W, making them again directly comparable and functionally power-normalized. The 7600 (watch our review) is also nearly power normalized, at 2.5FPS/W. The 9700X pulled 80W in this test, resulting in 2.2 FPS/W. It ties the 5700X3D for framerate, but is less efficient. The 9700X was technically more efficient than the 7700 non-X here (by a fraction), but they’re functionally tied. The 7700X trails the 9700X at 1.8 to 2.2 FPS/W.
Locking the 9700X and 7700 both to 60 FPS but allowing power to do whatever it wants, the 7700 ends up achieving the same framerate for less power. We think this might have to do with voltage -- we’ll look at that in a moment.
Although the 9700X is more efficient than the 7700X and, on a pure and irrelevant technicality, more efficient than the 7700 stock here, the 9600X ends up less efficient than the 7600 and about tied with the 7600X.
As for PBO Max, it didn’t do much for framerate, so the power went up to about 100W (from 80W), but efficiency fell.
When locked to 50W PPT, the 9700X became instantaneously more efficient. It pulled about 2W more than the 7700 at 50W PPT, but even if we called that “margin of error” and brought its power down by 2W, it’d be at 3.9 FPS/W against 4.1 on the 7700. As is, it’s 3.6.
[NEW] Phantom Liberty 10 & 30-pt Highs
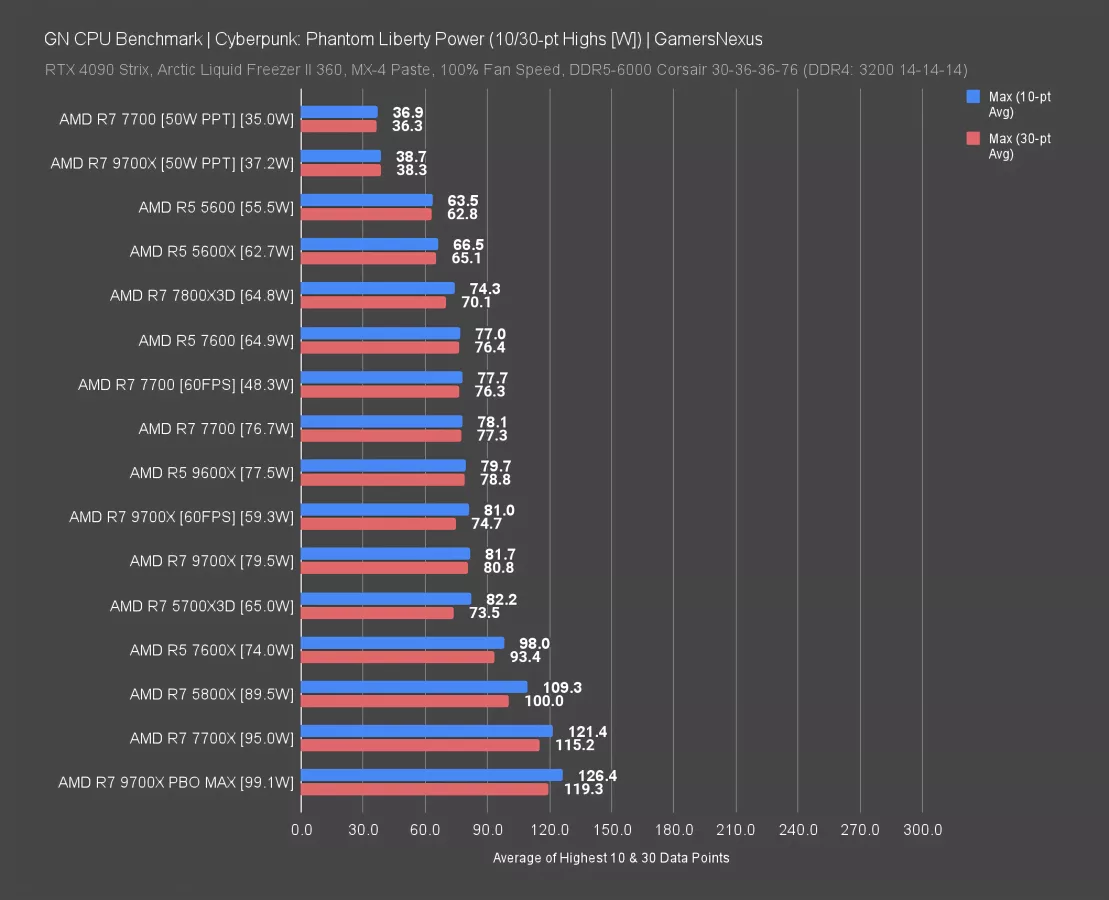
Before the research charts explaining the interesting behavior here, we need to see some of the 10-pt and 30-pt highs. For this, we are doing a very simple average of the 10 highest spikes and the 30 highest spikes during the entire test. This means that we’re including not just the gaming itself, but the loading period. Loading screens can sometimes run higher power consumption than gaming itself.
This is not an efficiency chart, it’s just pure power consumption.
Here’s what’s interesting: In favor of Zen 5, the 9700X at 80W average had 10-pt and 30-pt highs that averaged much closer to baseline, at just 81.7 and 80.8W. The 7700X (watch our review), meanwhile, had highs up at 121.4W and 115.2W. The 7700 non-X has slightly lower total power peaks than the 9700X. Looking at the 60FPS-locked 9700X, interestingly, we still see the same spikes (but fewer of them) as the 9700X under stock conditions. That’s because these spikes happen in loading, so an FPS limit has no bearing on them.
PBO MAX absolutely blasts the power here. As for the 9600X, it’s functionally tied with the 7600 for 10- and 30-pt highs. These are within variance.
The 7800X3D deserves recognition for its relatively low spikes.
Phantom Liberty - 9700X & 7700 Research
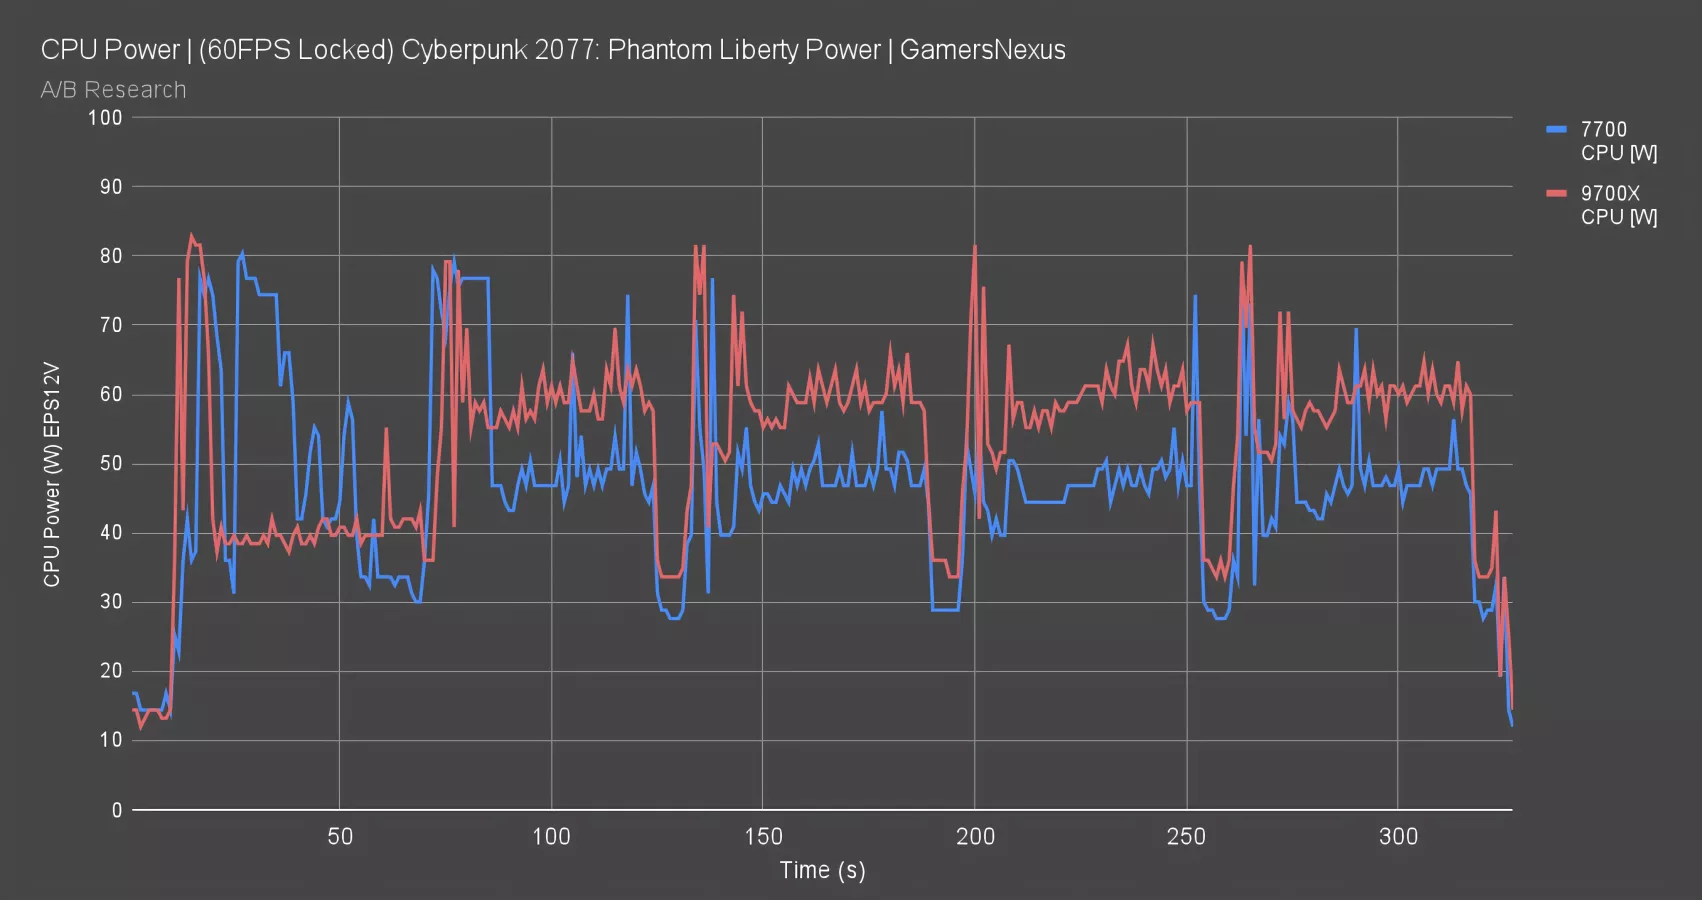
This chart shows the CPU power over time for each of the CPUs in this load. Before each averaged power period, we can see large spikes in power consumption that correspond with the loading screen. These will show up in our 10-pt and 30-pt highs later. You can see the 9700X and 7700 both spiking to around 80W in these periods.
During gaming, the 9700X is consistently higher in power consumption than the 7700, despite being locked to 60 FPS on both and having the same TDP.
Phantom Liberty - 9700X & 7700 Research (VID)
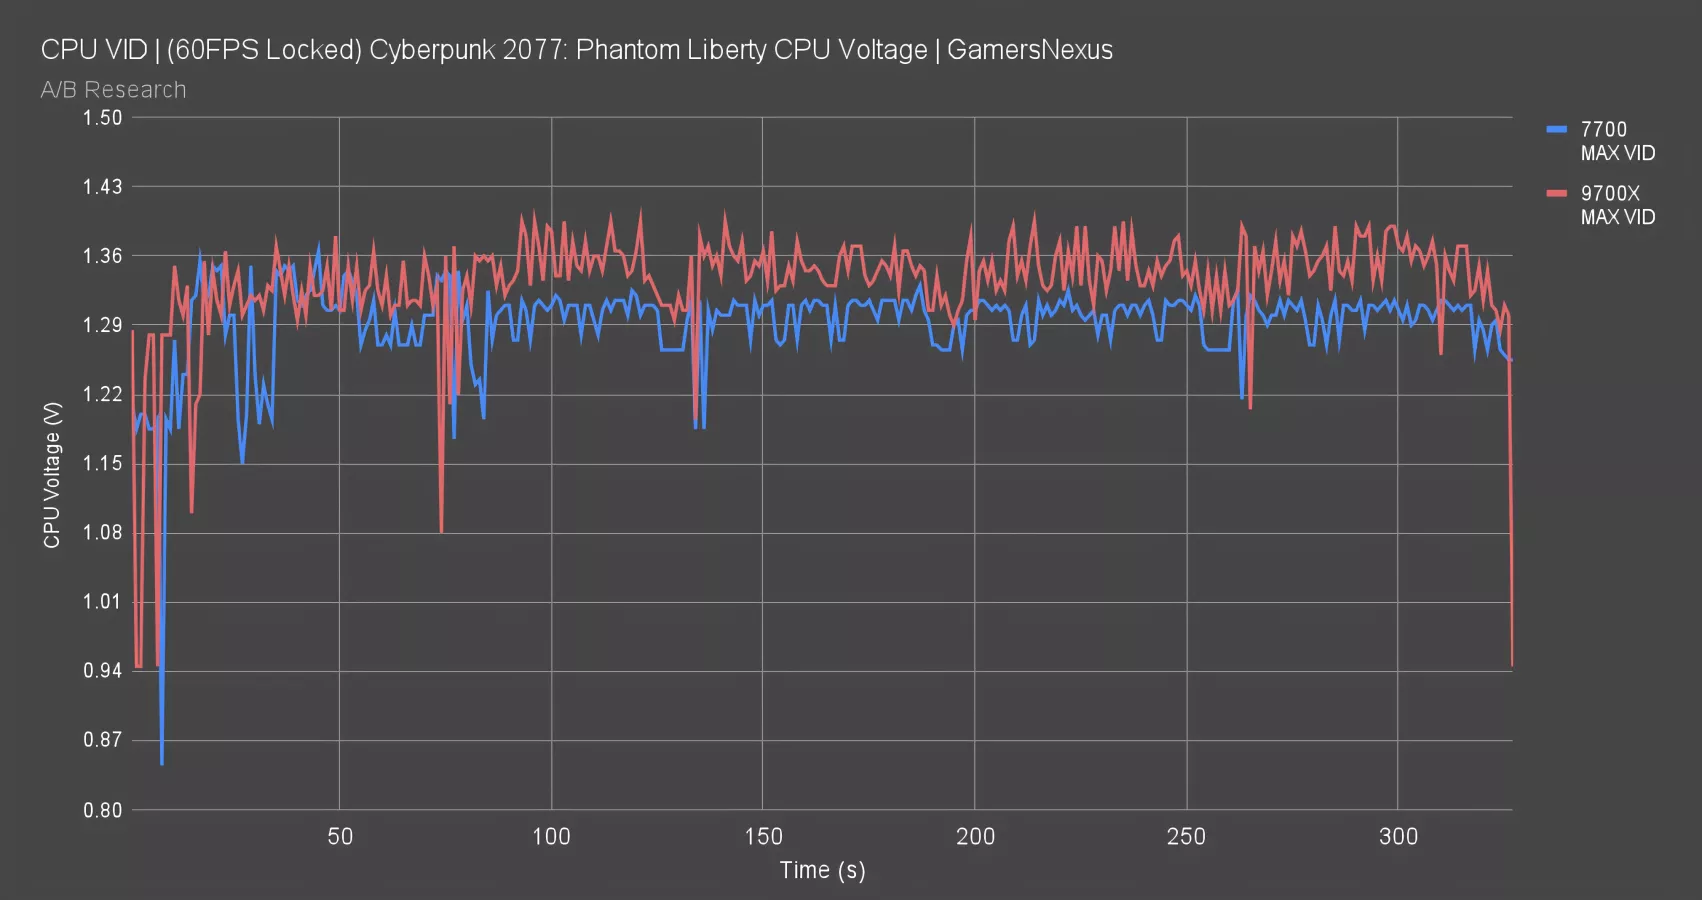
If we plot the Max VID, the 9700X is running higher point-to-point when looking at maximum per interval. It’s in the 1.32-1.38 range, whereas the 7700 is in the range of 1.27 to 1.32.
Phantom Liberty - 9700X & 7700 Research (VDDCR)
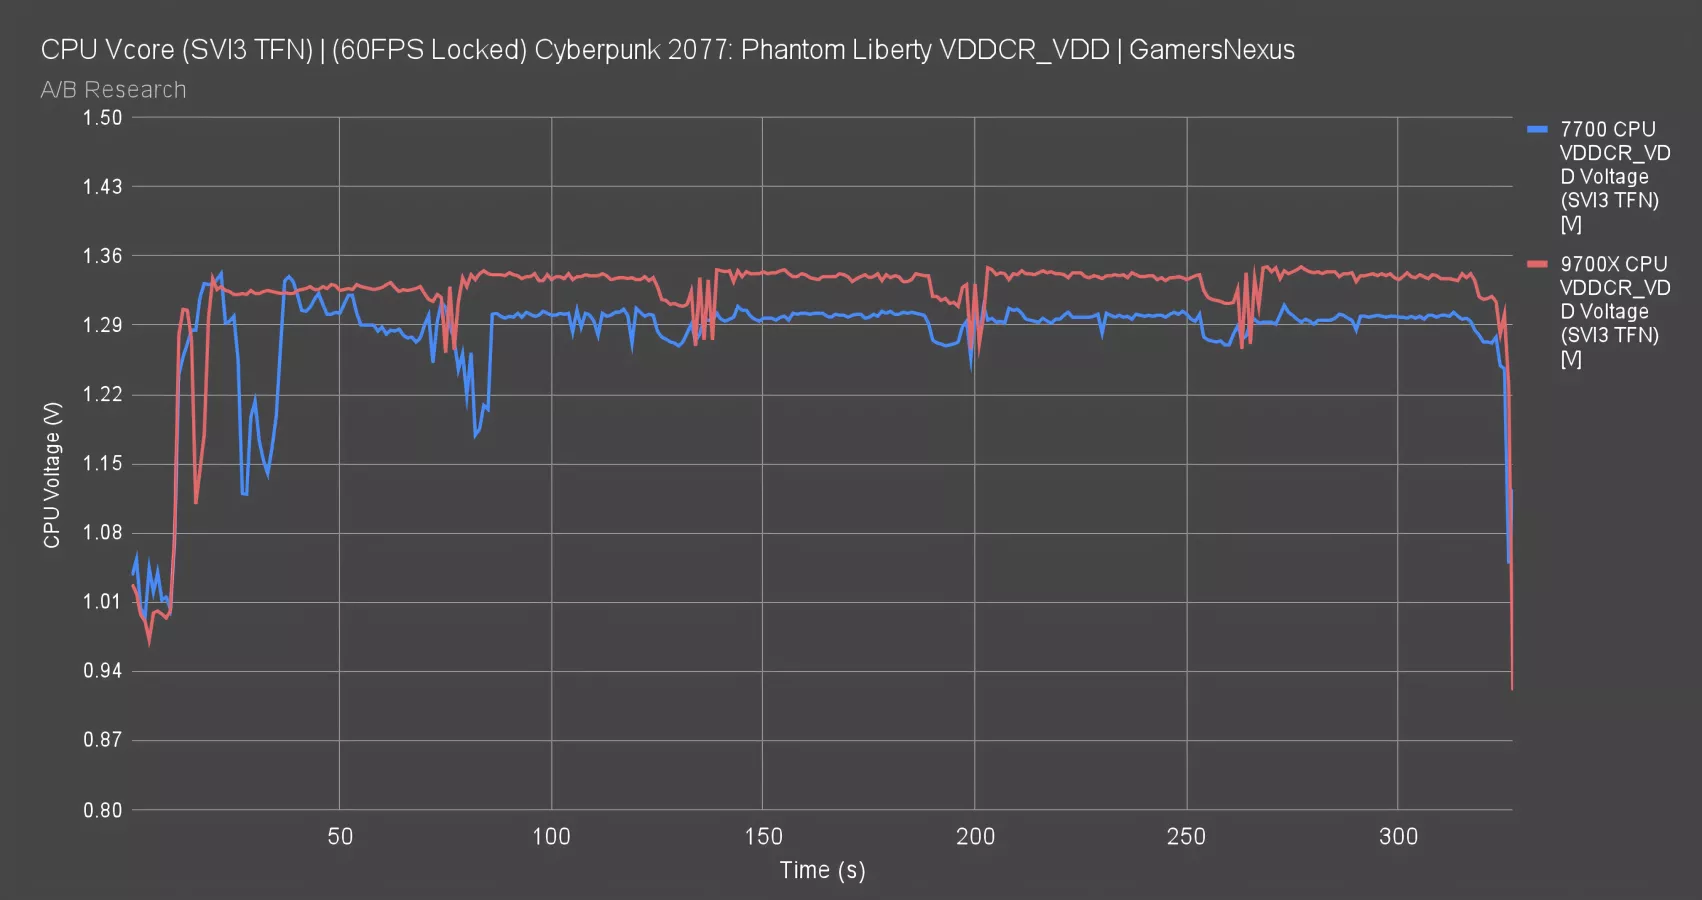
Looking now to VDDCR_VDD SVI3 TFN voltage, the 9700X ends up in the 1.33-1.34 area, whereas the 7700 was typically around 1.29 to 1.30V.
Phantom Liberty - 9700X & 7700 Research (Vcore)
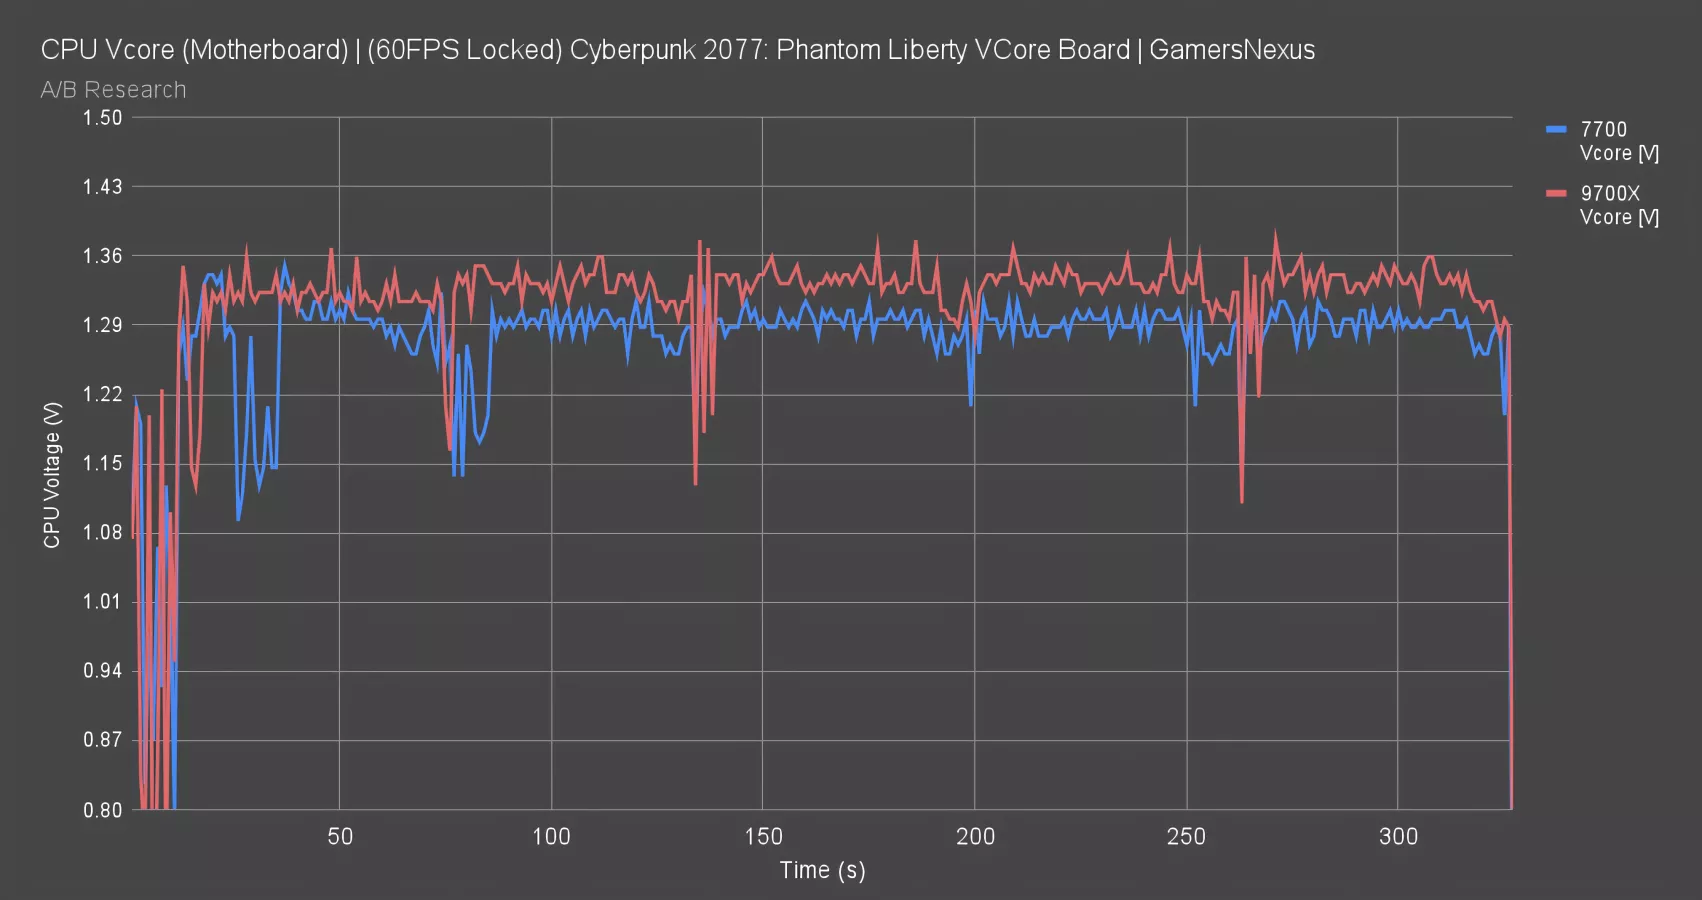
Looking now at Vcore from the motherboard sensor in software, we see another 1.30 to 1.34 difference favoring the 7700 with the lower Vcore.
Phantom Liberty - 9700X & 7700 Research (Frequency)
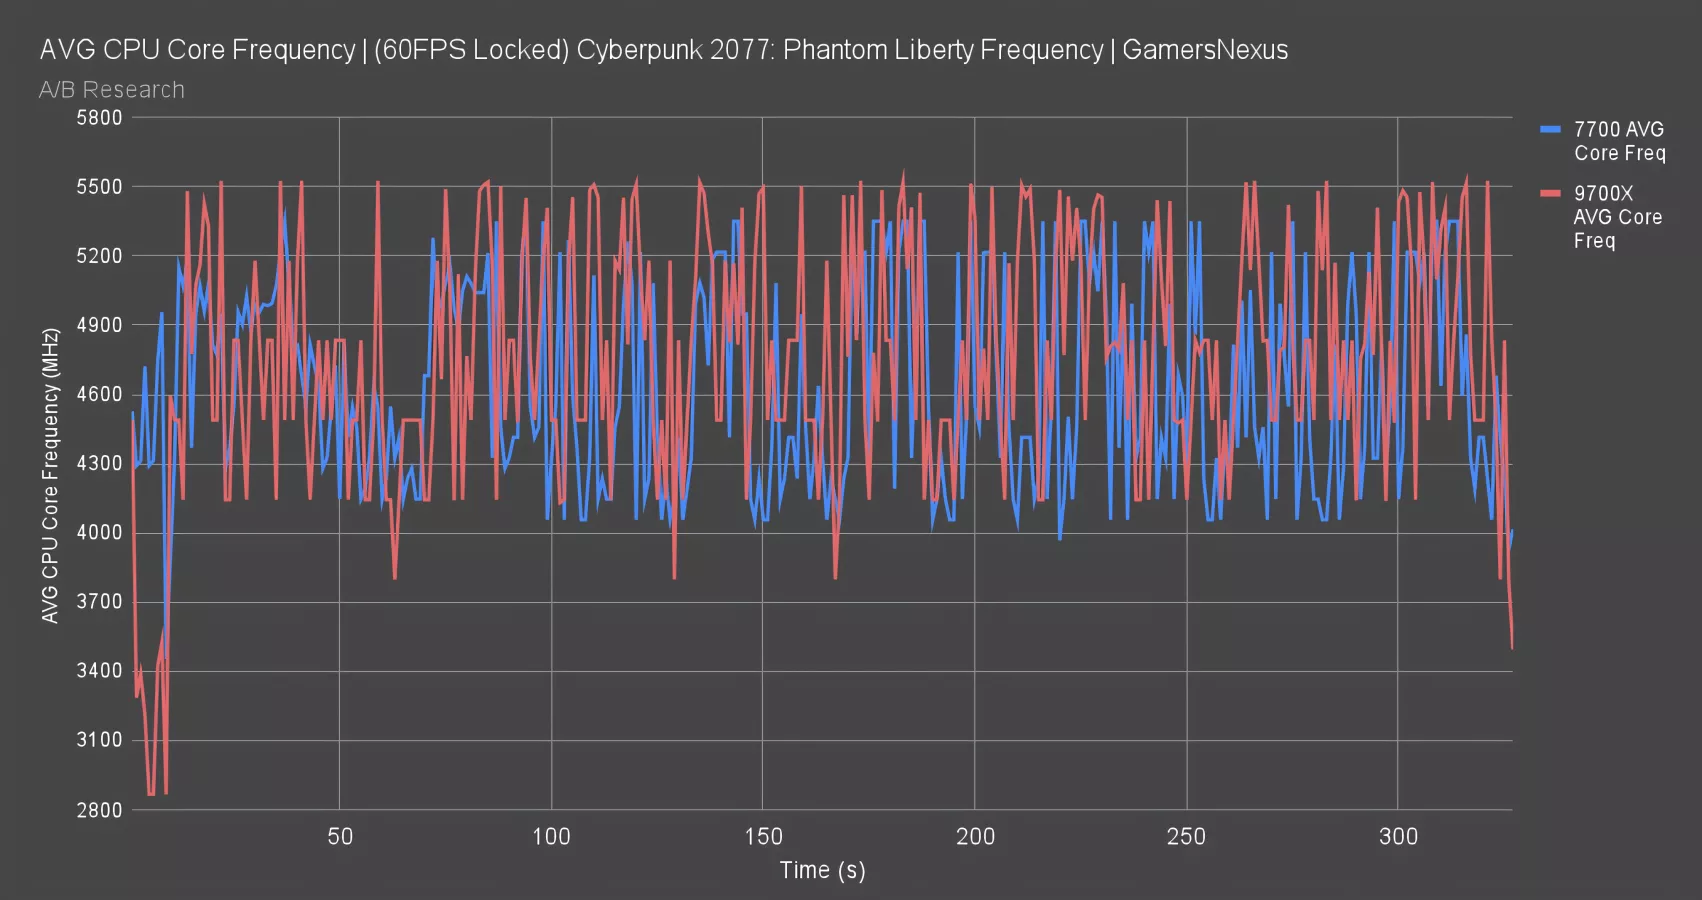
Finally, for frequency, the 9700X was frequently spiking toward 5400-5500MHz in this game, with expected fluctuations based on the game load. The 7700 ran a lower frequency on average. It appears that the 9700X is pulling a higher voltage across the board, even when locked to 60 FPS, as it tries to sustain these frequencies. Also, in situations where the older CPUs become architecturally bound, such as in Final Fantasy, which we’ll take a look at in a bit, the 9000 series is able to run a higher framerate and bypass some external binds. This also leads to higher power. In this instance, though, the voltage is largely to blame.
That gives us an explanation for what we’re seeing. Let’s move on.
FFXIV Dawntrail CPU Efficiency
Here’s Final Fantasy 14: Dawntrail.
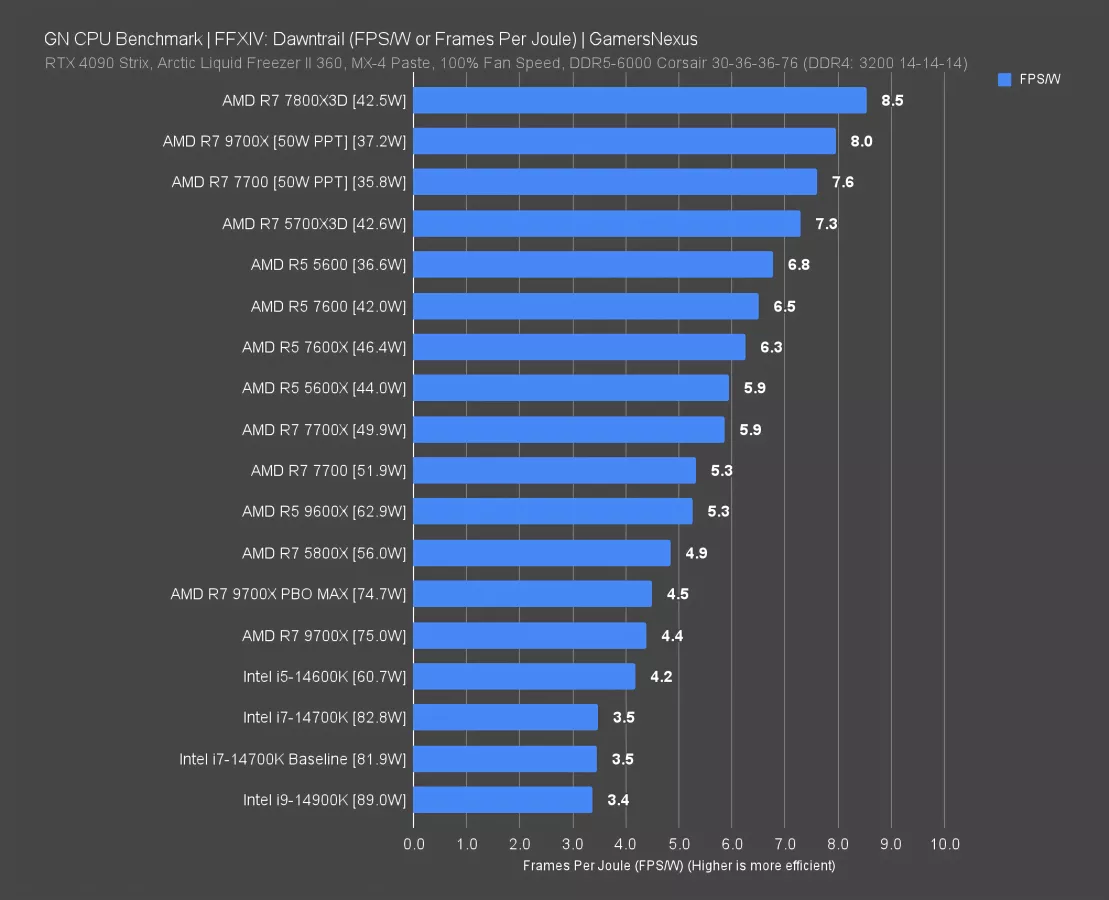
In this one, the 7800X3D returns as the most efficient CPU -- and by a longshot. The next closest stock CPU is the 5700X3D (read our review) at 7.3 FPS/W to the 7800X3D’s 8.5. Behind that, the 5600 is next at 6.8 FPS/W. The next stock CPU is the 7600, then the 7600X. These two are about tied. The 7600X (watch our review) is slightly more power-hungry, but also slightly higher framerate.
Skipping down to the new CPUs, the 9600X ends up less efficient than the 7600 and 7600X alike. Despite an increase in framerate that was actually meaningful when compared to the 7600X, power consumption went up more. Even though the 9600X has a TDP of 65W and the 7600X has one of 105W, you can see that the 9600X is pulling more power during gaming but isn’t always the case. You’ll see that the 7600X can pull more when loading the game. It makes this comparison very messy and difficult to really nail down which one is more efficient because they change. This is something we spent a day investigating. We’ll get to our best explanation of that in a moment. The data is repeatable and, referencing our data from last year, appears consistent with games like this one.
Locking PPT to 50W gets the 9700X and 7700 closer to each other, with the 9700X pulling ahead even in spite of a slightly higher EPS12V power consumption. This is a game where its FPS lead is meaningful, at 9% over the 7700, just like the 9600X saw around 14% over the 7600X and 21% over the 7600. In the rare scenarios where the newer CPUs are actually able to get more than a 3-6% improvement, it seems that the efficiency scales more favorably than we’ve seen elsewhere when normalized for power.
Intel’s performance here is unfortunate: It’s at the bottom of the charts once again.
FFXIV Research (Power)
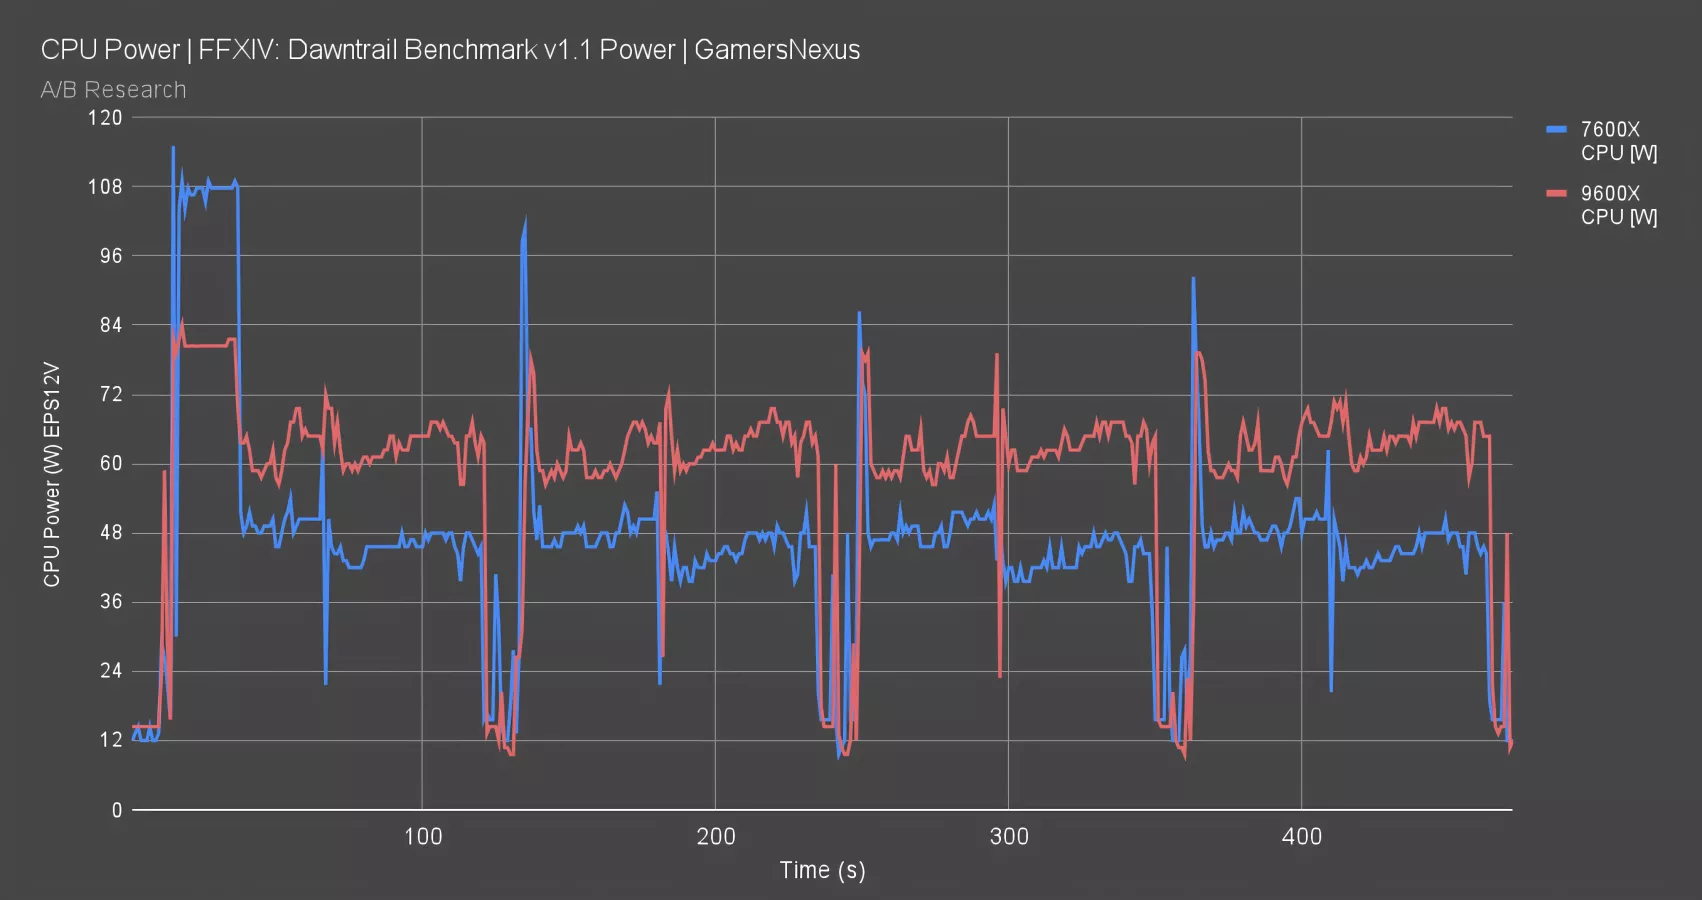
Here’s the research into that behavior of the 9600X and 7600X, which we’re plotting because it has a higher TDP and PPT than the 9600X, but pulled less power in the same test when gaming.
First, for power over time, you can see the 7600X does actually burst significantly higher than the 9600X in some loads. That load is at the start: When we’re loading the game, in that first 40 seconds or so, the 7600X pulls around 115W at the peak when it’s first launching and loading the benchmark. The 9600X is pulling around 80W in the same scenario, so in fact, it is far lower power in this workload. This doesn’t show up in the gaming averages, because it’s not during gaming, and is also a shorter time window.
In subsequent loads, the intensity is reduced, but you can still see the 7600X spiking to around 100W in the second pass, whereas the 9600X is around 78W.
Once we get in game, it’s a different scenario: The 9600X pulls around 20W more power in many of these sections of the game test.
FFXIV Research (VID)
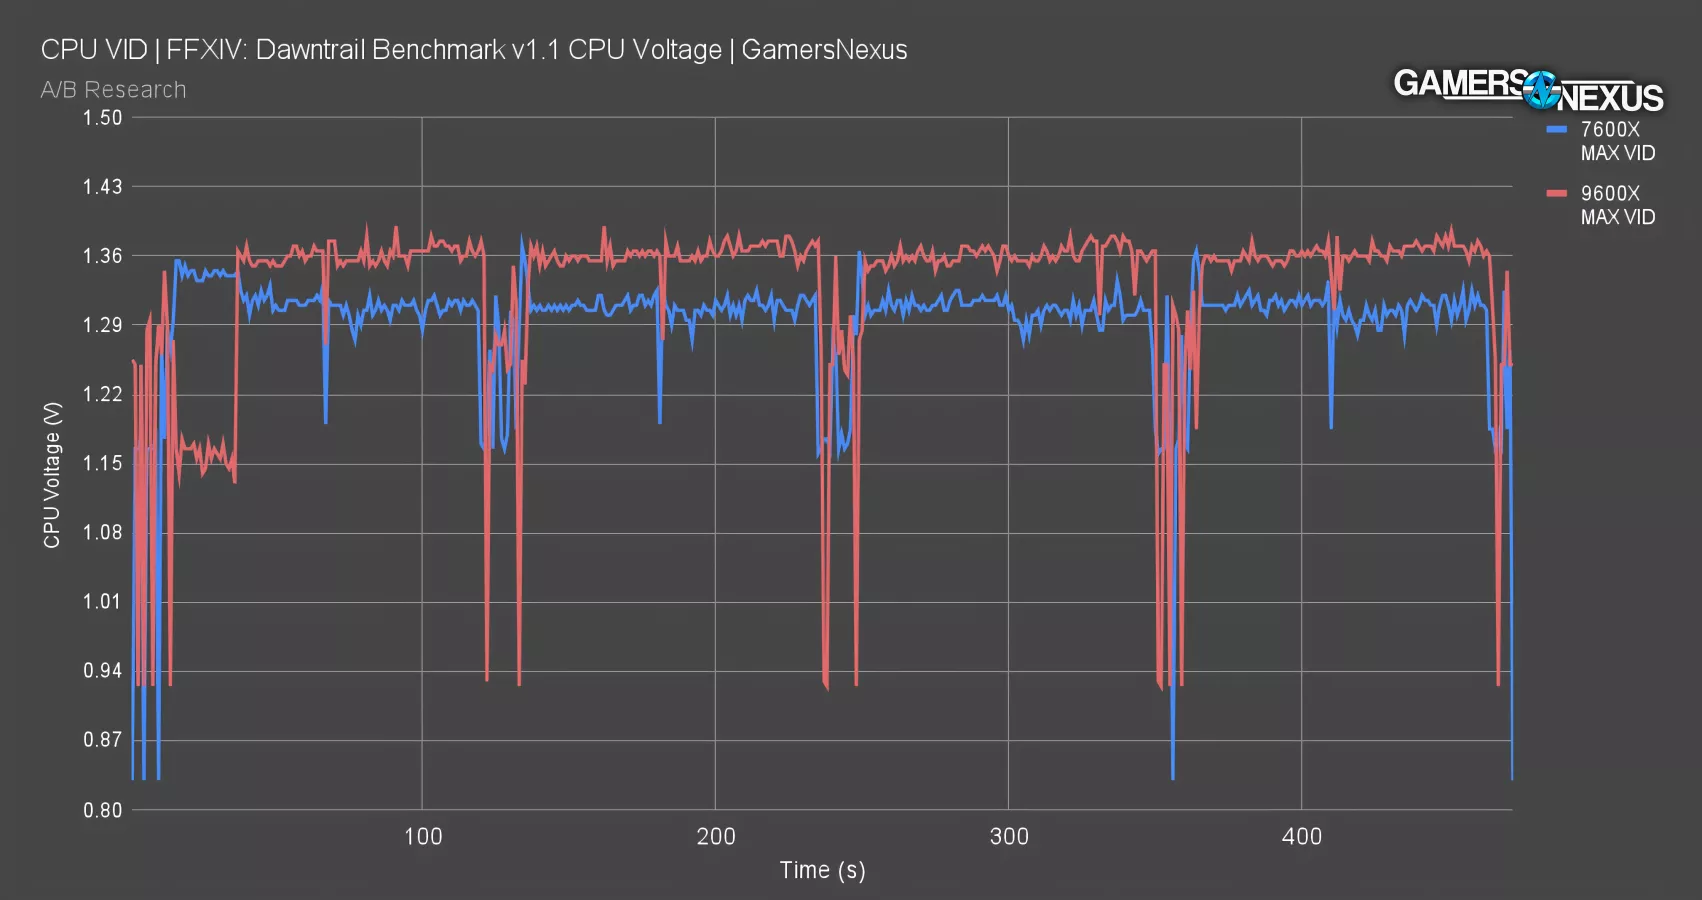
Here’s the Max VID chart for Final Fantasy XIV: Dawntrail. In this test, the 9600X plots 1.36-1.37 maximum VID point-to-point. Keep in mind that this is done with software logging, not an oscilloscope, so we aren’t catching any spikes that are on the scale of microseconds. We can’t see transients here.
Even still, the 9600X maintains a higher max VID than the 7600X for the entire test sequence. The one exception is during our initial load of the game and its assets in that area before 40 seconds: The 9600X has far lower max VID, way down to 1.14 to 1.18V, whereas the 7600X is in the 1.34 range.
FFXIV Research (VDDCR_VDD)
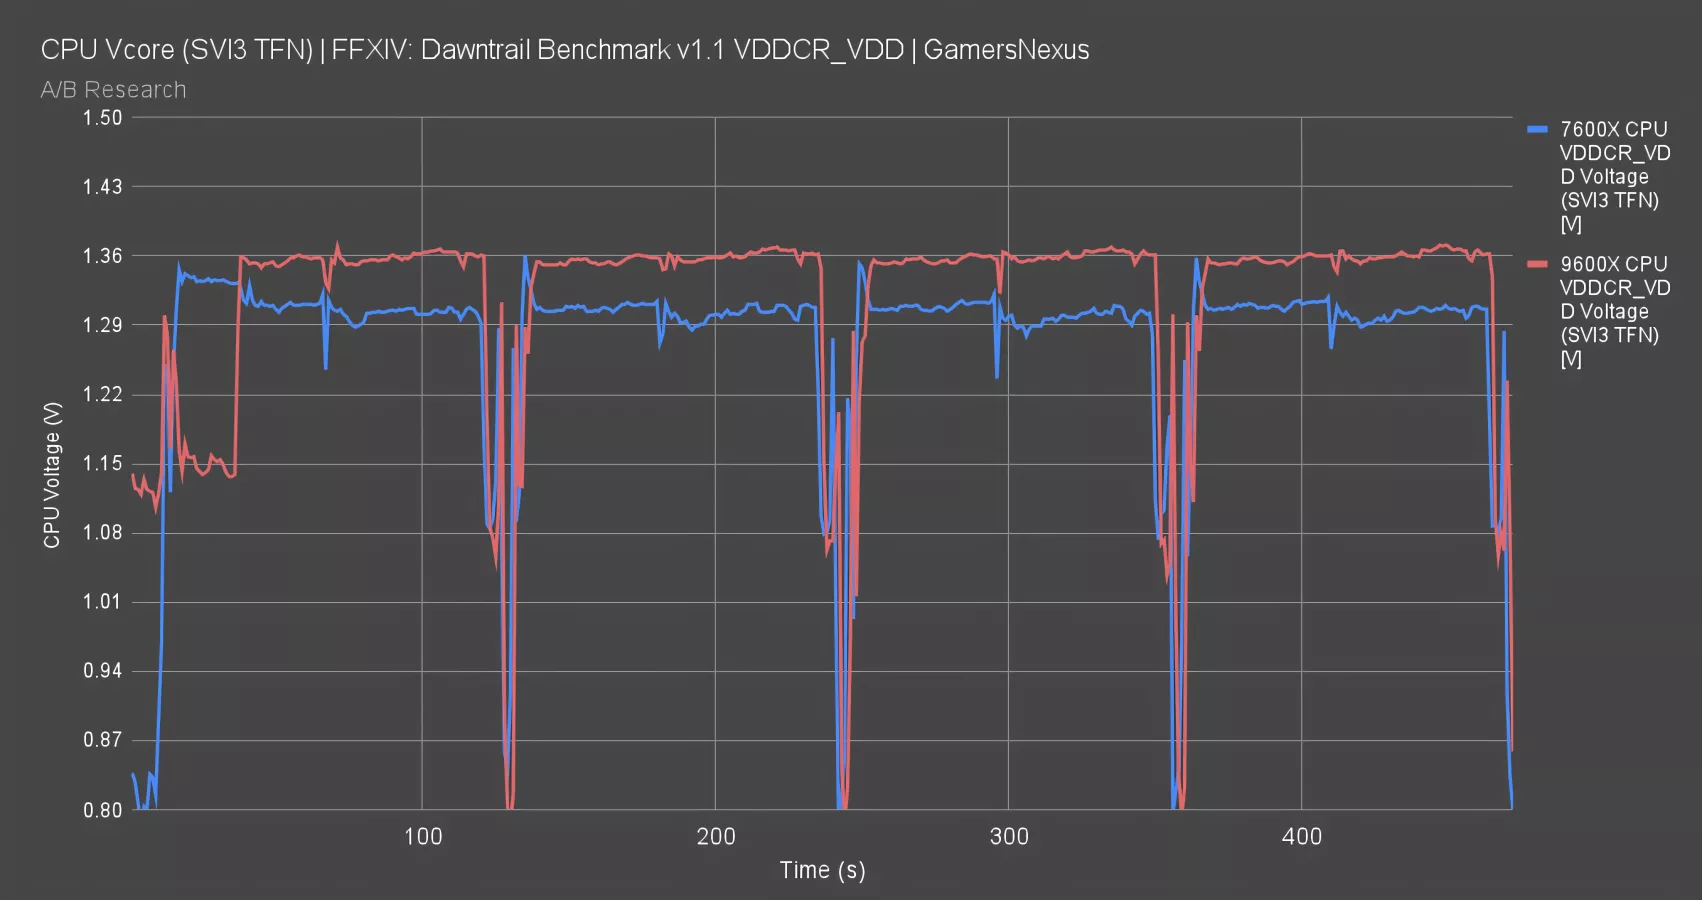
Looking at VDDCR_VDD SVI3 TFN, the behavior is replicated: The 9600X is lower in the loading screens, but higher in the game. We think this is to do with CPU core utilization, where Final Fantasy has a known favor to CPU frequency on fewer cores. In other words, a 6-core CPU can outperform an 8-core CPU from AMD in this game if the frequency is a little bit higher and here we're seeing that higher frequency come into play.
FFXIV Research (VCore Motherboard)
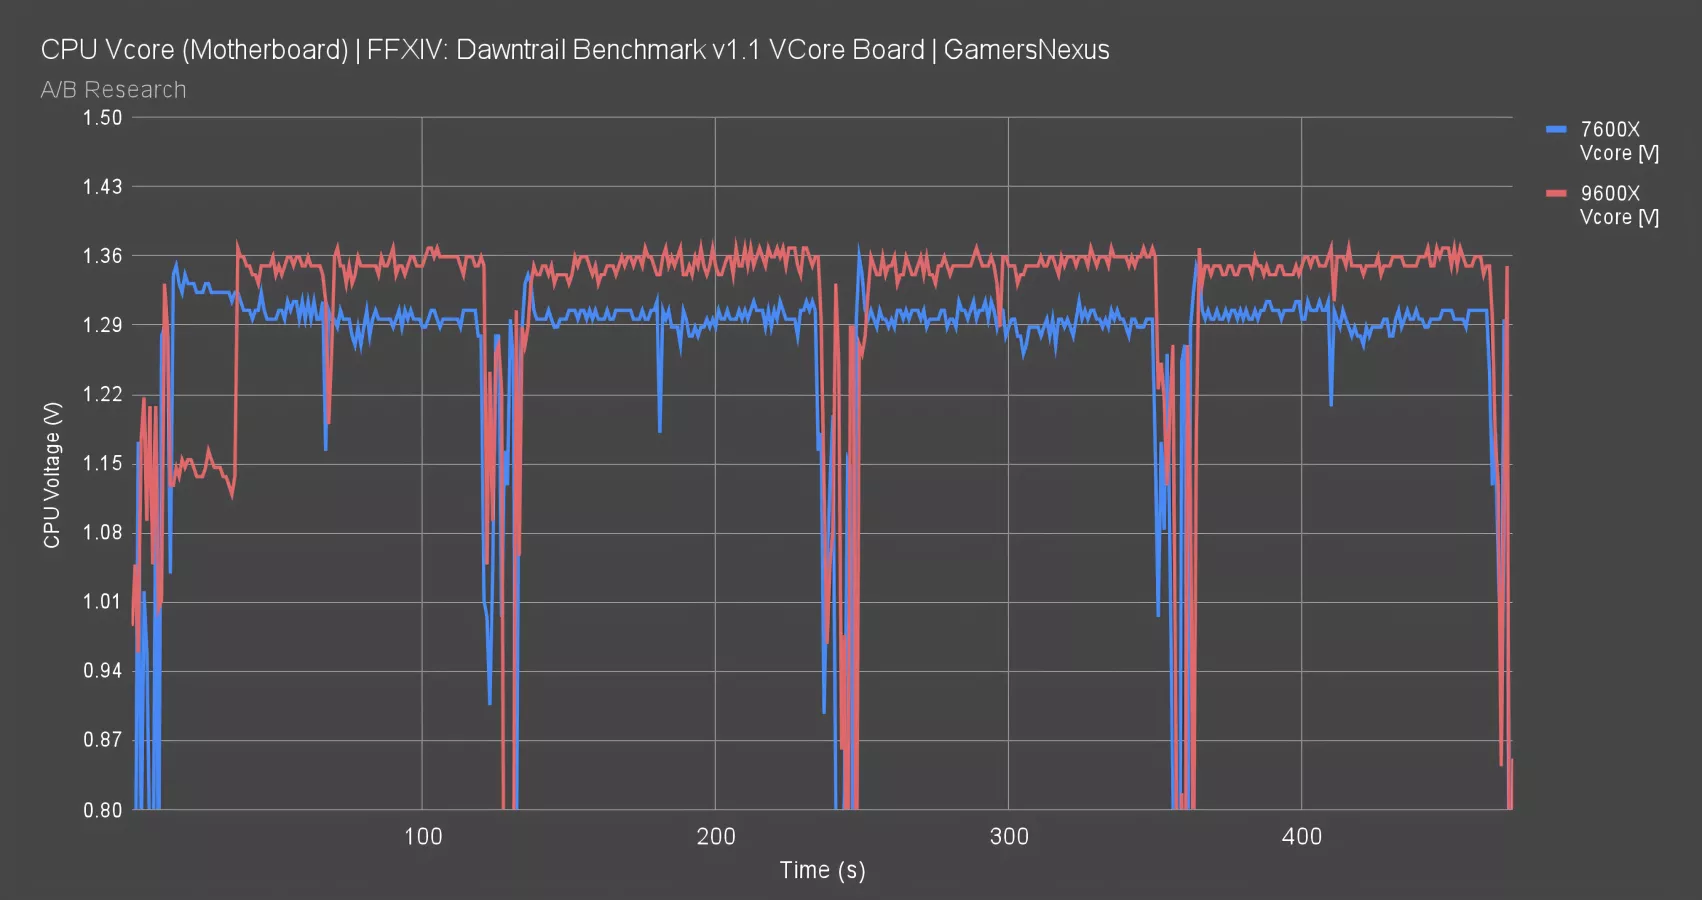
Here’s the motherboard Vcore sensor in HWINFO. In this one, we see a repeat of the behavior: The 7600X generally is lower for Vcore as measured here.
FFXIV Research (Frequency)
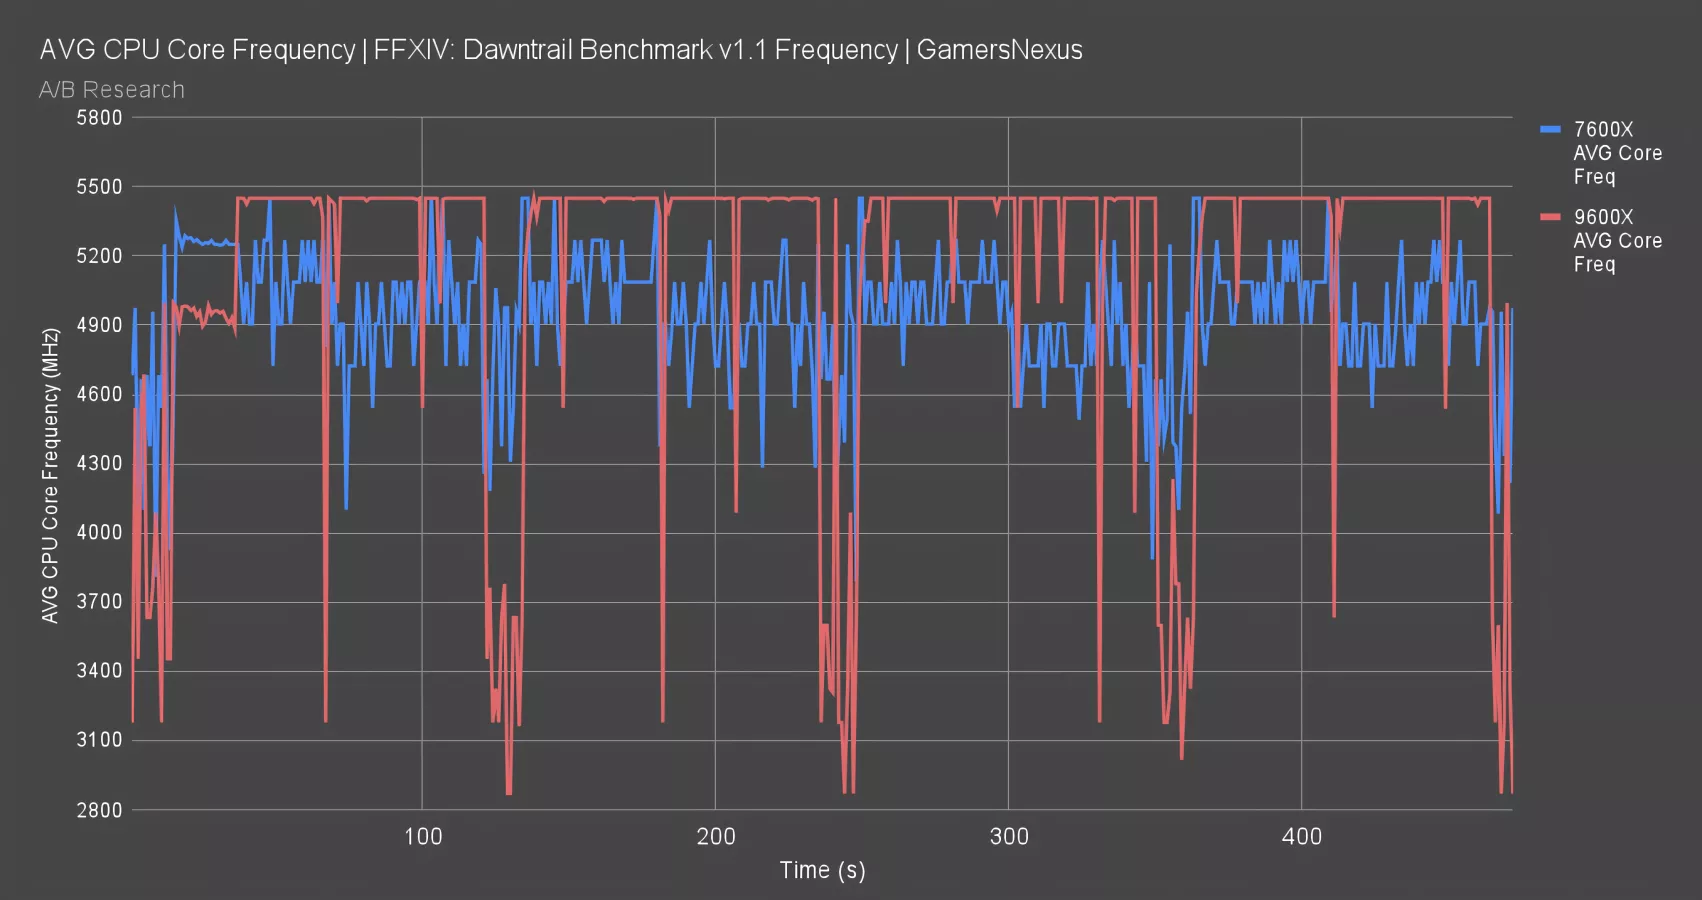
Here’s the frequency chart. In this one, The average all-core frequency has the 9600X basically pegged to 5450MHz, which explains the behavior we were seeing entirely. The 9600X is holding a higher clock, whereas the 7600X is fluctuating constantly with an average of around 4900 to 5000 MHz.
The 9600X is getting most of its 9-14% performance bump, depending on which R5 you compare against, as a result of this behavior. It’s also running higher power consumption because of it.
Stellaris Efficiency
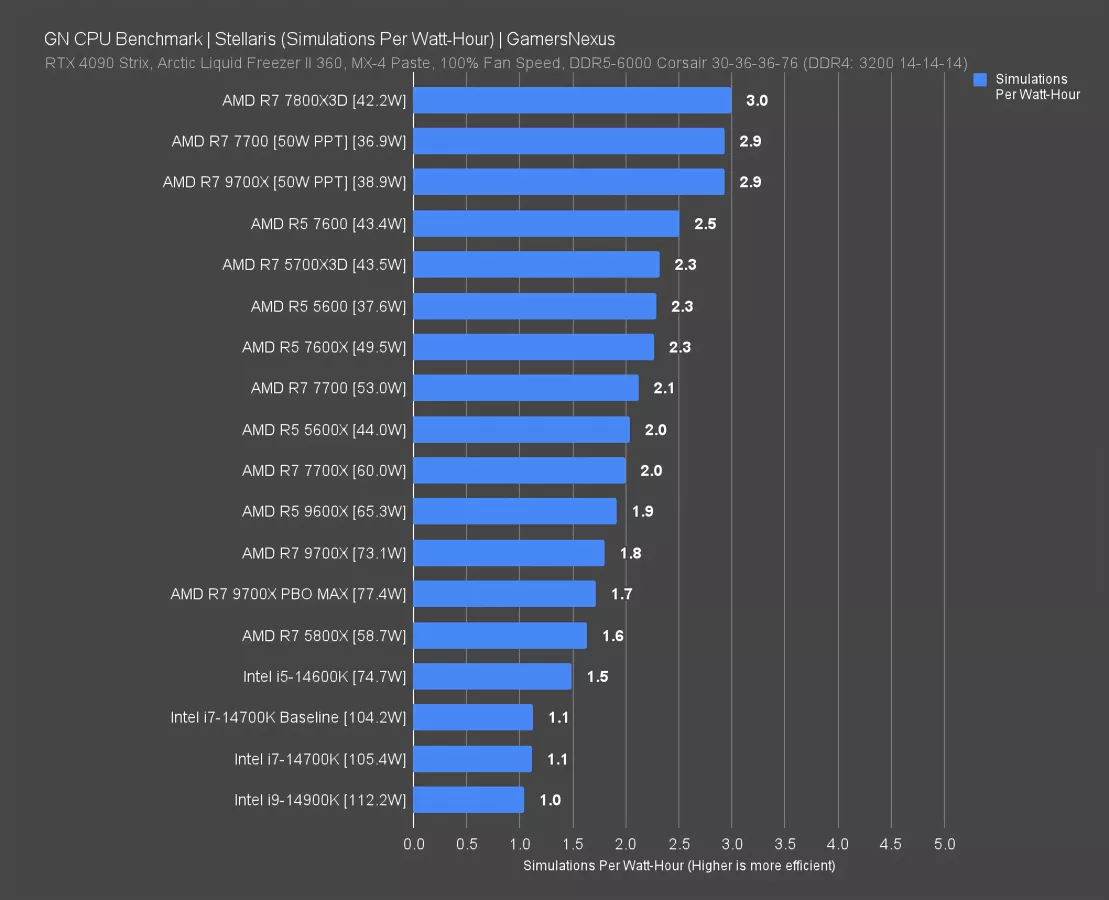
Let’s move to Stellaris. This one is interesting because it’s one of the games that plots a larger difference favoring the newer CPUs. The 9700X had an actually meaningful gain over the 7700X and 7700 here for the simulation time.
This chart shows the simulations per watt-hour. The base metric in this is time, not framerate, with the original test data being simulation time in seconds.
In this test, the 7800X3D is again supreme at 3 simulations per watt-hour. The next stock CPU is the 7600 at 2.5, then the 5700X3D. In this test, the extra cache on high-performance CPUs does not affect performance as much. The 5600 is tied with the 5700X3D for simulations per watt-hour, as is the 7600X. The new CPUs are further down: The 9700X is less efficient in this game than the 7700X and 7700 alike, and the 9600X is likewise less efficient than the 7600 and 7600X. In the case of the 7600, the 9600X falls far behind. The 7600 is 32% higher in rank here.
Intel lands at the bottom again, as predictable for its power consumption.
As for AMD, locking to 50W PPT caused the 7700 and 9700X to be equal in this test, contrary to the stock performance where the 9700X trailed the 7700.
F1 24 (Stock CPU Efficiency)
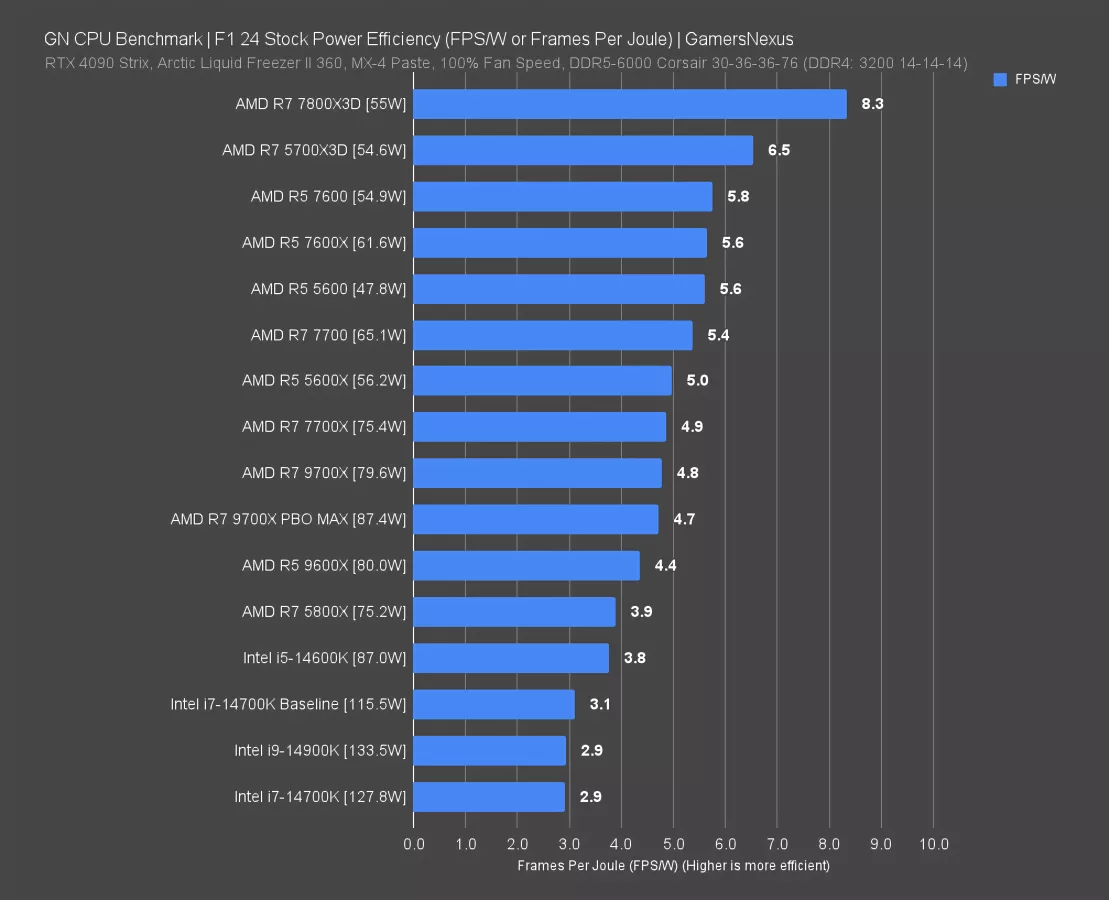
Now for F1 24. This one is good because the high framerate makes it easier to work with some of the numbers.
The stock 7800X3D crushes everything else on this chart -- and that includes the 9700X. Despite its all-core efficiency in some workstation tasks, the 9700X pulled on average 79.6W in this test against the 7800X3D’s 55W, and since it was also lower framerate at 380.2 FPS to the 7800X3D’s 458.1, the 7800X3D is a clear winner. It really is the best gaming CPU right now. Not only is it higher framerate, but lower power.
Even the two-generation-old 5700X3D is leading most of this chart. What’s super cool is that they run at the same average power, which means we accidentally end up with an additional controlled variable. That means that we’ve isolated for only FPS, so at the same power (or power-normalized), the newer 7800X3D is 28% more efficient. Actually, the 7600 non-X also ends up power normalized by pure coincidence. At 54.9W, it runs a 5.8 FPS/W average and is the most efficient out-of-box CPU without X3D that we’ve tested in this game so far. The 7600X is basically tied with it since the power draw went up slightly. The older R5 5600 (watch our review) is also in this area.
The 9600X CPU is a 65W TDP part, and yet compared to multiple generations of both the X and non-X R5 CPUs, it is less efficient in the actual gaming workload.
Intel sits at the floor here, but notably, you can see that the 14900K doesn’t draw the insane amounts of power it does in an all-core production workload. This goes back to what we were saying about games being generally lower intensity or at least more volatile.
F1 24 (PPT Limit & FPS Limit)
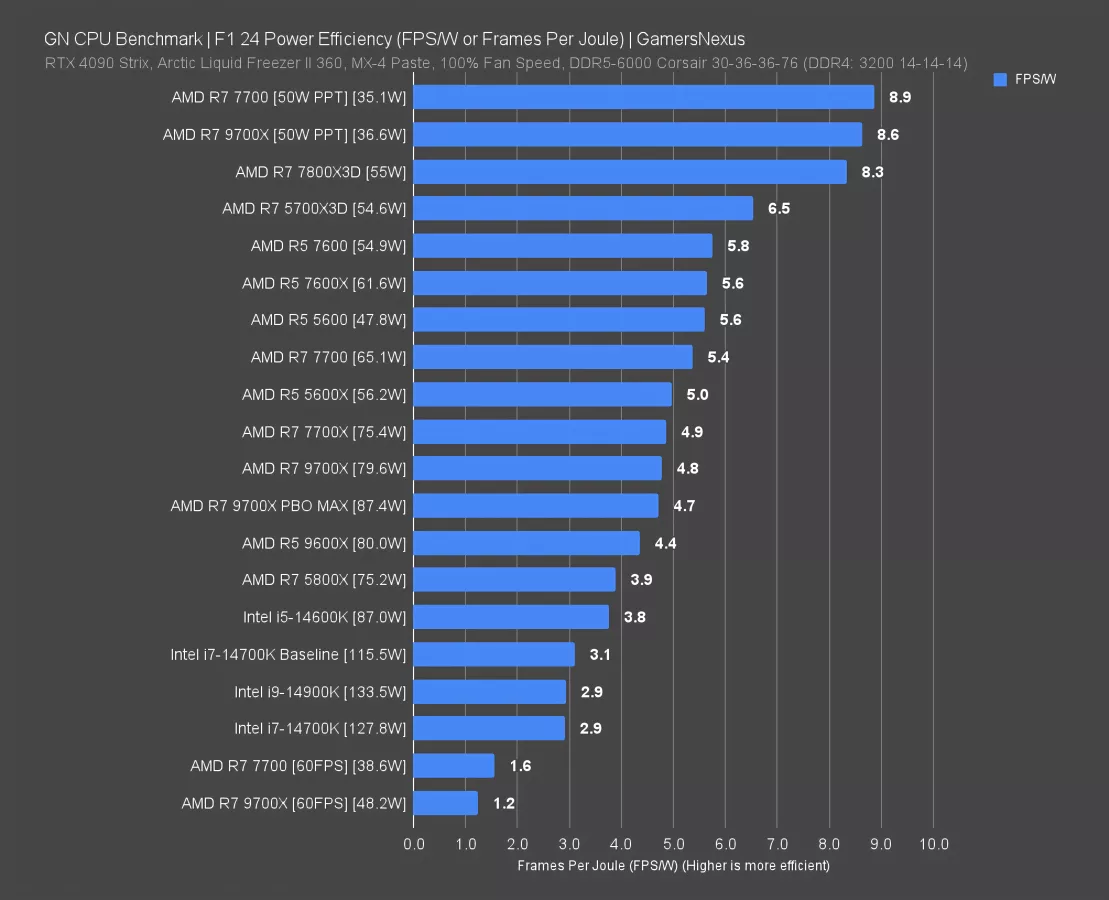
Now we’re adding a few entries to the chart. We’ll highlight the additions of the 50W PPT R7 7700, 50W PPT 9700X, and FPS-locked 9700X and 7700 non-X.
The 50W PPT entries run at almost 311 FPS for the 7700 and about 316 FPS for the 9700X. With the 50W PPT setting in BIOS, the CPUs end up at about 35-37W for EPS12V. This boosts their FPS/W above the 7800X3D, but obviously you could play this same game with the 7800X3D to leapfrog them. The point though is that the CPUs can be more efficient than stock, but you start losing a lot of performance. Here, we dropped 17% FPS from the stock 9700X.
Locking the framerate to 60 FPS still has the 7700 as above the 9700X. These two shouldn’t be compared to anything else: The efficiency appears much lower because we’ve just cut hundreds of FPS off the framerate, but a baseline level of power is still necessary to even run the CPU. Once again, it appears that the 9700X only deserves efficiency credit in some specific workloads.
Starfield Efficiency
We’ll look at another heavy gaming load next with Starfield.
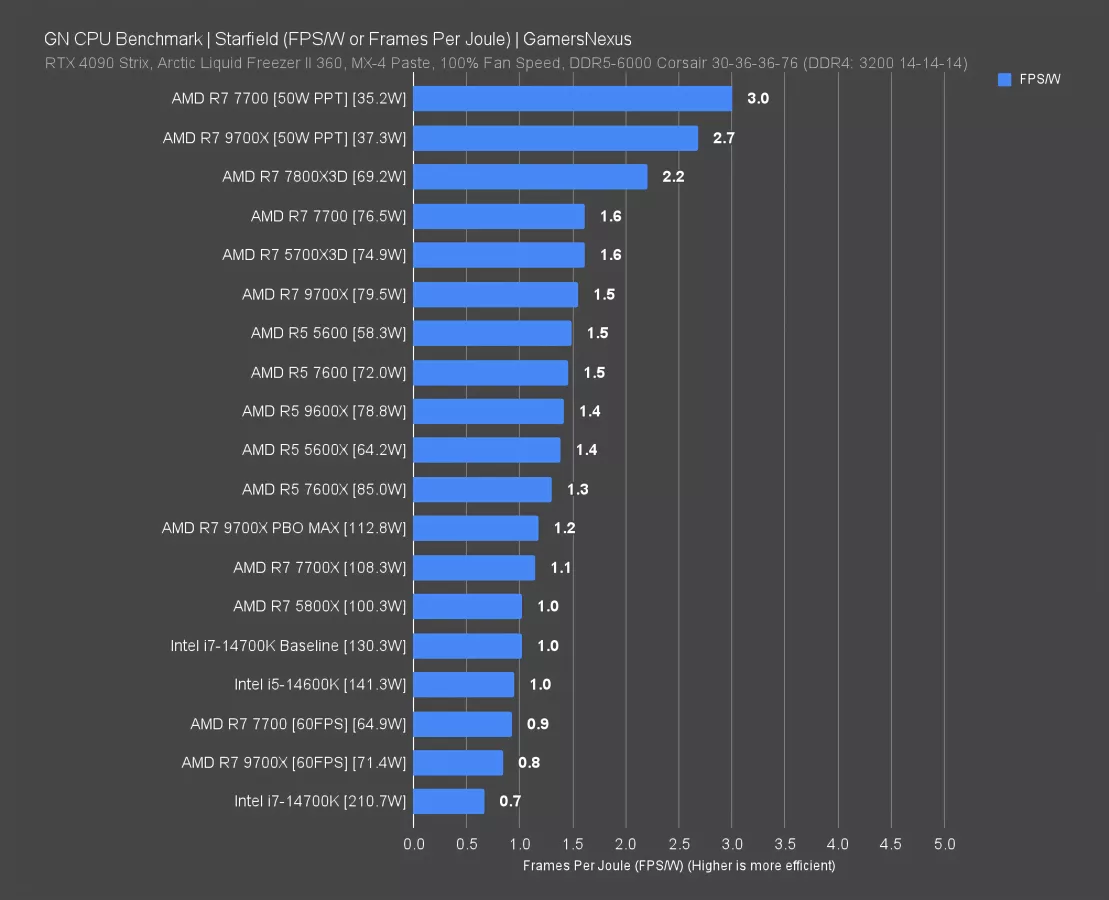
In this one, the 7800X3D is again the leading stock CPU. The 7700 is distant behind it and tied with the 5700X3D, both at 1.6 FPS/W. The 7700 and 9700X were pulling similar power in this one, nearly power-normalizing them. If you were to fully power normalize them, they’d be equal. Here, they are functionally equal but with the 7700 technically more efficient.
As for the R5 SKUs, the 9600X is about tied with the 7600 and 7600X, landing right between them. After this, the PBO MAX 9700X boosts its framerate, but pulls so much more power (33W more) that it predictably loses efficiency.
Intel pulls nearly as much power in this game as it does in full production workloads, but the baseline numbers show that this can be reduced with more limited PL1 and PL2 numbers.
As for the 60 FPS locked comparison, the 7700 ran more efficient again than the 9700X. The 9700X pulled more power to do the same work, making it less efficient. This is related to the same voltage and frequency behavior we described a moment ago.
Baldur’s Gate 3
Baldur’s Gate 3 is up now.
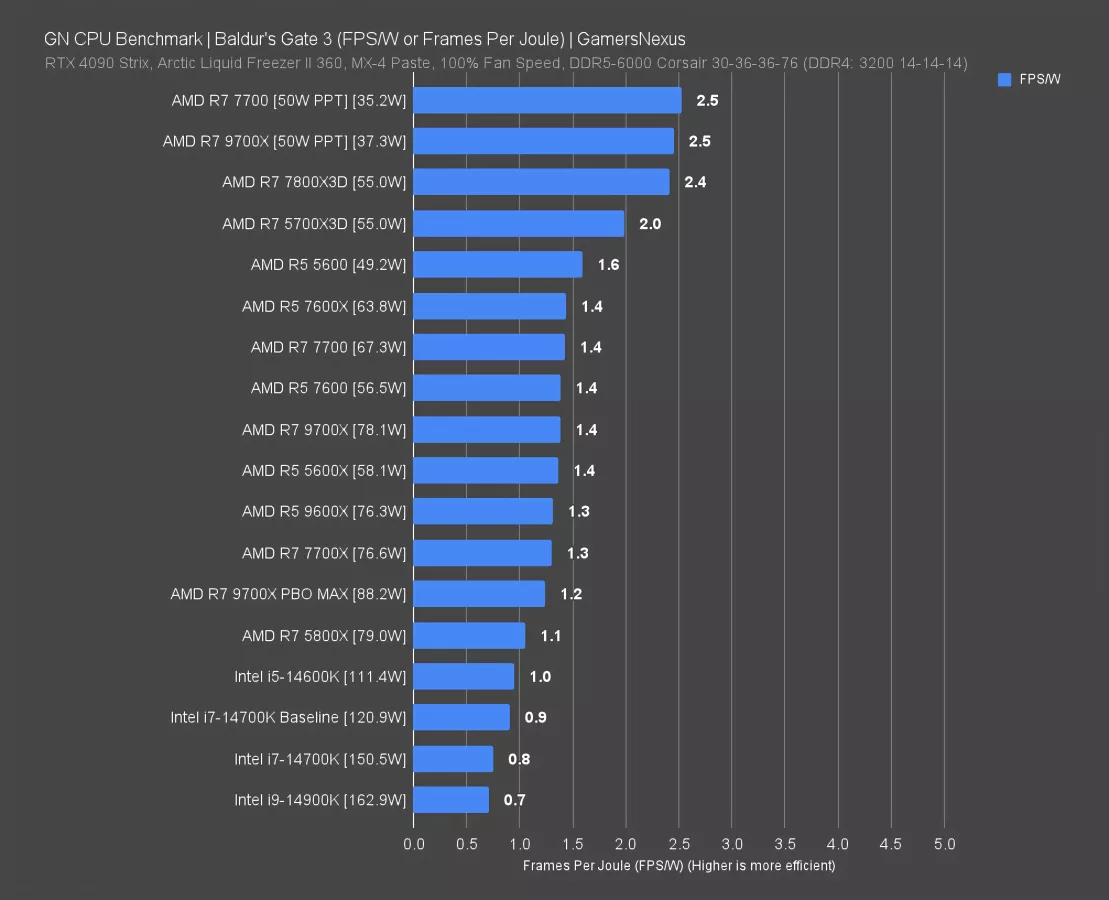
For this one, the 7800X3D again leads the chart, now at 2.4 FPS/W. The 5700X3D follows it at 2.0, with the 5600 next. A large group of devices scored the same, with everything from the R7 7700X at 1.3 FPS/W to the 7600X at 1.4 FPS/W functionally equivalent. The 9700X lands in here, tying with the 7700 and technically more efficient than the 7700X. This is one of the tests where the newer 9700X is about the same or slightly better in some cases against its direct predecessors. Locking the 7700 and 9700X to 50W PPT produced the same result, and if the 9700X were fully power-normalized and shed the last 2W, it’d have a technical 0.1 lead over the 7700 at 50W PPT, but basically they’re the same.
This is one of the better scenarios for Zen 5 in gaming, and it’s still generally not more efficient than the 7000 series in this game.
Rainbow Six Siege
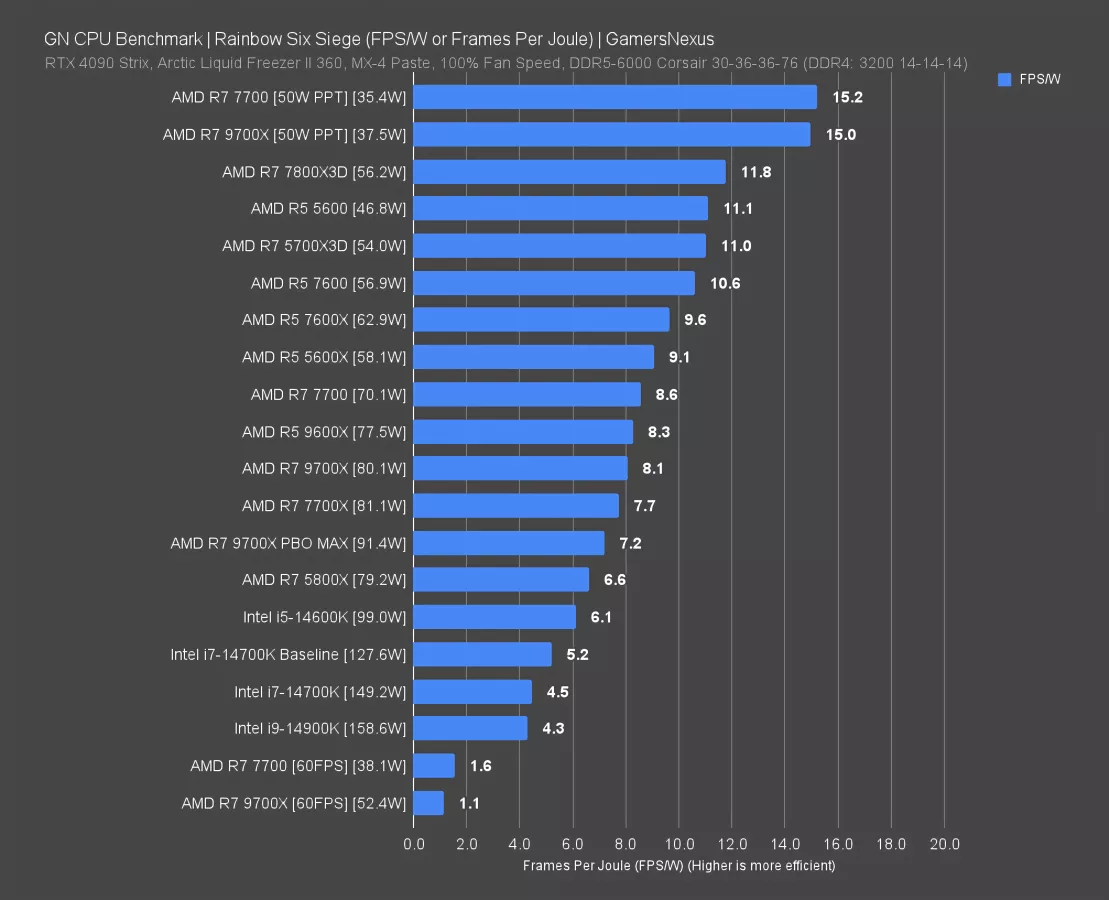
Rainbow Six is pretty interesting. This one runs such a high framerate that we finally get some double-digit numbers for FPS/W.
The 7700 and 9700X are remarkably efficient when locked to 50W PPT here, which is thanks to the fact that the game is so easy to make spew hundreds of frames per second even when extremely power limited. The end result is that we’re still soaking the base power requirement for operation with those large FPS numbers, enabling the gap that forms between the 7800X3D and the 50W PPT-limited CPUs.
The 7800X3D is next, functionally power-normalized with the 7600 and 5700X3D, but outperforming both. The newer CPUs improve in framerate over the prior generation, which helps the 9700X outrank the 7700X for efficiency -- but it’s still behind the 7700. Once again, the 7700 is running at a lower voltage and pushing lower clocks, which obviously contributes to a slightly lower performance, but also makes it more efficient.
The 9600X is beaten by both the 7600X and 7600. The 60FPS-locked 7700 and 9700X had the 9700X pulling significantly more power, again for reasons described earlier.
Despite Intel’s overall good framerate in this game, its high power consumption pulls it down in this chart.
7-Zip
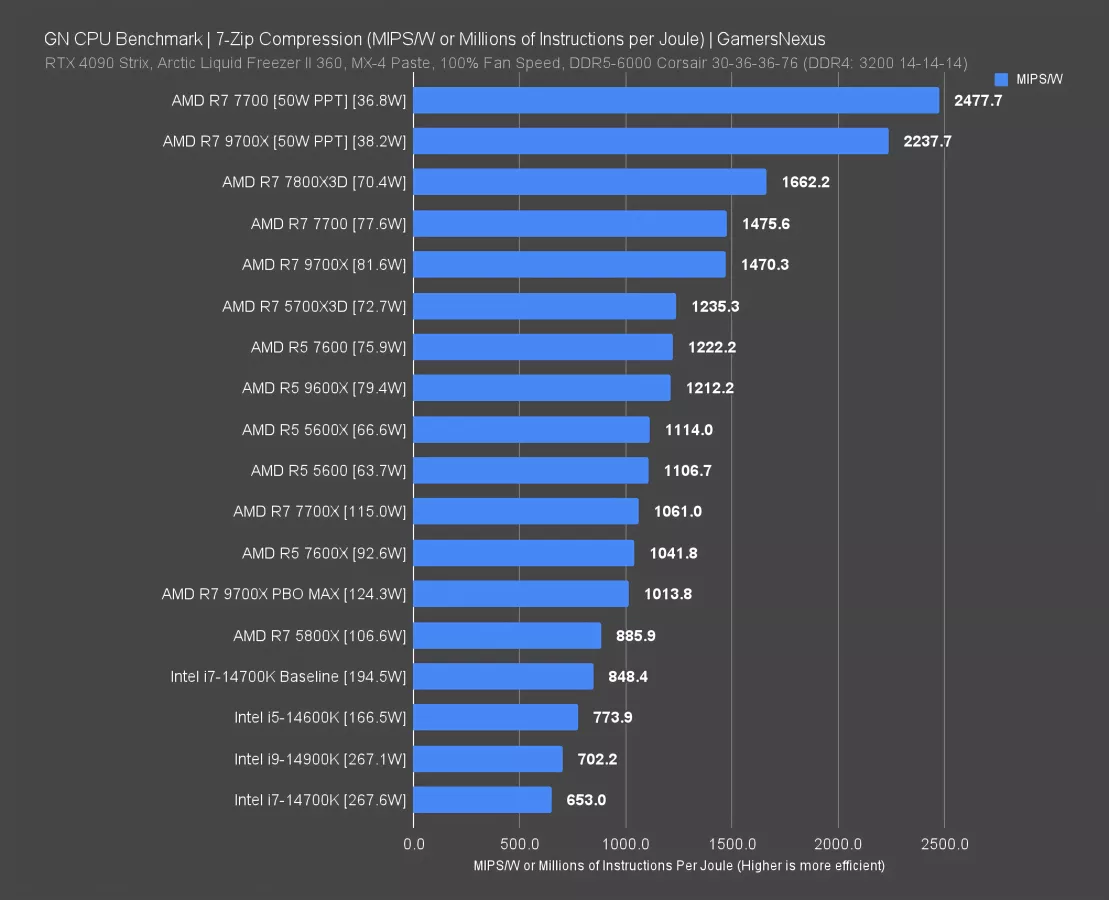
We’ll close this out with 7-Zip before we move to the 10-pt and 30-pt highs for each test. 7-Zip is represented in millions of instructions per second per watt. This could be simplified as millions of instructions per Joule, if you preferred. Same idea.
This one is intensive, but not in the same way as Blender -- it’s also a lot shorter, which can skew numbers the other direction.
The most efficient CPU in this test is the 7800X3D. It’s not the best performer, unlike the gaming tests where it is both the highest framerate and most efficient, but it is the most efficient on this chart. The 7700 and 9700X are next and are tied with each other. These two are within margin of error; so, at best here, the new CPU is the same efficiency as the prior 65W TDP part. It remains more efficient than the 7700X by a significant margin, with an uplift of 39%. But again, the difference is about 0% against the 7700. If the 9700X were fully power-normalized at the same 77.6W -- which is really hard to dial in that much -- they’d be even more equal.
As for the 9600X, it’s equal to the 7600 and within error. It’s not worse or less efficient, but it’s not better. It is better than the 7600X.
Intel remains the most power-hungry here, approaching 300W in some tests.
10-pt & 30-pt Highs (Stellaris)
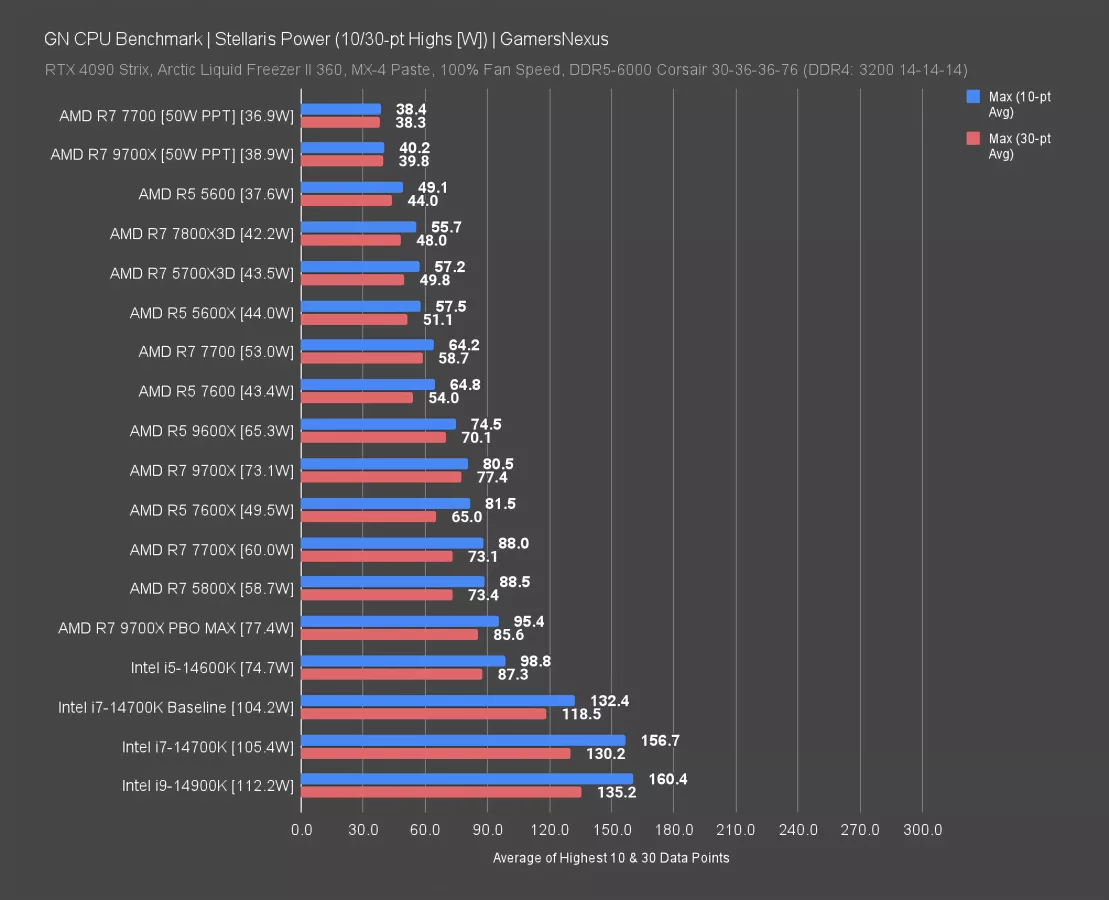
Here are the last few charts of the 10-pt and 30-pt highs that we previewed with Cyberpunk earlier.
In Stellaris, the data between the highs and average is much wider overall (with the exception of the PPT-limited tests at the top). The 14900K had a 160W high against its 112W average during the game itself, which again accounts for loading during this benchmark. The 7800X3D also deviates from its average, but has results low enough overall that it doesn’t matter much.
We saw higher spikes on the 7600X and 7700X than the 9700X and 9600X, which makes sense for their rated TDPs. The 7600 and 7700 had lower highs, though, which correlates with the lower voltage that we observed earlier (in further correlation with the frequency differences).
10-pt & 30-pt Highs (FFXIV)
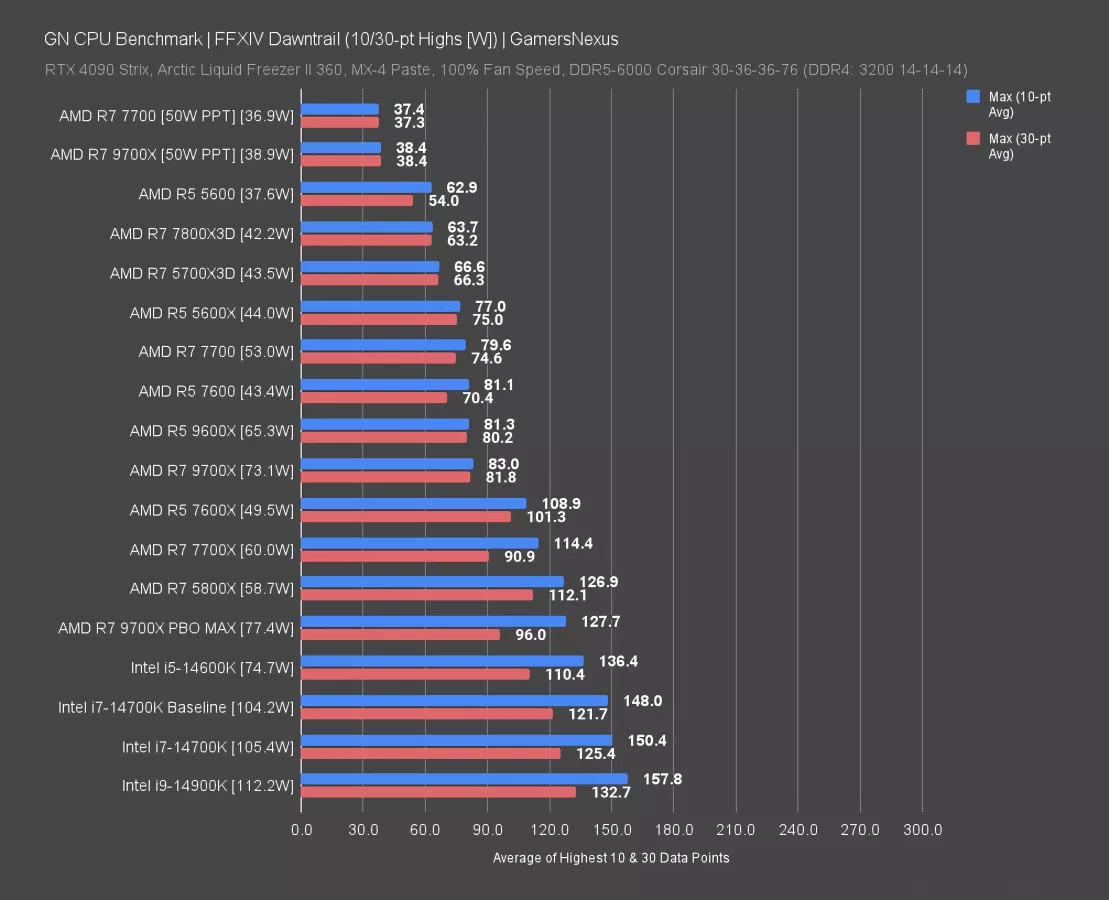
The last one we’ll look at is Final Fantasy. This one gets time in the story for being so different. We already talked about how the game has some unique behaviors for average power consumption in-game, but what’s also unique is the loading power. The gap between the 10- and 30-pt bars here helps illustrate how infrequent some of these spikes are.
The 7700 ran at 53W on average in the testing, but spiked to about 80W in some of the loading in between. The 9700X ran at 73.1W in testing on average, but spiked to 83W in loading -- a smaller percentage increase than the 7700, but more in total. This is also why it’s so difficult sometimes to have a short answer for whether a CPU is efficient or not. To fully analyze this, we’d probably need to measure the total loading time or something as well.
Cost
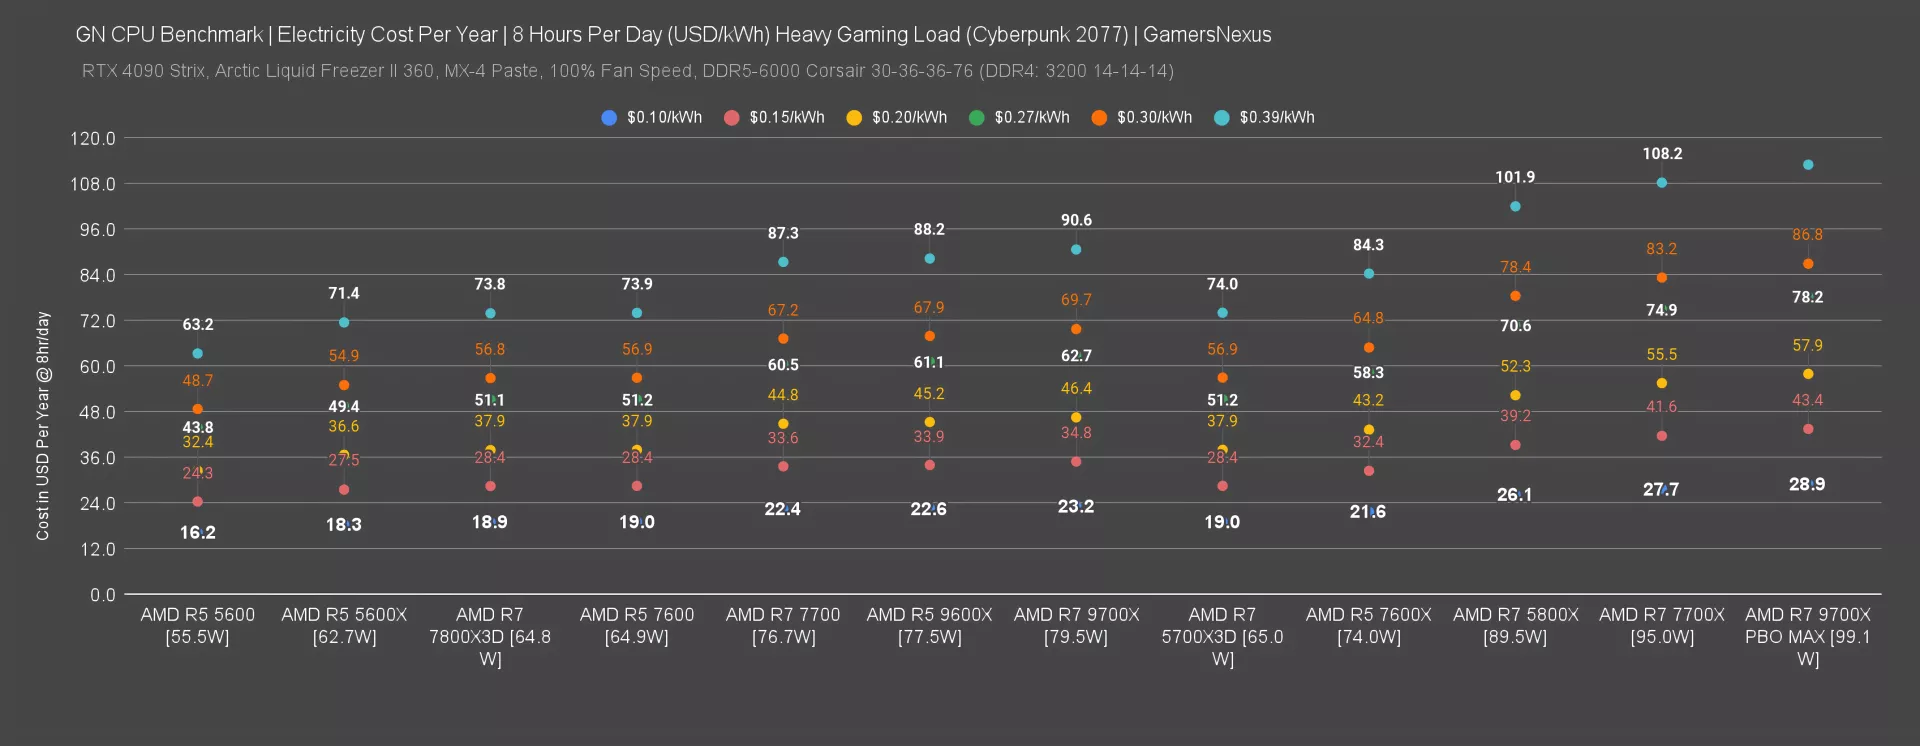
Finally, as for what this all means, we’ll put this into perspective with a simple chart. This looks at the heaviest gaming workload we tested (Cyberpunk), calculated as a measurement of kWh for energy cost. Because the cost for just a CPU is so low, we went with the extreme: This is total shut-in, 8 hours a day of gaming for a full year.
Our electricity is nuclear where we’re at and is $0.10/kWh, but we know that in Europe or even California with variable rates, it can go even beyond $0.40/kWh. We’ve scaled up to $0.39 here, using some online tools to look at common prices.
This highlights the difference in cost per year if you used each of these CPUs to play the heaviest possible game for 8 hours a day.
For our electricity cost, the difference is basically a rounding error -- especially if you aren’t using the system this much.
If you were to use the 5700X3D for 8 hours of gaming a day for a year, it’d cost you about $19 at our electricity rate.
For the 7800X3D, those numbers would be about the same. The 9700X would plot at $23 for the floor in these conditions, or $91 for the ceiling. Obviously, all of these numbers decrease with less use, or could increase with higher electricity cost. This isn’t a benchmark, it’s just math -- so you can apply this to your own situation by looking up a kWh cost calculator and estimating your usage.
Likewise, if you were building a rendering machine and running it literally nonstop, the 9700X would be a lower cost per unit of work completed -- but it’d be easily beaten by Eco Mode parts like the 7950X or Threadripper, as we’ve shown in the past.
Conclusion

We’re not going to recap the results here: If you want to see them, you can check through the charts.
It’s a complicated subject and we’ve already walked through it. The shortest version is that we are hardening our stance against the 9700X (and now adding the 9600X) that they make less sense to buy than Zen 4. Previously, this was primarily because the value of Zen 4 was better, the performance was sometimes better, and functionality (as in actually working). Patrick fought the platform for a few days and had this funny quip the other day: “I believe AMD that it was an ‘architectural overhaul’ because on Zen 4, the memory worked and now it doesn’t.” As a reminder, and this was overshadowed by people demanding we praise the efficiency more in the 9700X review, our 9600X didn’t even work with EXPO on literally a single kit. It was broken. Our new one works fine.
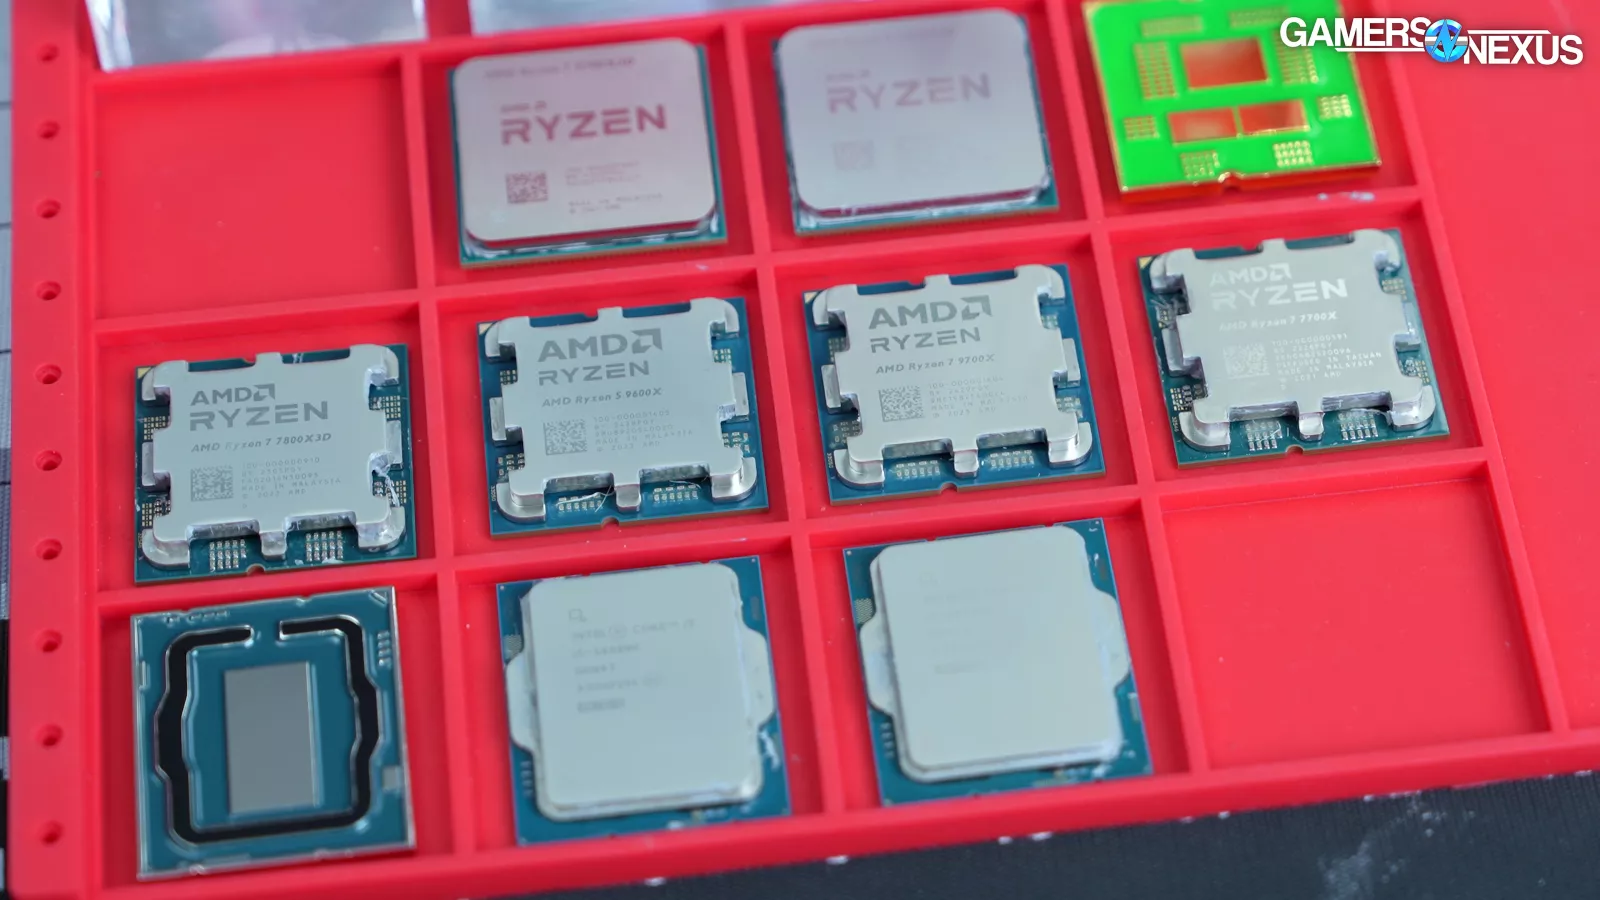
Those were the reasons we didn’t recommend Zen 5. But now, it’s also because the efficiency isn’t as good as just Blender shows. The Blender result is accurate, but what we’ve learned from this situation is that there is enough of a demand for efficiency testing now that we clearly need to overhaul our representation of it. As a result, we immediately have added gaming efficiency benchmarks for our next reviews coming up. That’s the lesson we’ve learned. The downside is that the reviews get longer or other tests get cut as a result for practical reasons.
Behind the scenes, AMD gave reviewers almost no time with these CPUs, especially when factoring-in that we received two CPUs that required 2 days of troubleshooting to even get running. This meant limited time to expand testing, as our test suite already required every hour of that review window to complete. Now that we’ve had another week to work on these parts, it’s made us cynically wonder if AMD’s decisions were strategic to limit time reviewers would have. Less time means a reviewer is less able to explore all the branching problems with a product. We explored the memory compatibility issues and confirmed them on our parts, but that meant we lost two days that could have been used on this task. This comes after AMD had already strung us along for 3 weeks with missed promises of CPU delivery for reviews, leading to an unpredictable schedule.
