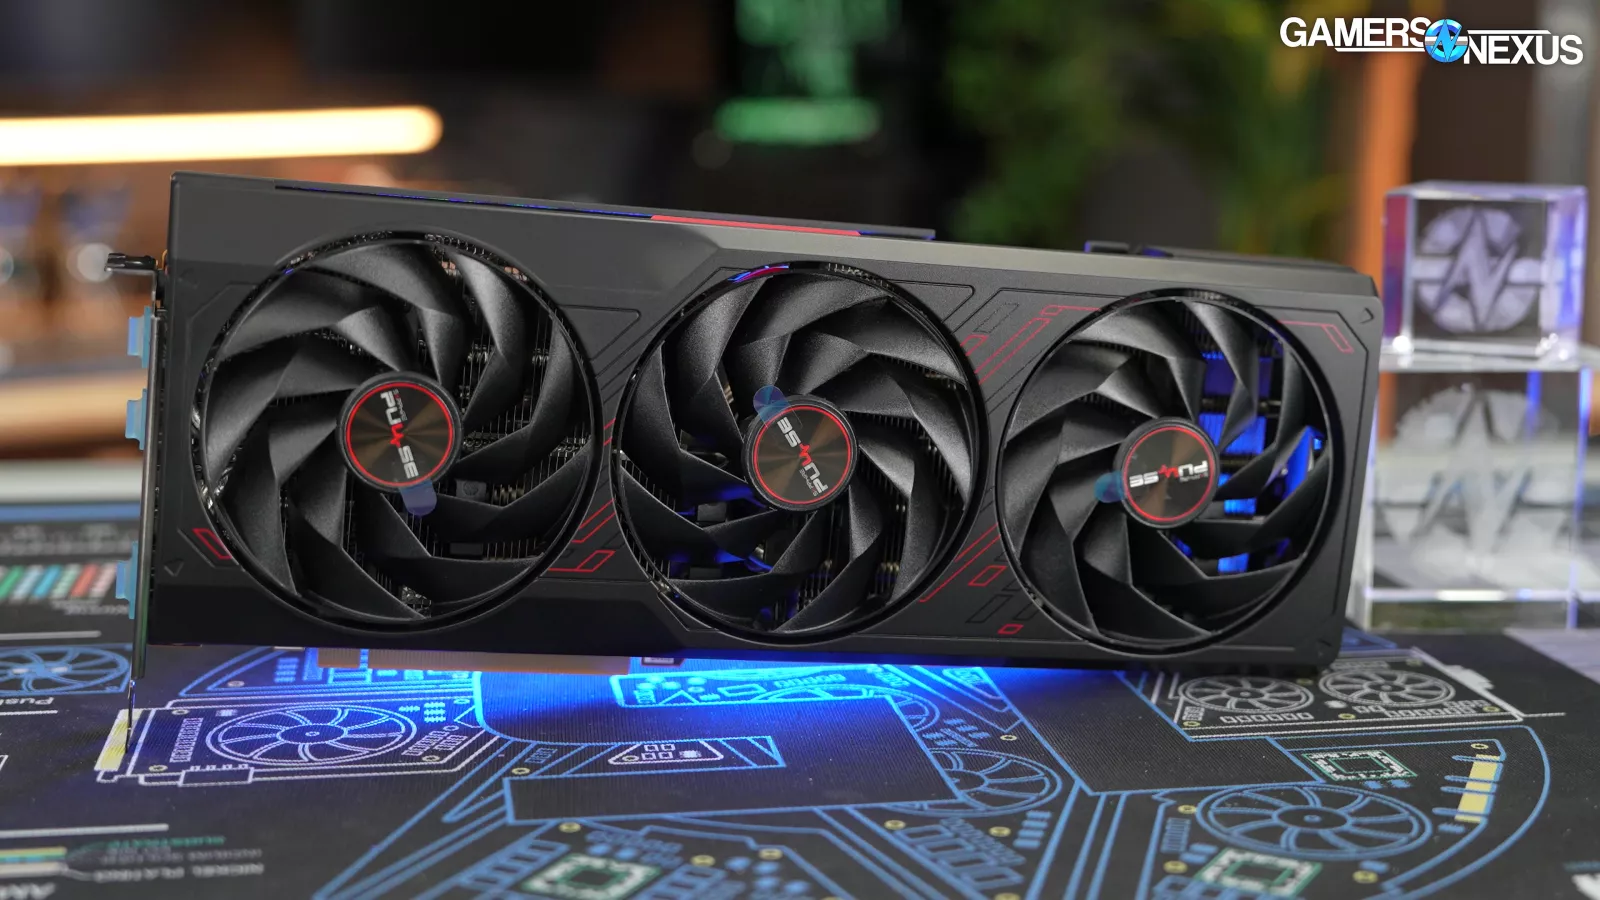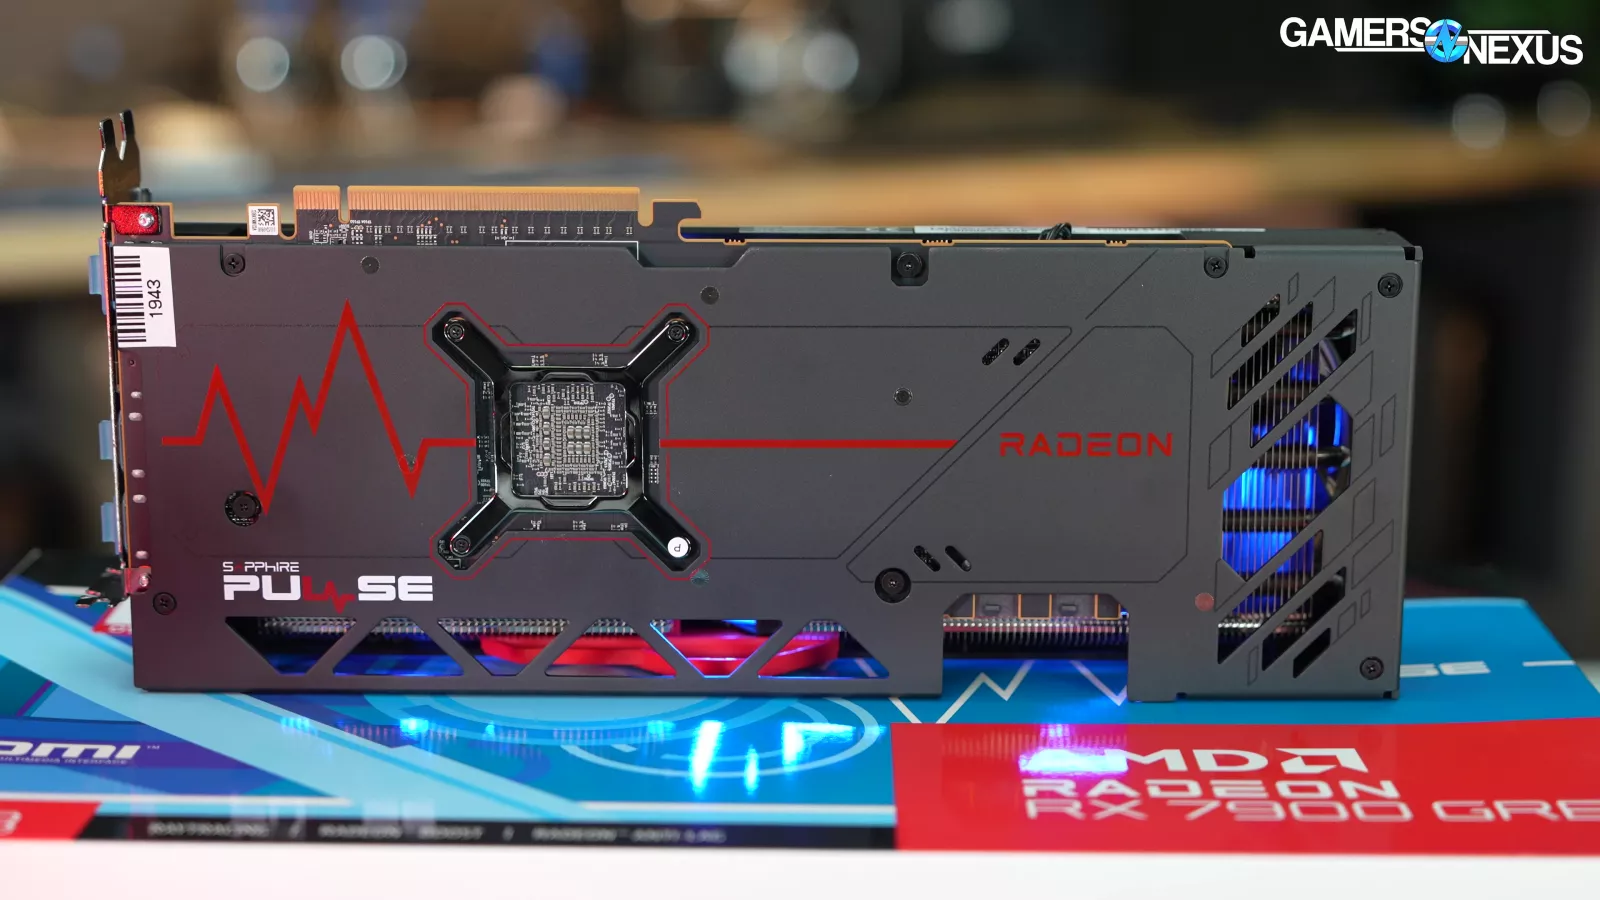
AMD Radeon RX 7900 GRE GPU Review & Benchmarks vs. RX 7900 XT, 7800 XT, RTX 4070 Super
Last Updated:
Previously only released in China, the 7900 GRE is now available more widely. We put it to the test.
The Highlights
- With 80 Compute Units, the 7900 GRE has less CUs than the 7900 XT but more than the 7800 XT
- Its closest NVIDIA competitor is the RTX 4070, which holds a significant advantage in some ray tracing workloads
- The 7900 GRE generally performs equidistant between the RX 7900 XT and 7800 XT
- Original MSRP: $550
- Release Date: February 27, 2024 (international release)
Table of Contents
- AutoTOC
Intro
AMD liked its 7900 GRE so much that it’s launching it a second time, this time to the rest of the world. The card originally shipped to China, adopting the naming “Golden Rabbit Edition” for the launch, and we actually bought it last year -- but because of its limited availability, we never got around to reviewing it.
AMD has changed its mind and is now making the 7900 GRE available at an MSRP of $550 for the rest of the world. That’s a huge change, because the card slots-in and shuffles the stack at the now-critical battleground of $500-$600, which NVIDIA is currently heavily occupying with its doubled-up RTX 4070 and 4070 Super. The RX 7900 GRE allows AMD to now offer more selection in the same price range, giving NVIDIA some competition that we think is deserving of coverage.
Intel Arc is absent in this price category, but we just ran a revisit of it for those interested in performance.
Editor's note: This was originally published on February 26, 2024 as a video. This content has been adapted to written format for this article and is unchanged from the original publication.
Credits
Test Lead, Host, Writing
Steve Burke
Testing
Mike Gaglione
Camera, Video Editing
Vitalii Makhnovets
Video Editing
Tim Phetdara
Web Editing
Jimmy Thang
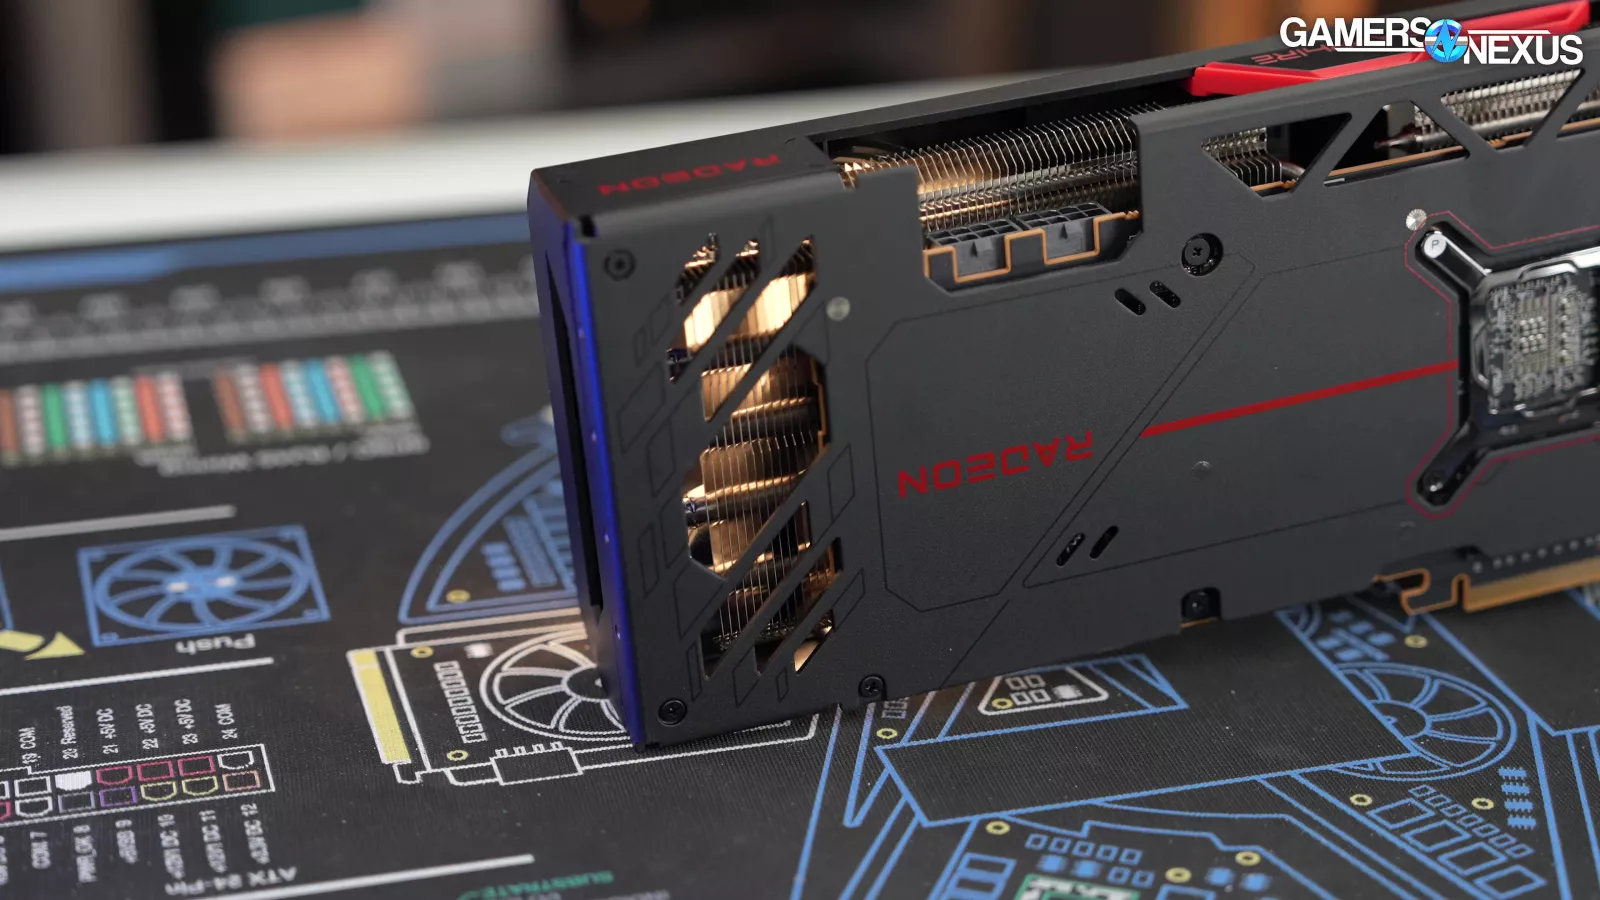
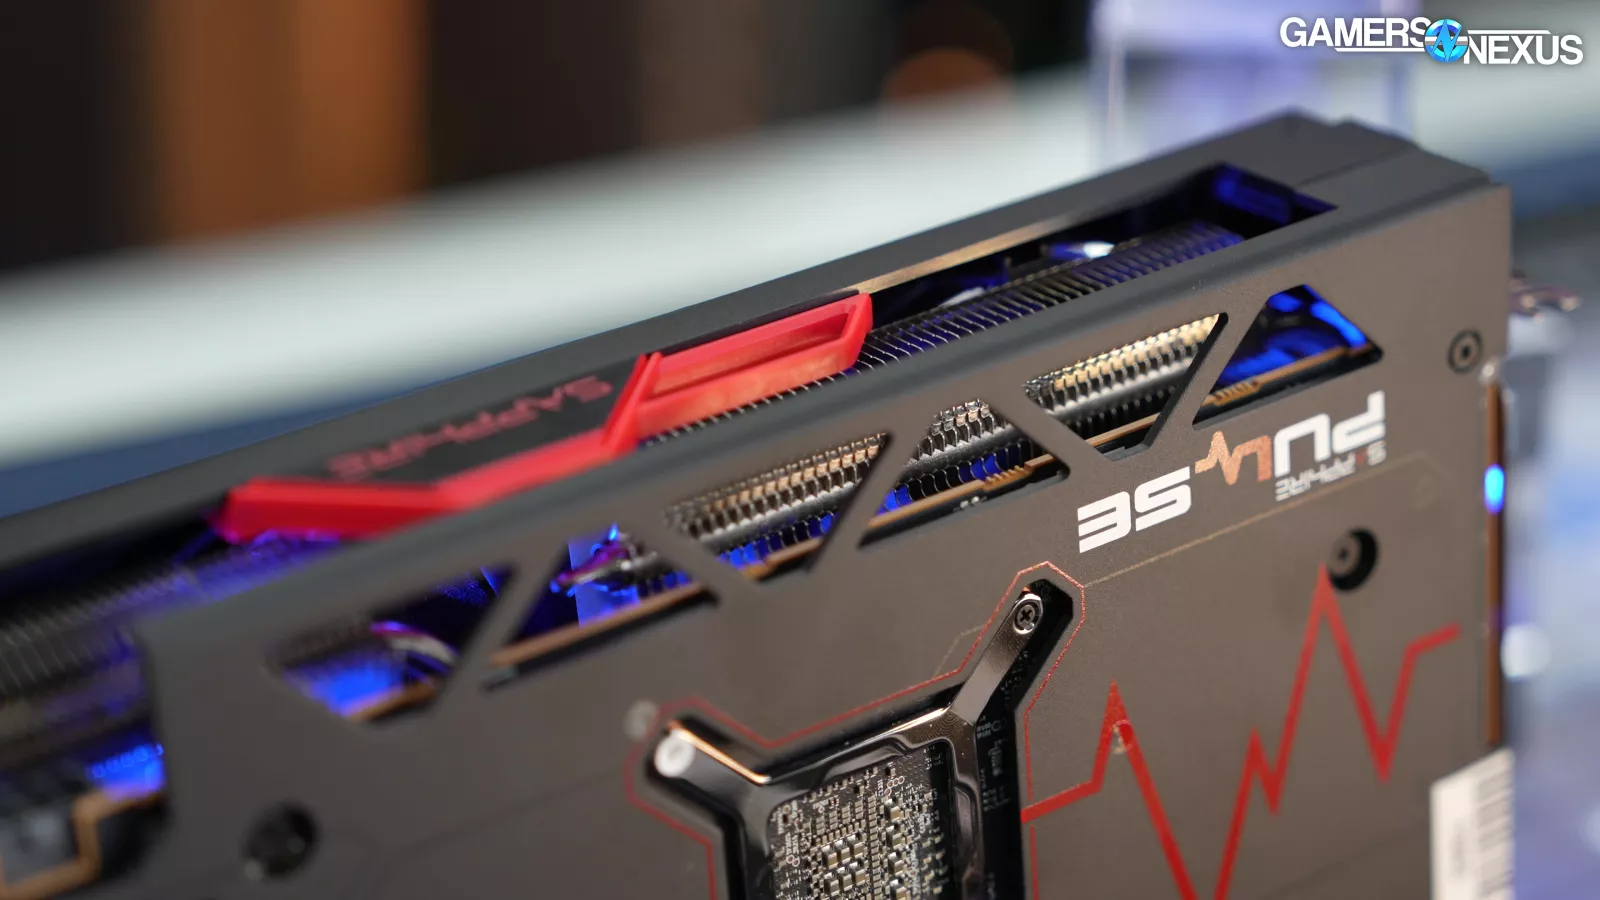
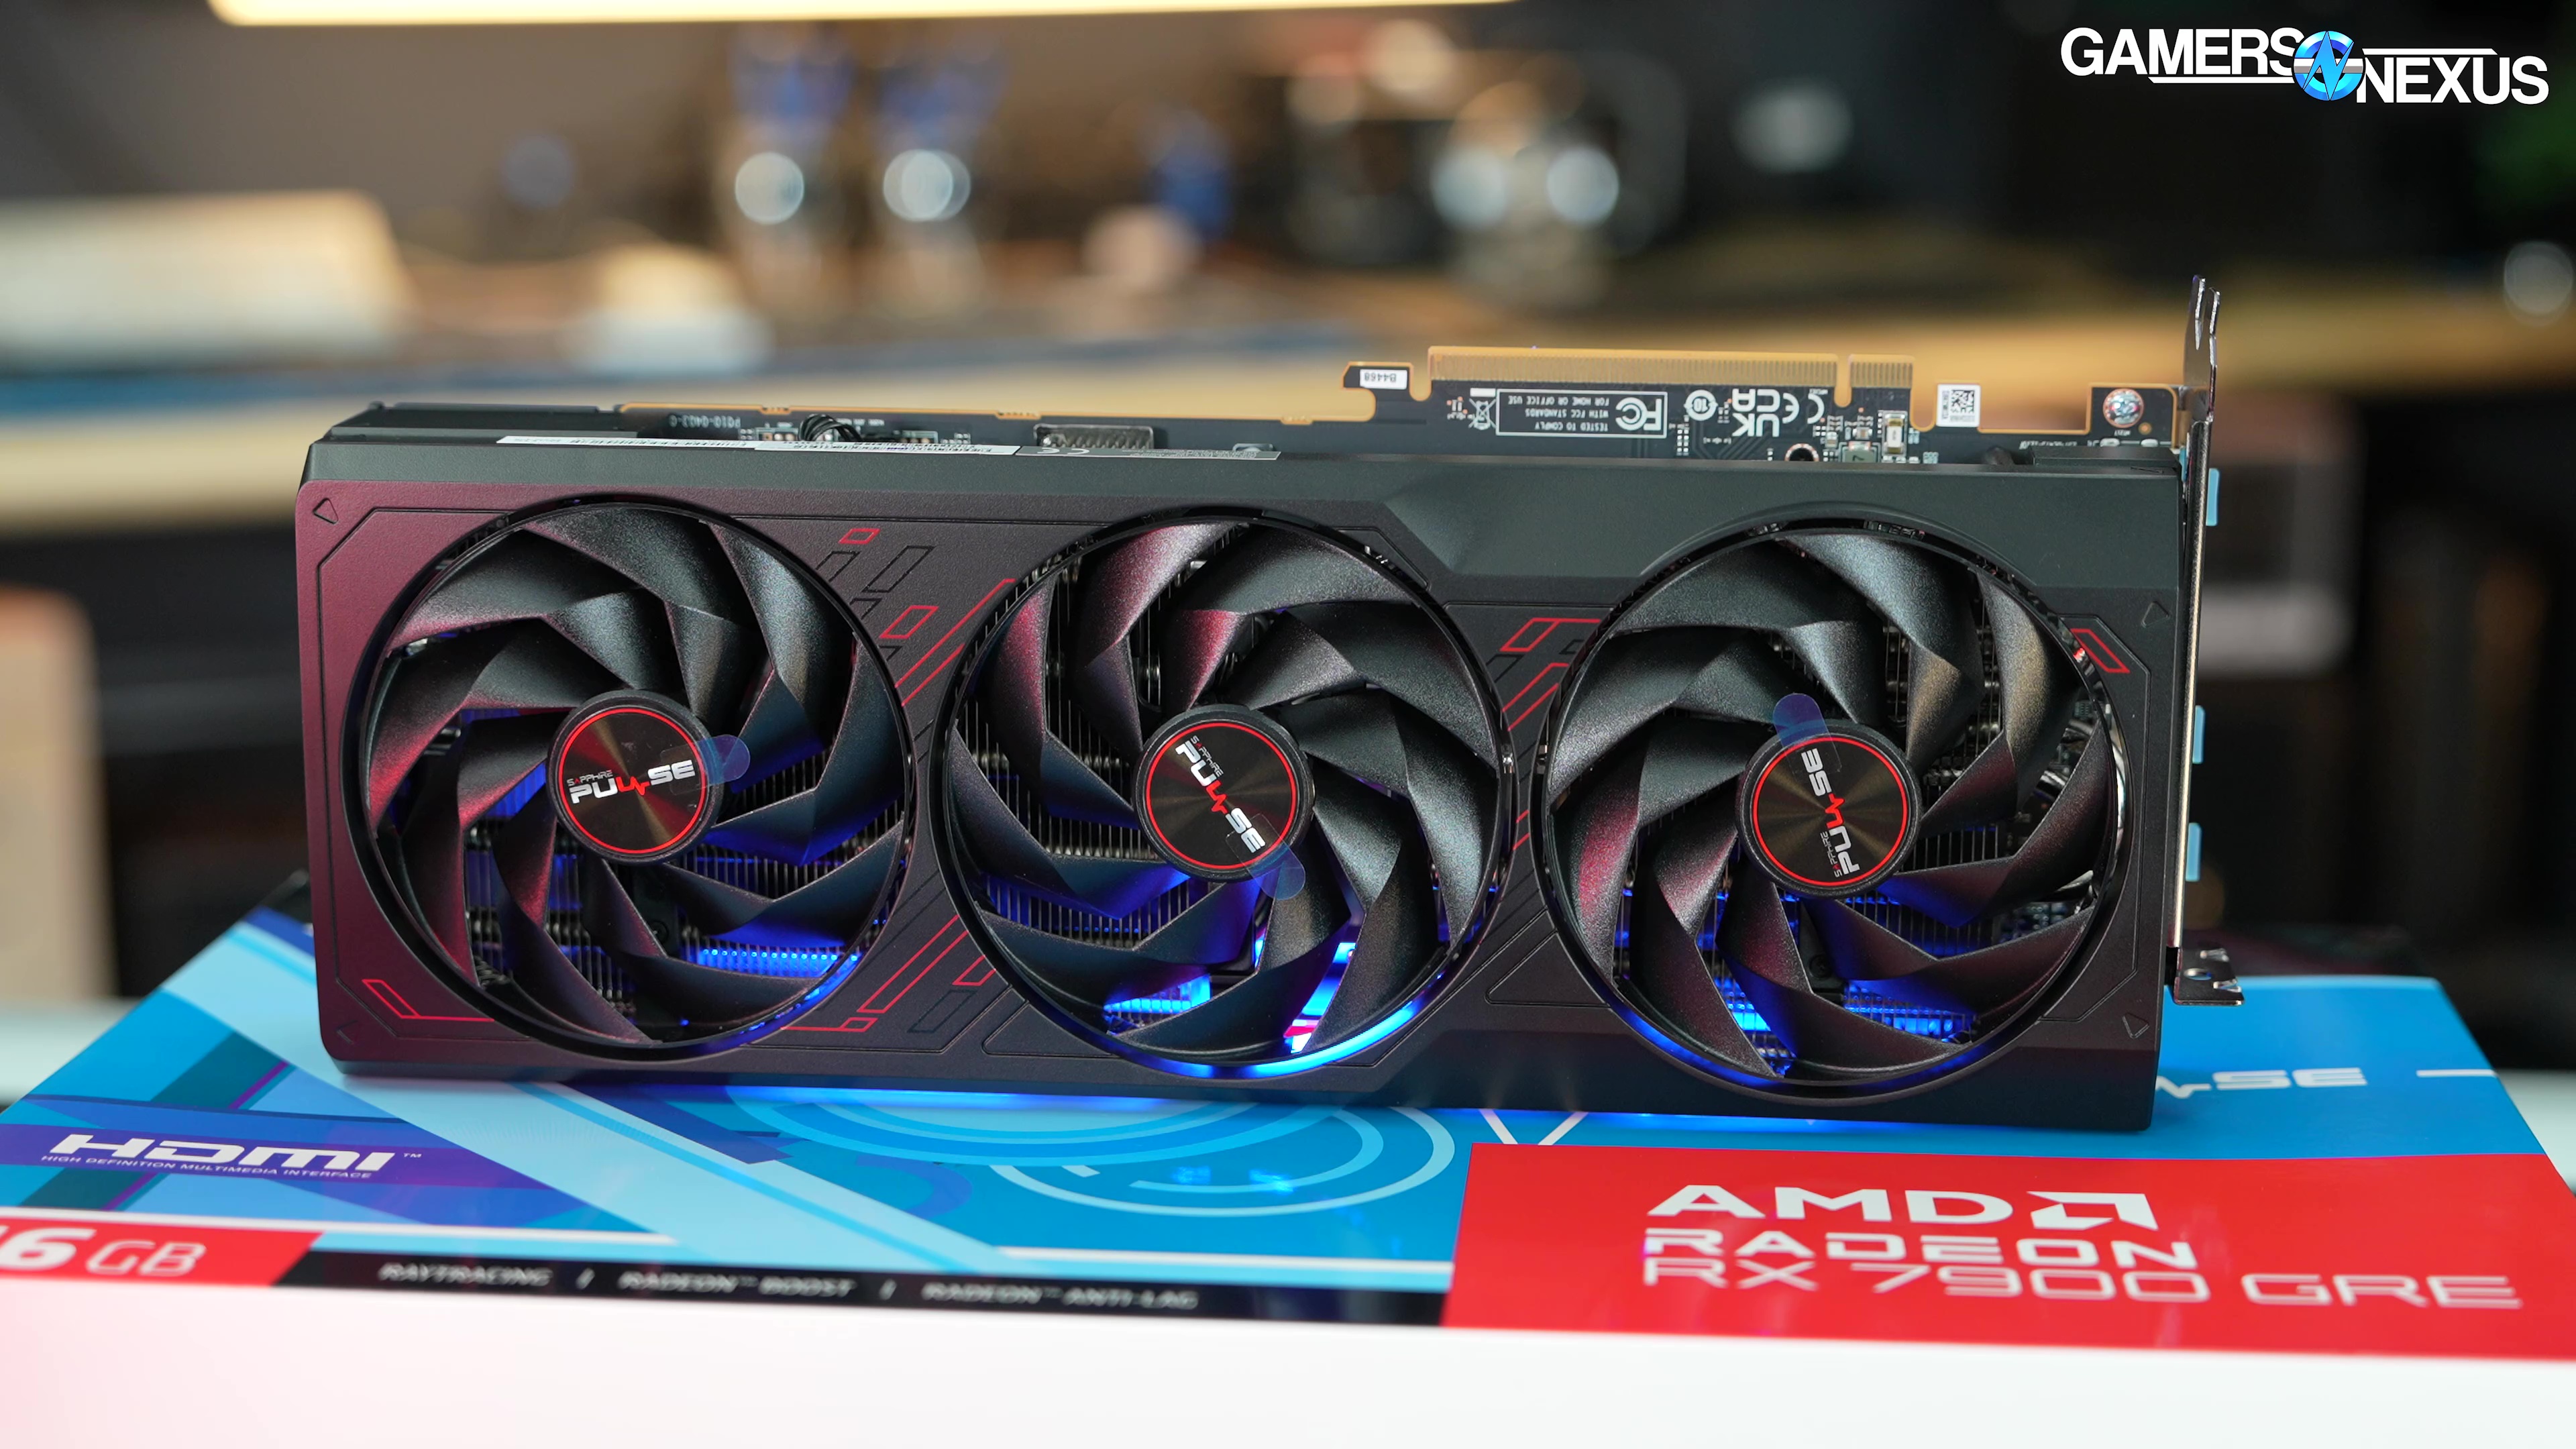
AMD RX 7900 GRE Overview
This card has already launched so it isn’t a new GPU, but it’s now more widely available and is worth talking about.
There are more partner models available now than at its original launch.
The $550 price mark anchors it right against the RTX 4070 (watch our review) and 4070 Super (read our review). It may displace the 7800 XT. We wouldn’t be surprised to see its price drop alongside the 7700 XT.
Specs Differences
Here’s a quick overview of the specs.
AMD RX 7900 XT, 7900 GRE, & 7800 XT Specs
| AMD RX 7900 XT | AMD RX 7900 GRE | AMD RX 7800 XT | |
| GPU Die | Navi 31 | Navi 31 | Navi 32 |
| Architecture | RDNA 3 | RDNA 3 | RDNA 3 |
| Memory Capacity | 20GB G6 | 16GB G6 | 16GB G6 |
| Memory Bus | 320-bit | 256-bit | 256-bit |
| Memory Bandwidth | 800GB/s | 576GB/s | 624GB/s |
| Compute Units (CUs) | 84 | 80 | 60 |
| Stream Processors | 5376 | 5120 | 3840 |
| RT Cores | 84 | 80 | 60 |
| TMUs | 336 | 320 | 240 |
| ROPs | 192 | 192 | 96 |
| "Game" / Boost | 2000-2400MHz | 1880-2245MHz | 2124-2430MHz |
| AMD Rated Board Power | 315W | 260W | 263W |
The RX 7900 GRE has 80 Compute Units, which is cut down from 84 on the 7900 XT and boosted from 60 on the 7800 XT. The gap between the 7800 XT (watch our review) and 7900 GRE will primarily emerge in situations where the compute workload is higher, although the 7900 GRE’s clocks are lower than the 7800 XT by pure spec sheet. Partner models can boost this higher, however, and will make-up for the difference.
TDP is about the same between these cards, hence the lower power budget available for boosting while carrying more CUs than the 7800 XT. Memory bandwidth is also superior on the 7800 XT as a result of higher memory clocks. The 7900 XT’s main advantage is the hugely increased memory bandwidth.
Current GPU Pricing & Alternatives
It’d help to get a quick pricing update to understand the closest alternatives.
The RX 7900 GRE should be $550 when it hits retailers worldwide.
The RX 7900 XT (read our revisit) has finally fallen in price -- again -- and seems to be stable at around $730 to $750, but we’ve seen some options occasionally hit $700. At $700, it’s becoming a good overall value. But even that is $150 more expensive than the base 7900 GRE price, so they’re different price classes.
The RX 7800 XT has an MSRP of $500 and currently has units from $490 to $500 with regular availability. That’ll be the closest price alternative to the 7900 GRE at $50 cheaper.
NVIDIA’s closest price competitors would be the RTX 4070 Super at the upper end, at $590 and up. Decent cards can be had at $600. The RTX 4070 wasn’t discontinued and has been kept at around $550 officially, but we saw a few models around $525 to $540 on Newegg.
As for the third player in the market, Intel’s closest card would be the Arc A770 at $290 to $300. This is a distant price class and isn’t really competition for someone seeking to spend in the $500+ range, but check out our recent Arc revisit for our thoughts on it.
Let’s get into the benchmarks.
GPU Reviews Test Bench
| Part | Component | Provided By |
| CPU | Intel Core i7-12700KF Overclocked (4.9GHz P-Cores, 3.9GHz E-Cores) | Bought by GN |
| Motherboard | MSI Z690 Unify | MSI |
| RAM | DDR5-6000 G.Skill Trident Z (manually tightened timings) | G.Skill |
| Cooler | Arctic Liquid Freezer II 360 @ 100% Fan Speed | Bought by GN |
| PSU | EVGA 1600W T2 Supernova Corsair AX1600i | EVGA Corsair |
| OS | Windows 11 | Bought by GN |

AMD RX 7900 GRE Game Benchmarks
Resident Evil 4
1080p Benchmarks
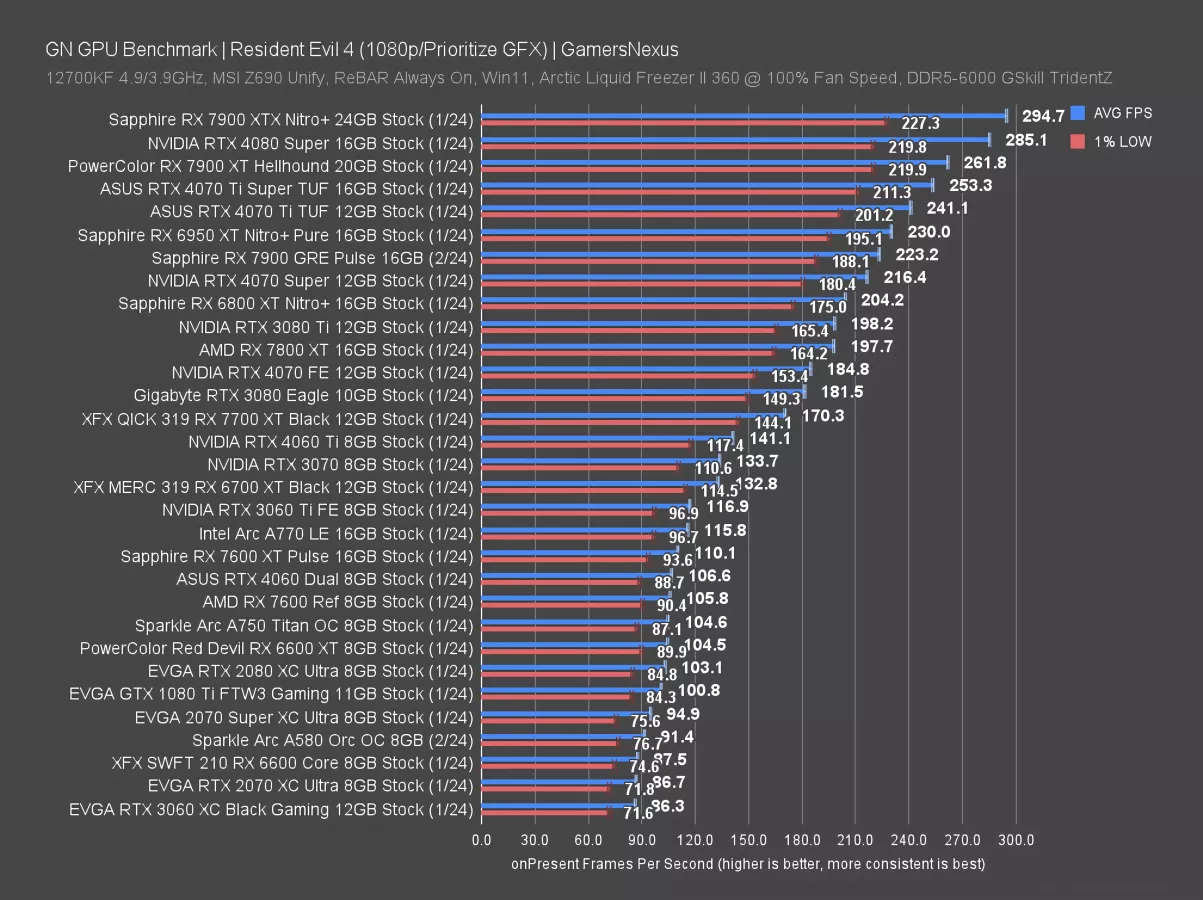
In Resident Evil 4 at 1080p, the RX 7900 GRE landed at 223 FPS AVG, which has it between the RTX 4070 Super and the RX 6950 XT (watch our review). The 6950 XT was about $600 when we last saw it available new. The 4070 Super is currently $590 to $600, so the 7900 GRE ends up cheaper here while outperforming the 4070 Super by 3.1%. It’s not likely to be noticeable, but it is a real advantage (and the price is noticeable).
That means the 4070 Ti Super leads by 13%, with the 7900 XT 17% ahead of the 7900 GRE. Lower down the stack, the 6800 XT remains an impressive performer and sits just below the 4070 Super, with the 7800 XT at 198 FPS AVG, giving the 7900 GRE a 13% lead.
1440p Benchmarks
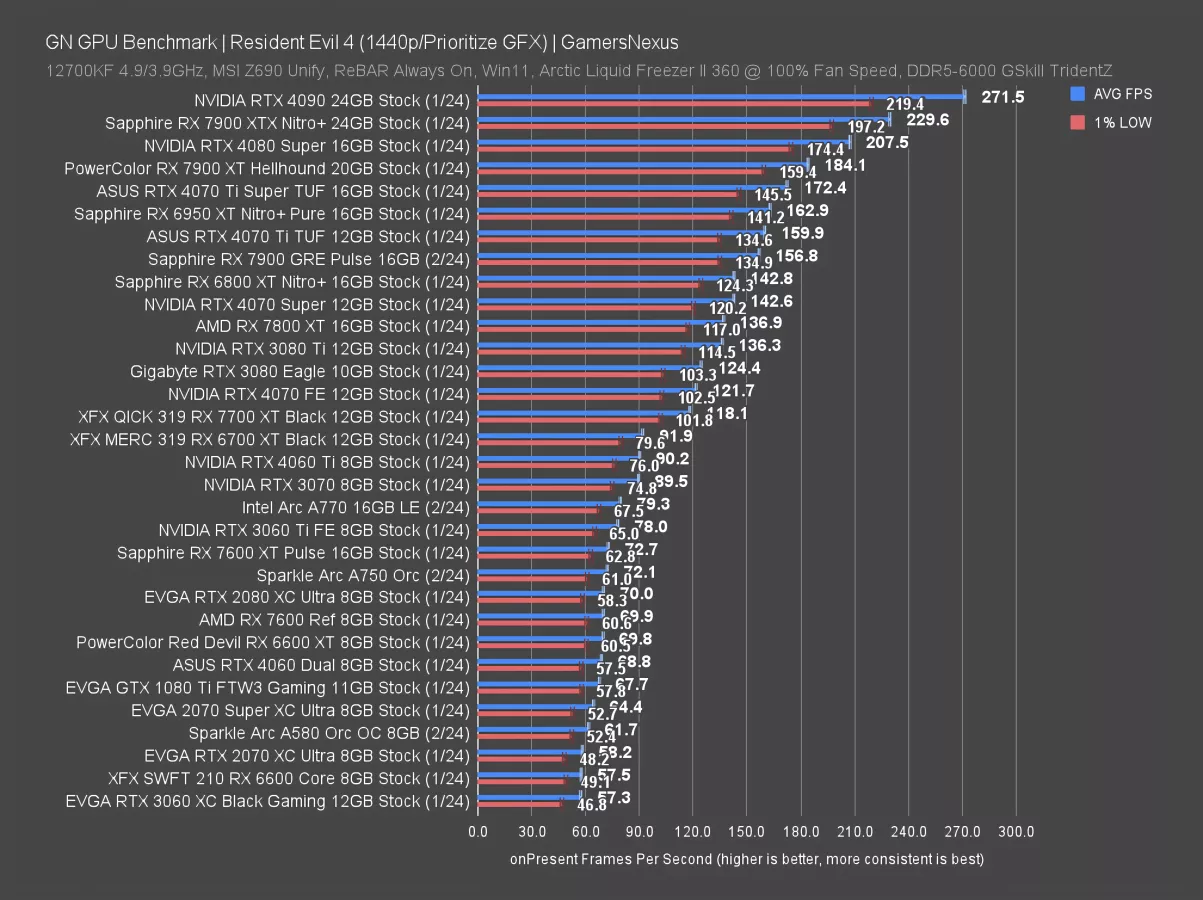
At 1440p, the 7900 GRE’s 157 FPS AVG has it 10% ahead of the 4070 Super, a significant boost from its 1080p lead of 3.1%. Going up to the RX 7900 XT would get you about 17% more performance for the price hike. Dropping down to the 7800 XT, we see an advantage form for the 7900 GRE of 15%.
Other notables include the RX 6950 XT, which is about equal to the 7900 GRE, and the original RTX 4070 Ti, also about equal. Uplift over something older, like the RTX 2070 (watch our review) at 58 FPS AVG, would yield a 170% improvement to the GRE.
4K Benchmarks
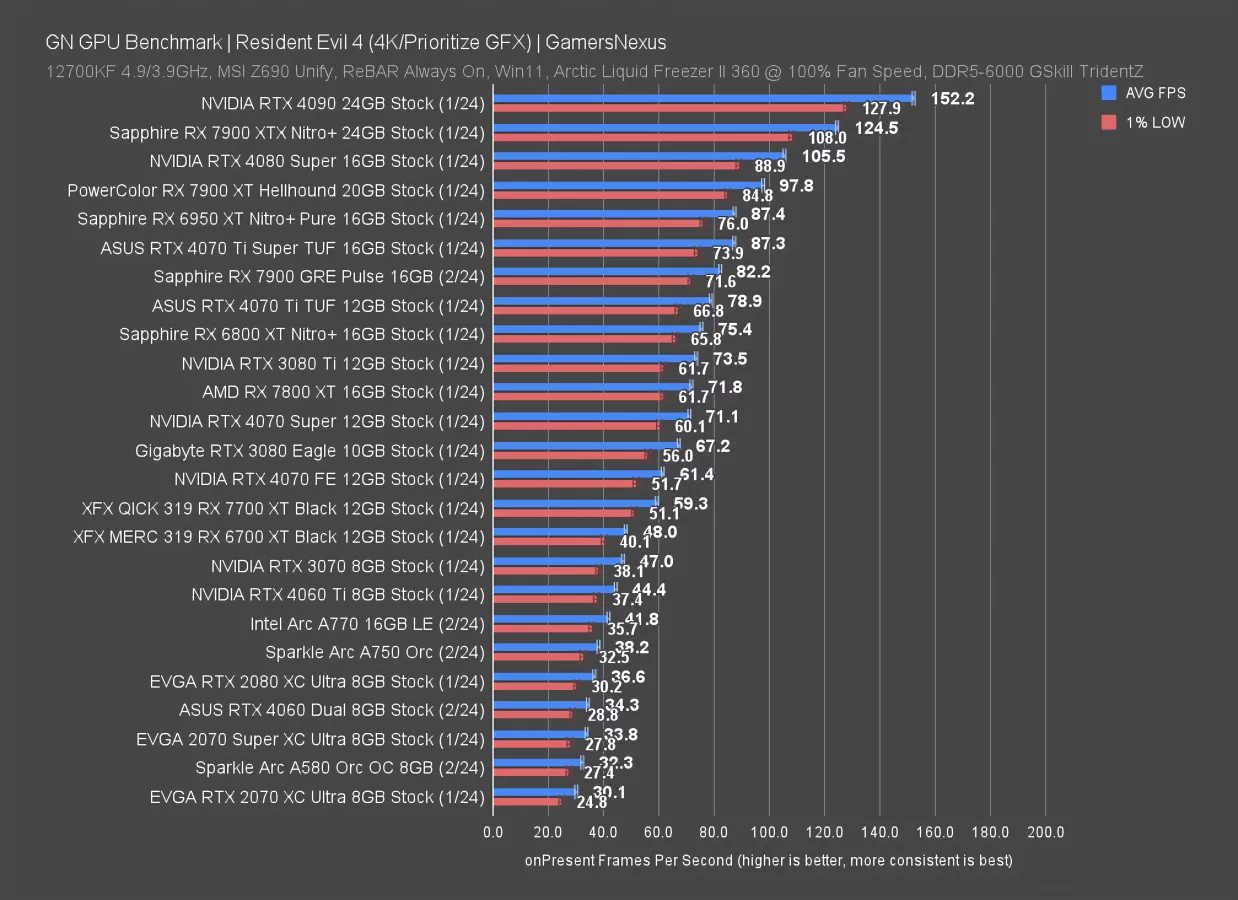
At 4K, the RX 7900 GRE ran at 82 FPS AVG and landed between the 4070 Ti and 4070 Ti “Meh edition,” the latter of which was about tied with the 6950 XT as well. The 7900 GRE now leads the 4070 Super by an impressive 15.6%. That’s why we test at all three of these resolutions: As we’ve seen in the past, NVIDIA’s new non-flagship 40-series cards struggle to keep scaling as the resolution increases. AMD has a disproportionate advantage against the 4070 Super here.
Buying up to the 7900 XT would give a boost of 19% with these settings. This is worth considering but the price hike is definitely noticeable.
Rainbow Six Siege
4K Benchmarks
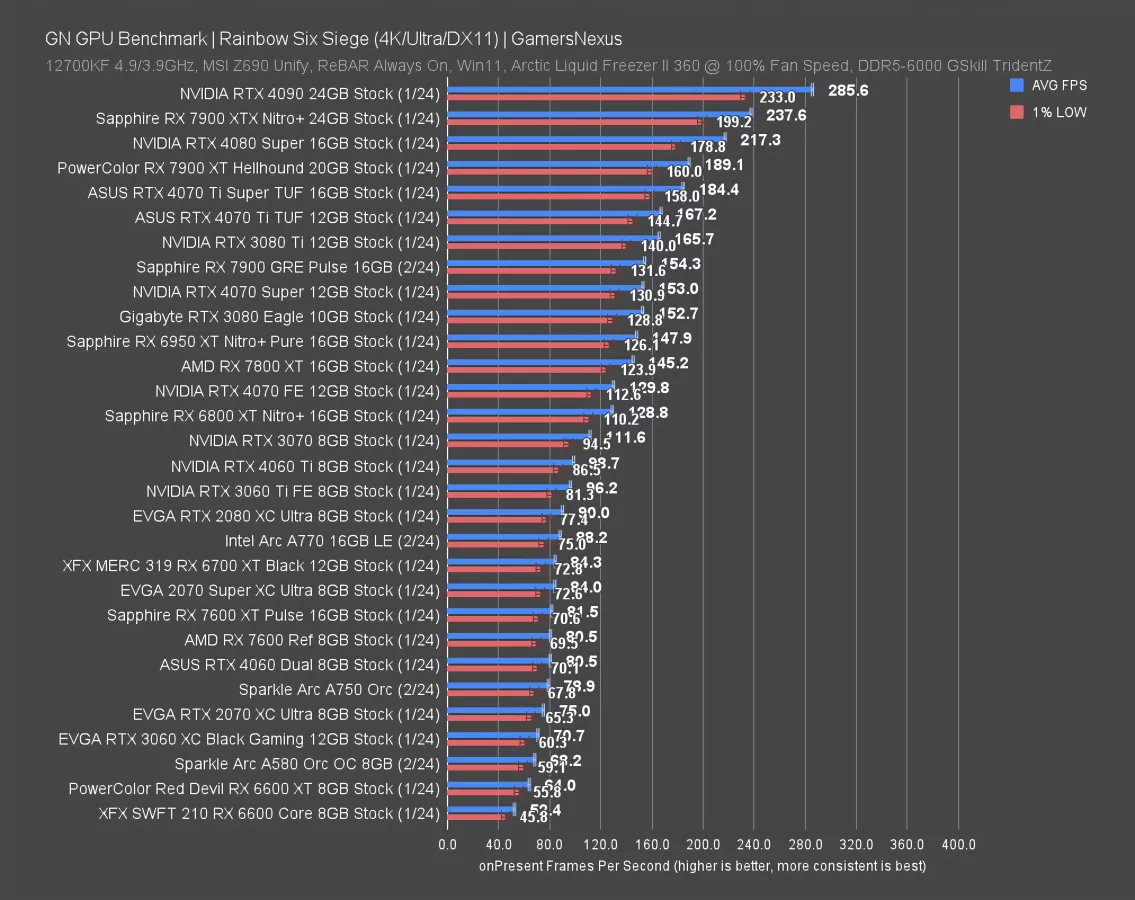
Rainbow Six Siege is up now. First at 4K, the RX 7900 GRE ran at about 154 FPS AVG. That’s the same as the 4070 Super and behind the 3080 Ti (watch our review). The 7900 XT leads the 7900 GRE by about 23% here, a noteworthy advantage attached to a noteworthy price increase of about 27-30%.
Against the 7800 XT, the 7900 GRE leads by 6.3%, or in terms of the absolute, 9 FPS average. The 7900 GRE falls exactly where you’d expect -- between the 7900 XT and 7800 XT -- but in this case, it’s more similar to the 7800 XT than the 7900 XT.
1440p Benchmarks
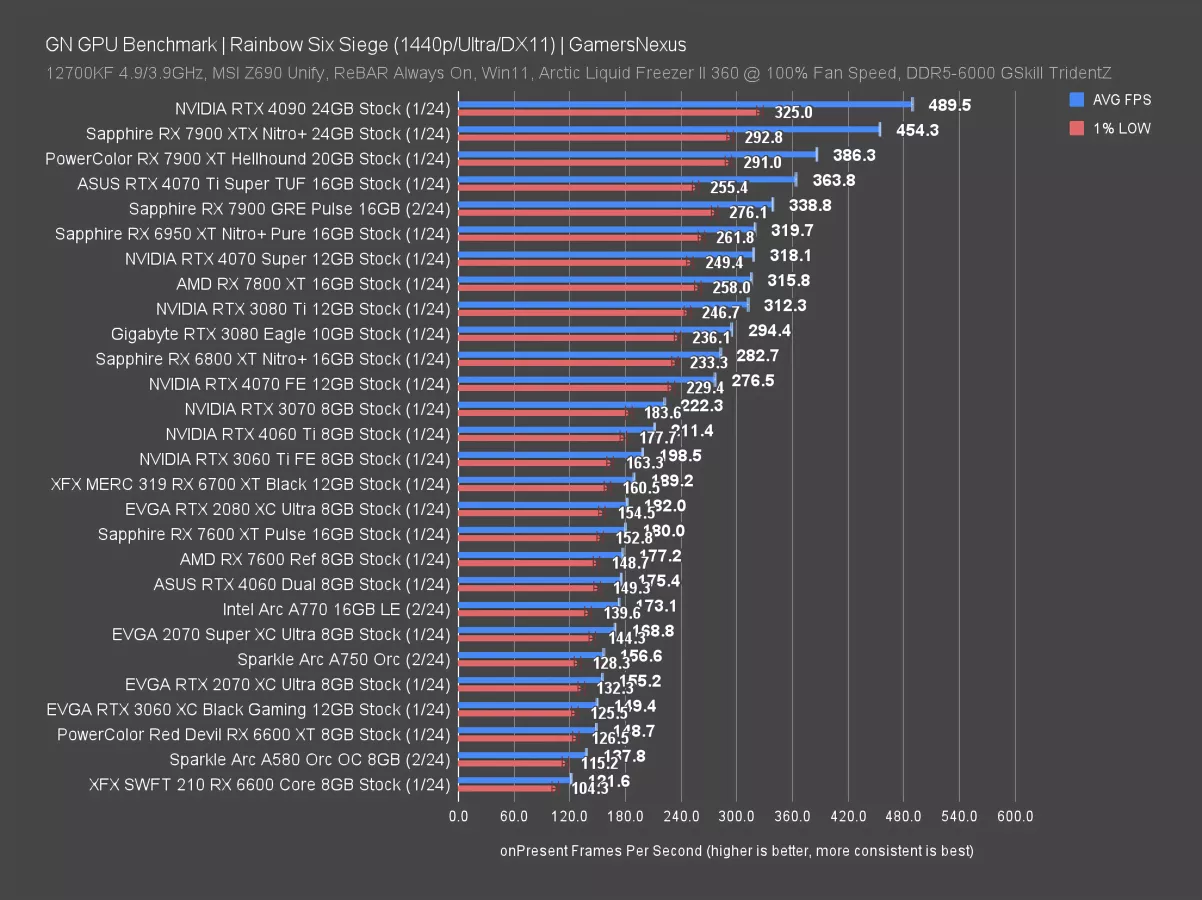
Moving on to 1440p, the 7900 GRE runs about 7% ahead of the 4070 Super. The 7900 XT’s lead over the 7900 GRE this time is about 14%.
Generally speaking, the 7900 XT starts to produce a meaningful uplift here, with the 4070 Ti Super not particularly meaningfully different in this title; however, that changes in ray tracing later.
As an upgrade, the 7900 GRE produces an appreciable improvement over the last-gen 3070 (although the 3070 is still perfectly fine – watch our review) and over AMD’s RX 6700 XT.
1080p Benchmarks
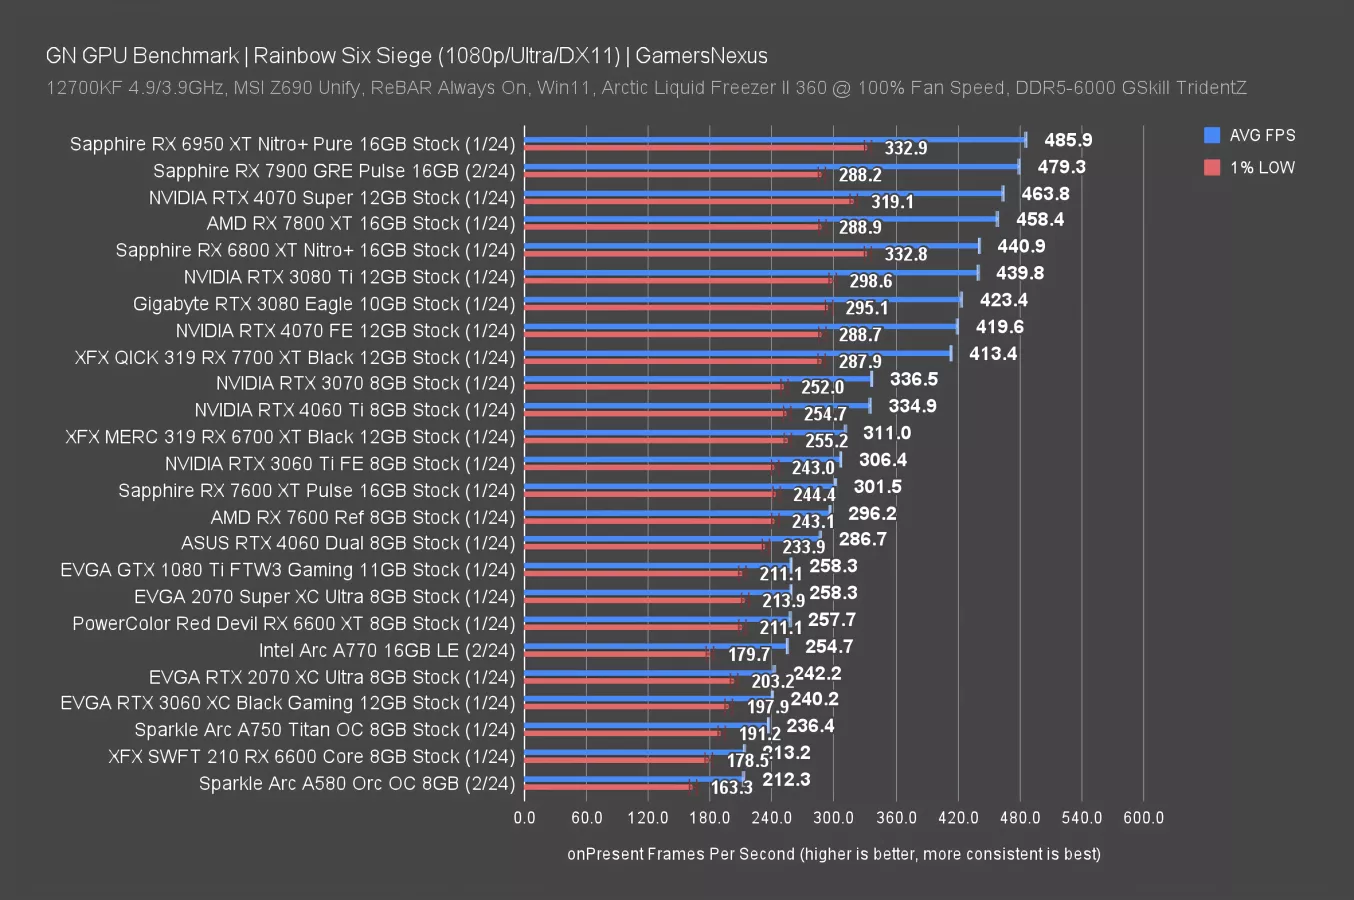
At 1080p, the 7900 GRE is about tied with the 6950 XT, leads the 4070 Super marginally, and leads the 7800 XT by 4.6%. Overall though, this plays pretty well at 1080p on just about anything within the last few generations.
Dying Light 2
4K Benchmarks
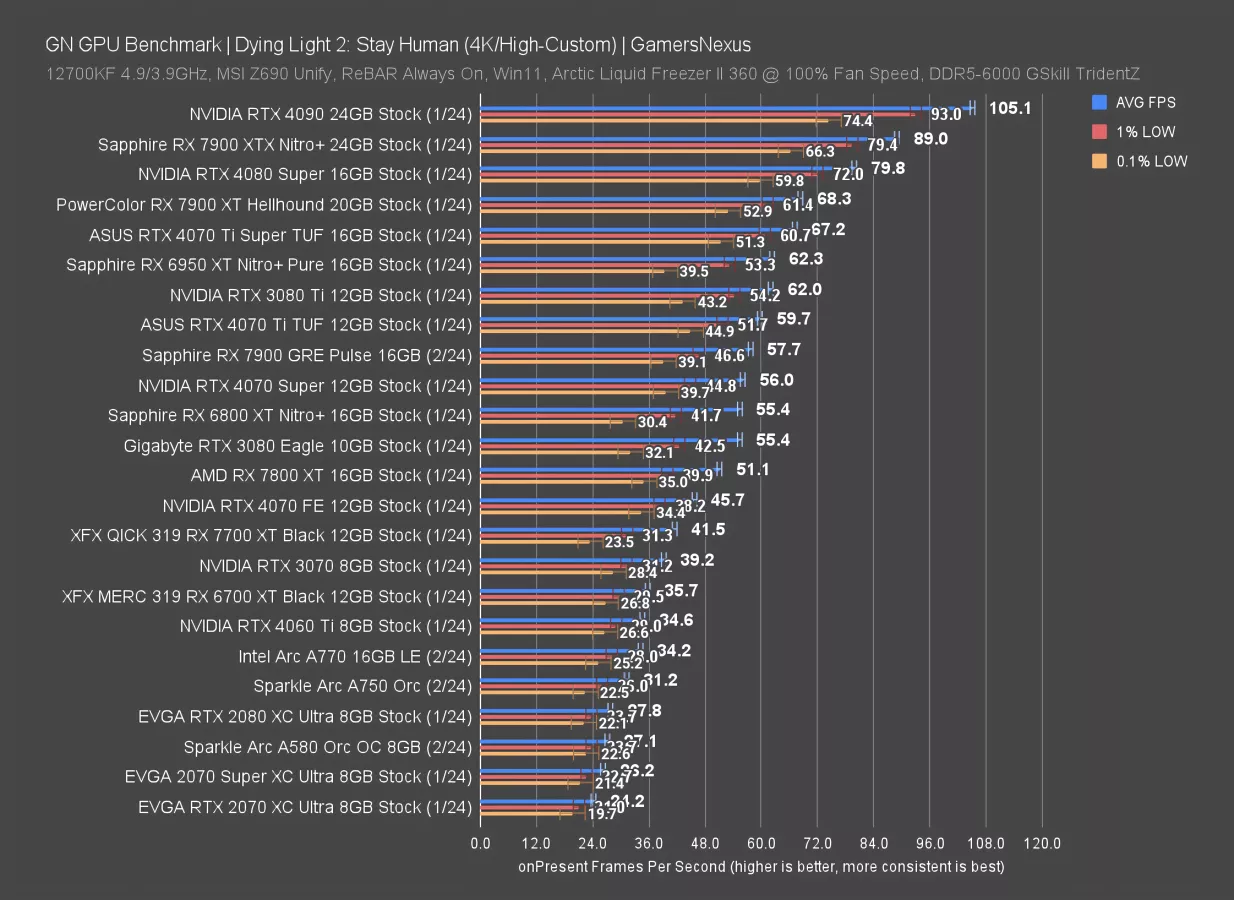
Dying Light 2 is up now. At 4K, the RX 7900 GRE ran at 58 FPS AVG, which has it just barely hitting the minimum that most people target for framerate. Settings adjustments would fully accommodate 60 FPS. That has it about equal to the 4070 Ti and just ahead of the 4070 Super; however, realistically, all 3 of these devices produce about the same experience.
Increasing budget to the 7900 XT would improve framerate by 18%. The 4070 Ti Super would yield a similar uplift. Against the RX 7800 XT, the 7900 GRE yields a 13% uplift. It’s almost perfectly in between the 7900 XT and 7800 XT.
1440p Benchmarks
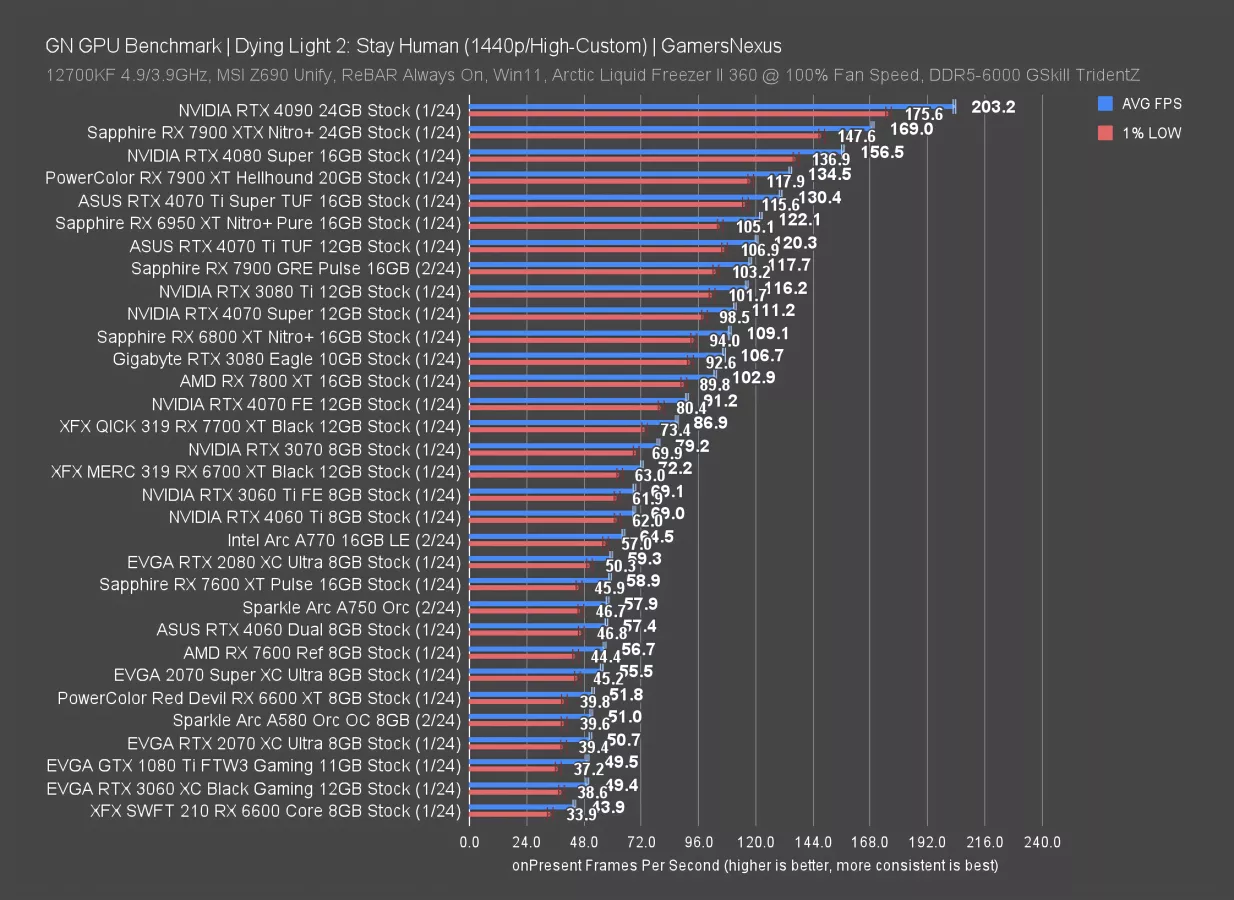
At 1440p, the RX 7900 GRE’s 118 FPS performance has it about equal to a 3080 Ti or 4070 Ti, with the 6950 XT slightly leading. The 7900 XT’s lead is only 14% here. The 7800 XT also happens to allow the 7900 GRE a 14% lead, planting it perfectly in between. As for the 4070 Super, the lead is about 6% while the price is lower for the GRE.
1080p Benchmarks
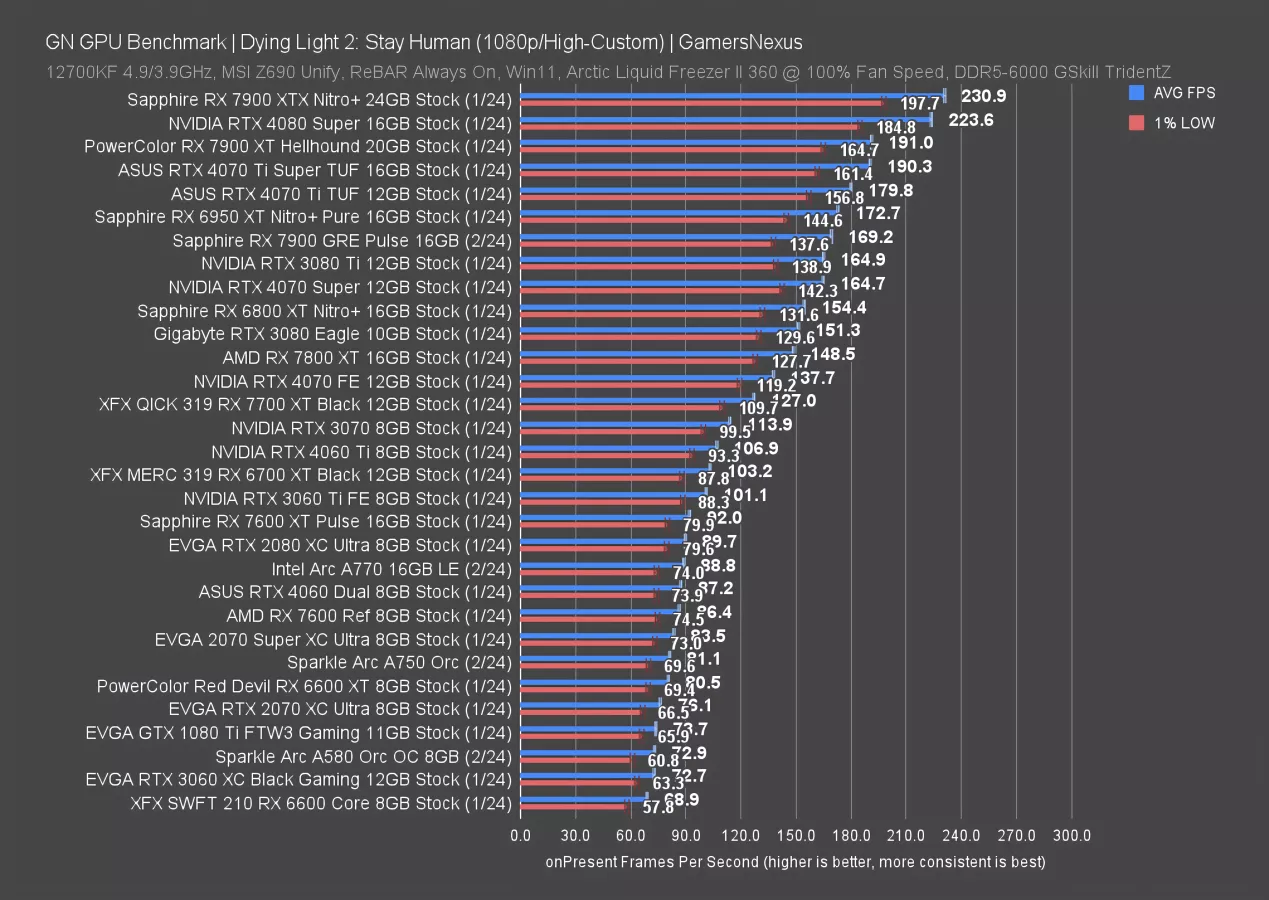
At 1080p, the 7900 GRE’s lead over the 4070 Super evaporates as the two cards converge to functional equivalence. The 7900 XT and the 7800 XT position themselves equidistant from the 7900 GRE, with the superior card in each scenario leading by about 12-14%.
FFXIV
4K Benchmarks
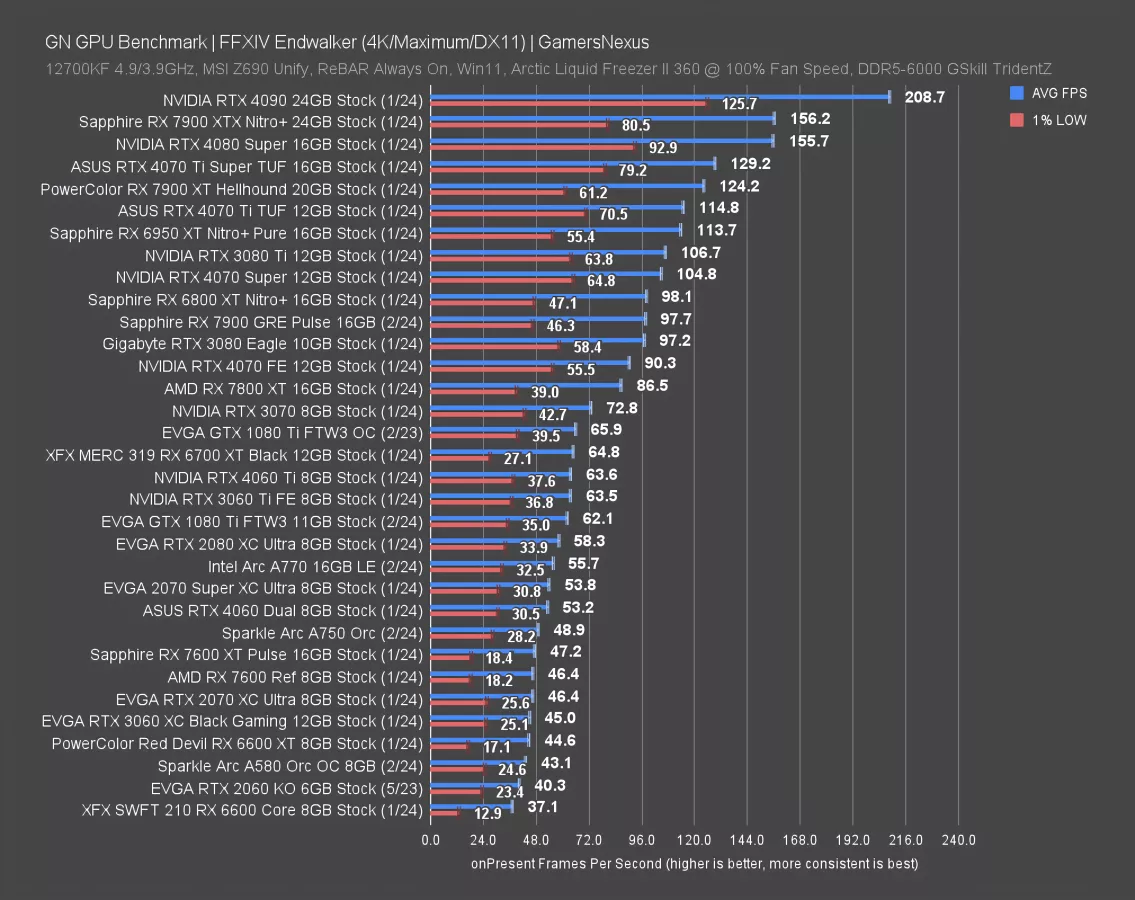
We’re moving on to Final Fantasy 14 now. At 4K, the 7900 GRE runs at 98 FPS AVG and produces the same overall experience as the RX 6800 XT and RTX 3080 (watch our review). The 4070 Super leads this time, now by 7%.
The GRE is less centered between its AMD peers this time: The 7900 XT leads by a noteworthy 27%, with the 7800 XT getting led by about 13%.
NVIDIA’s alternatives include, again, the 4070 Super, with the 4070 Ti Super ranking a little ahead of the 7900 XT. Upgrades from RTX 2060 (watch our review) or RTX 2070 (watch our review) class cards would be meaningful, but anything more modern can wait another generation or two.
1440p Benchmarks
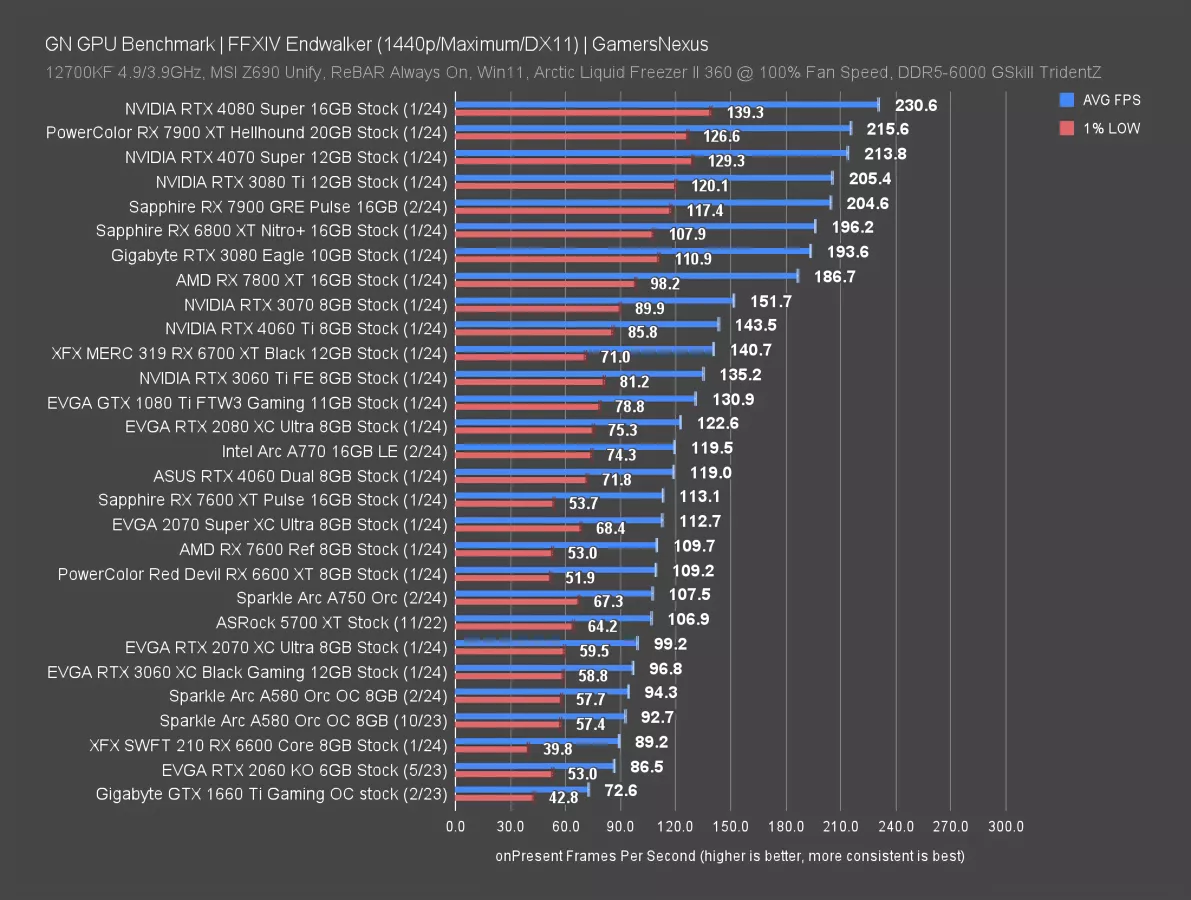
At 1440p, the 7900 XT begins running into overhead in this particular game, as we’ve talked about before. That extends to 1080p. The 7900 GRE therefore lands closer to it than when outside of these conditions, although the GRE still fully scales -- so its lead over the 7800 XT remains about 10%. The 4070 Super outperforms the GRE here. They swap positions depending on the game.
GTA V
4K Benchmarks
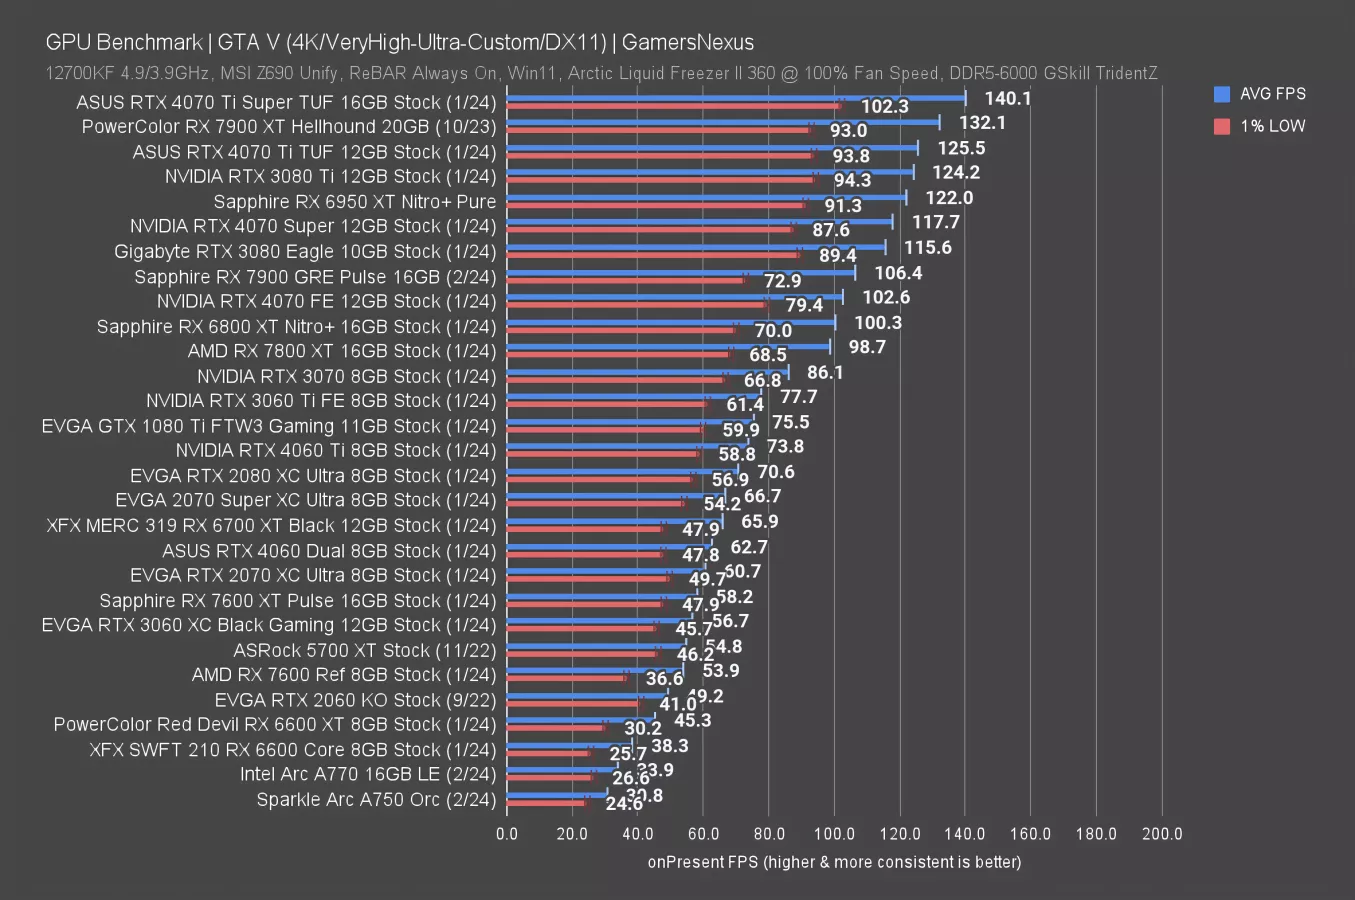
GTA V at 4K is one of the charts we keep around for generational comparison data because our results don’t ever change -- you can see the 5700 XT here as an example of that.
The 7900 GRE runs at about 106 FPS AVG, which has it leading the 4070 by a slight 3.7%. The 4070 Super leads again in this one, at 118 FPS AVG and establishing an 11% uplift. The 7900 XT has another one of its stronger leads in this test, with the 4K resolution contributing, up at 24% advantage over the GRE, closer to parity with the price increase. Against the 7800 XT, the 7900 GRE is relatively close this time: It’s an 8% lead.
As for the 5700 XT (watch our review), the 7900 GRE improves over the former flagship by 94%. It’s about 2x the framerate. For a reminder, Intel Arc struggles with our test settings in this game. Disabling MSAA for Intel Arc improves its performance disproportionately from the impact to AMD and NVIDIA.
Starfield
4K Benchmarks
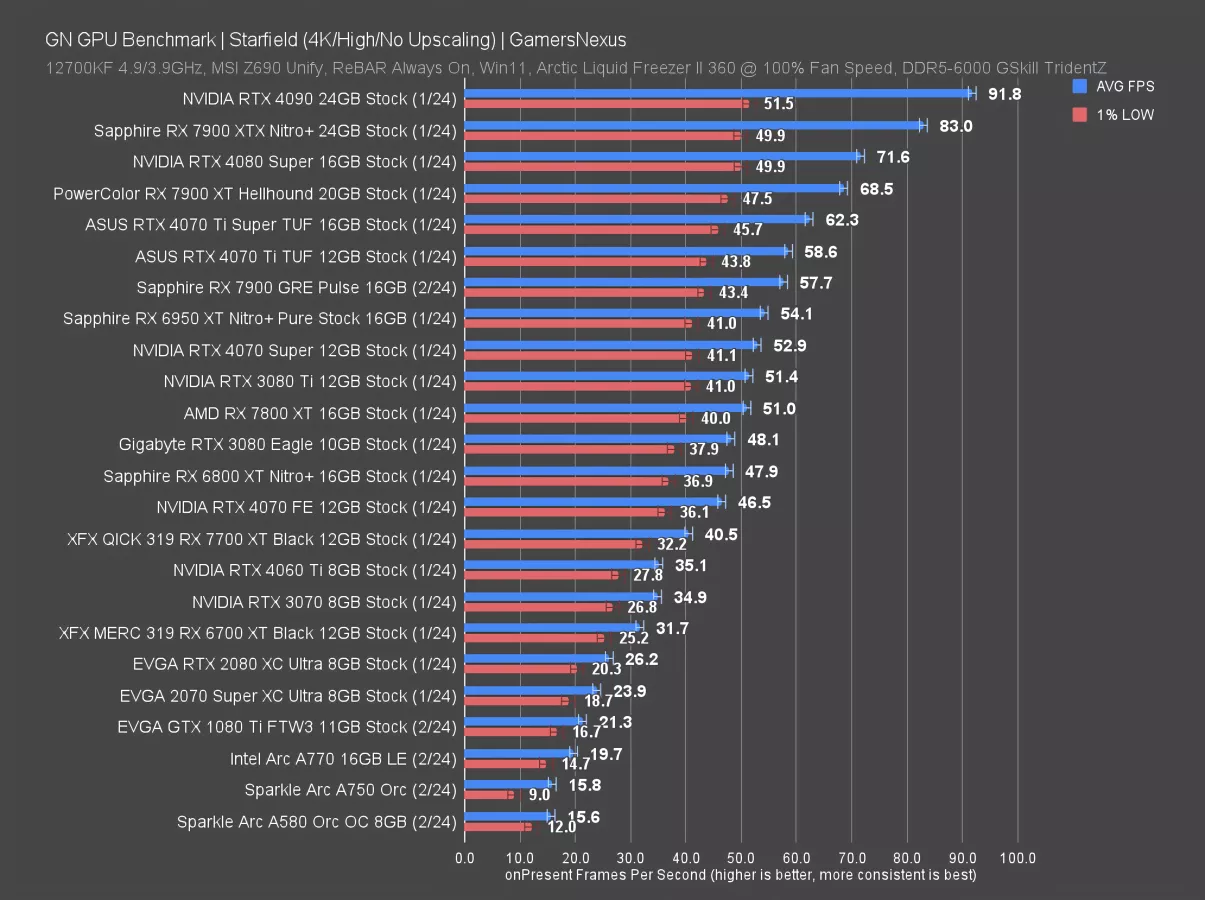
Starfield is up now. This is a title that AMD tends to do well with.
At 4K, the 7900 GRE runs at about 60 FPS average. Lows are expected and consistent. The 4070 Super produced a 53 FPS result, giving the 7900 GRE a 9% lead this time. The 7800 XT is closer to the 4070 Super than the GRE, with the GRE holding a 13% lead. That’s similar to what we’ve seen elsewhere. The same is true for the 7900 XT, which keeps its 19% lead over the GRE.
1440p Benchmarks
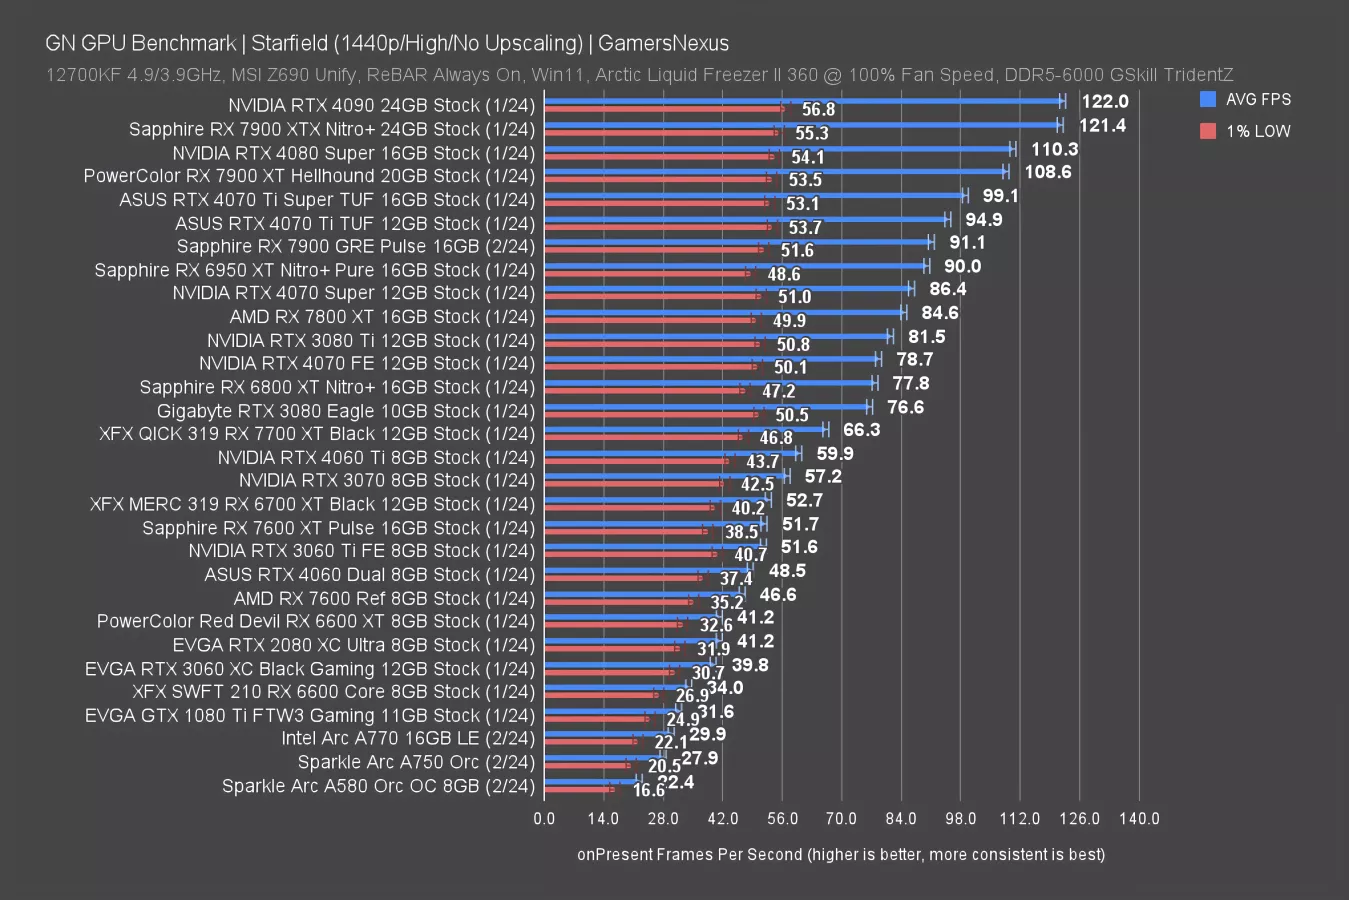
At 1440p, the 7900 GRE’s 91 FPS AVG has it just behind the 4070 Ti and Ti Super and leading the 4070 Super by 5%, reduced from 9% at 4K. This continues NVIDIA’s trend of sometimes suffering disproportionately at higher resolutions.
Otherwise, the lineup remains comparable to before. We added the RTX 2080 to this chart, so you’ve got an extra data point you can use for this one.
AMD RX 7900 GRE Ray Tracing Benchmarks
Now we're moving on to ray tracing benchmarks. Some of these games are the same games but with RT and settings changed, so the numbers can't be transplanted between the charts.
(RT) Cyberpunk
1080p/Medium
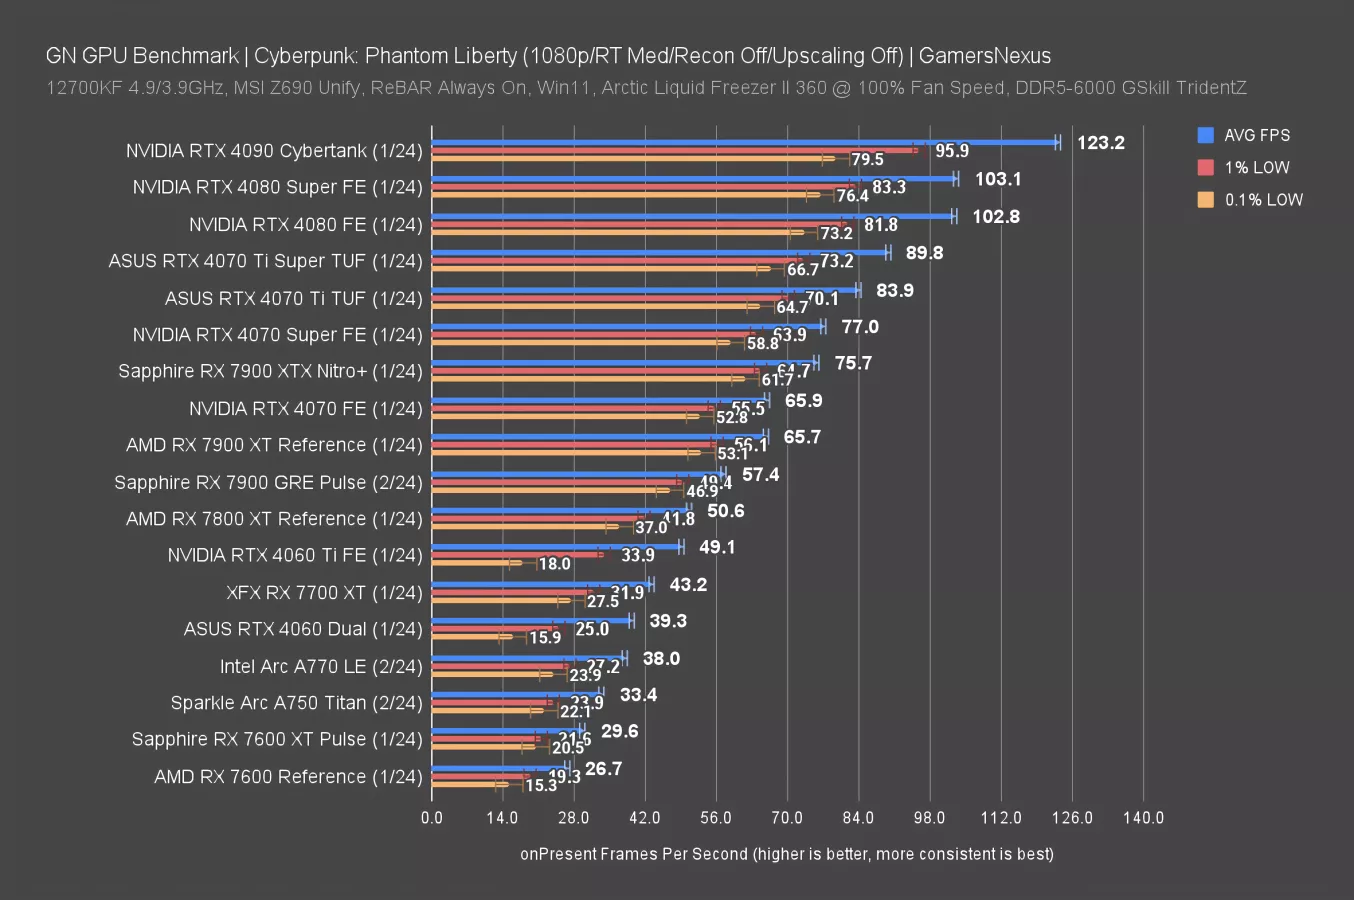
Cyberpunk is our heaviest RT workload, so we’ll start there. We’ve also shown that AMD falls increasingly behind as the RT workload in this game increases. This is the lightest of the two settings we test, meant to represent a balanced option between the vendors. Ultra is next and is what allows NVIDIA to pull wildly ahead.
At 1080p/Medium RT, the 7900 GRE runs at about 57 FPS AVG, giving the 7900 XT a 14% lead and leading the 7800 XT 13%. NVIDIA is where it gets interesting: The 4070 Super now leads the 7900 GRE by a more remarkable 34%. If you really care about super heavy ray tracing, especially in Cyberpunk or games like Dying Light, then NVIDIA still maintains the advantage. But in lighter RT games coming up, it evens out. Just depends on the load.
Arc actually does extremely well in Cyberpunk with RT, roughly equating the 4060 with the much cheaper A770 GPU. This is due to architectural choices the Intel team made. Unfortunately, since the stack stops at the A770, they don’t have anything up at the 7900 GRE levels of competition.
1080p/Ultra
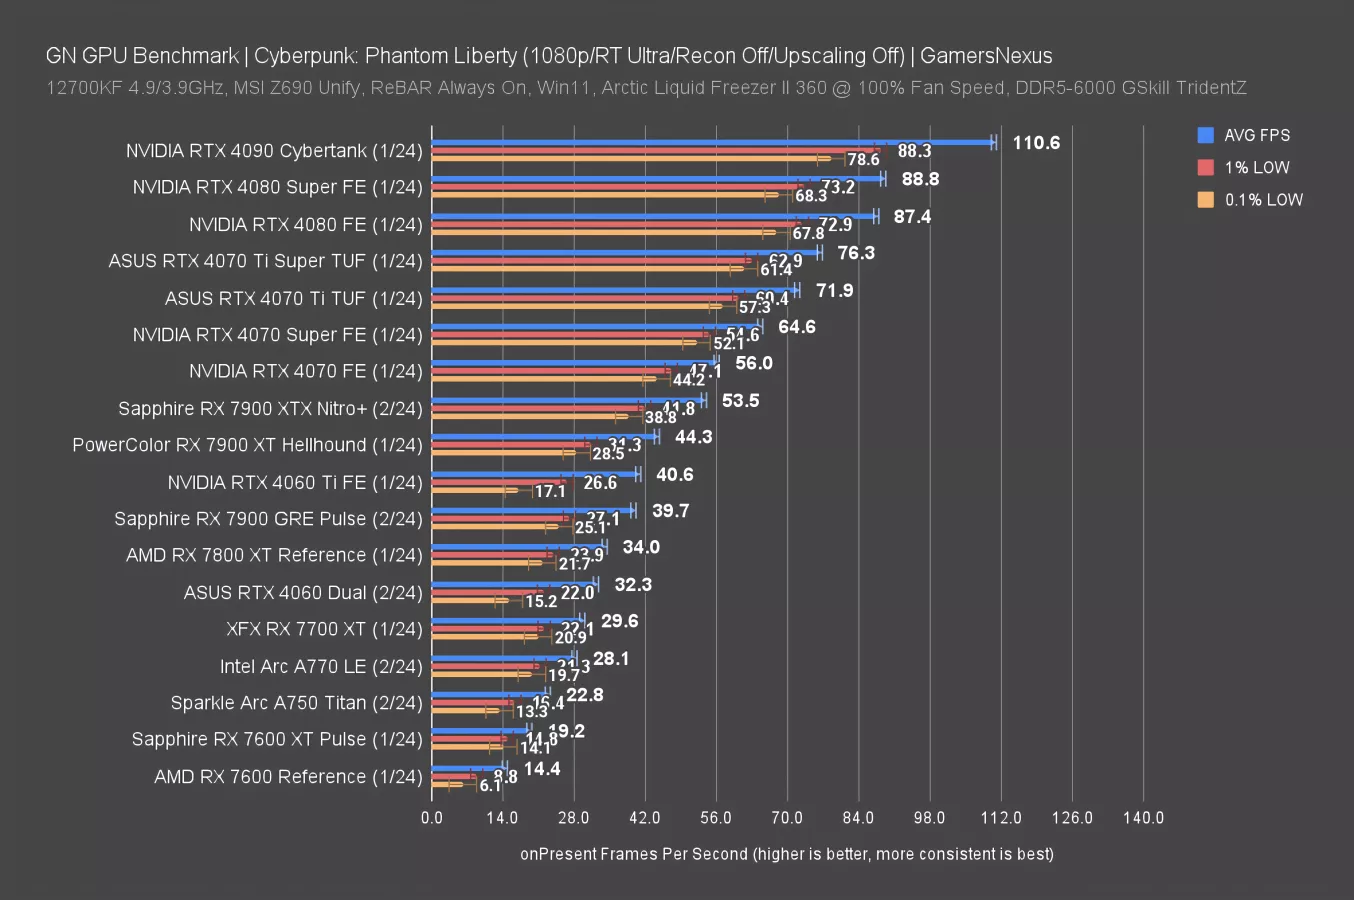
At 1080p and with Ultra RT settings, the 7900 GRE falls to 40 FPS AVG, this time leading the 7800 XT by 17% and with the 7900 XT about 12% ahead of the GRE. But this is what we were talking about: Even the RTX 4070 non-Super is outperforming the 7900 XTX here, with the 4070 Super now benefiting from an overwhelming advantage of 63% over the 7900 GRE. It’s not even close anymore.
(RT) Resident Evil 4
4K Benchmarks
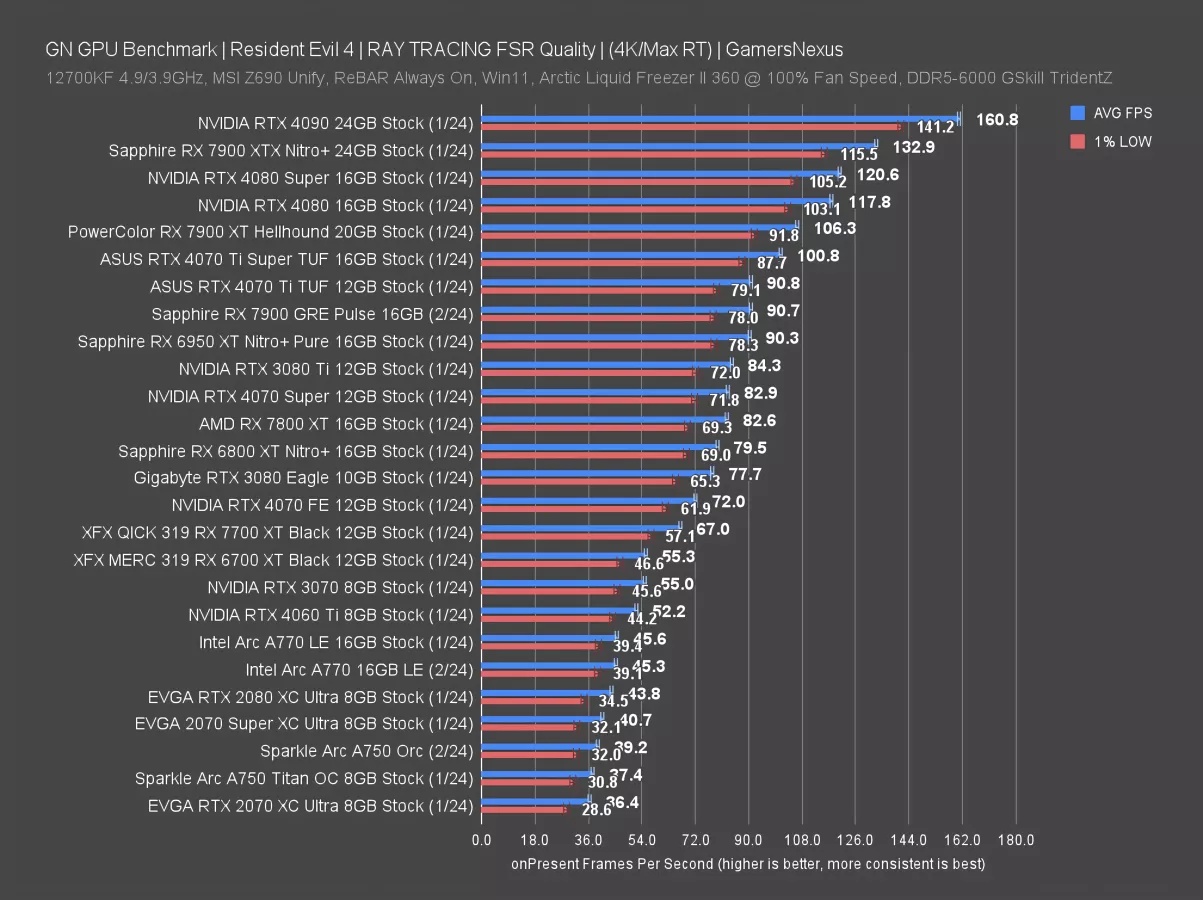
Resident Evil 4 is way, way kinder to the AMD stack. This is more representative of lighter-weight RT workloads and we’re using FSR Quality on all devices here.
The RX 7900 GRE’s 91 FPS AVG result has it about equal with the 4070 Ti (watch our review) and 6950 XT, producing the same experience. The 7900 XT leads the 7900 GRE by 17% in this one, with the 7800 XT’s 83 FPS AVG giving a 10% lead to the GRE.
Notably, the GRE leads the 4070 Super this time around, which itself is about tied with the 7800 XT.
1440p Benchmarks
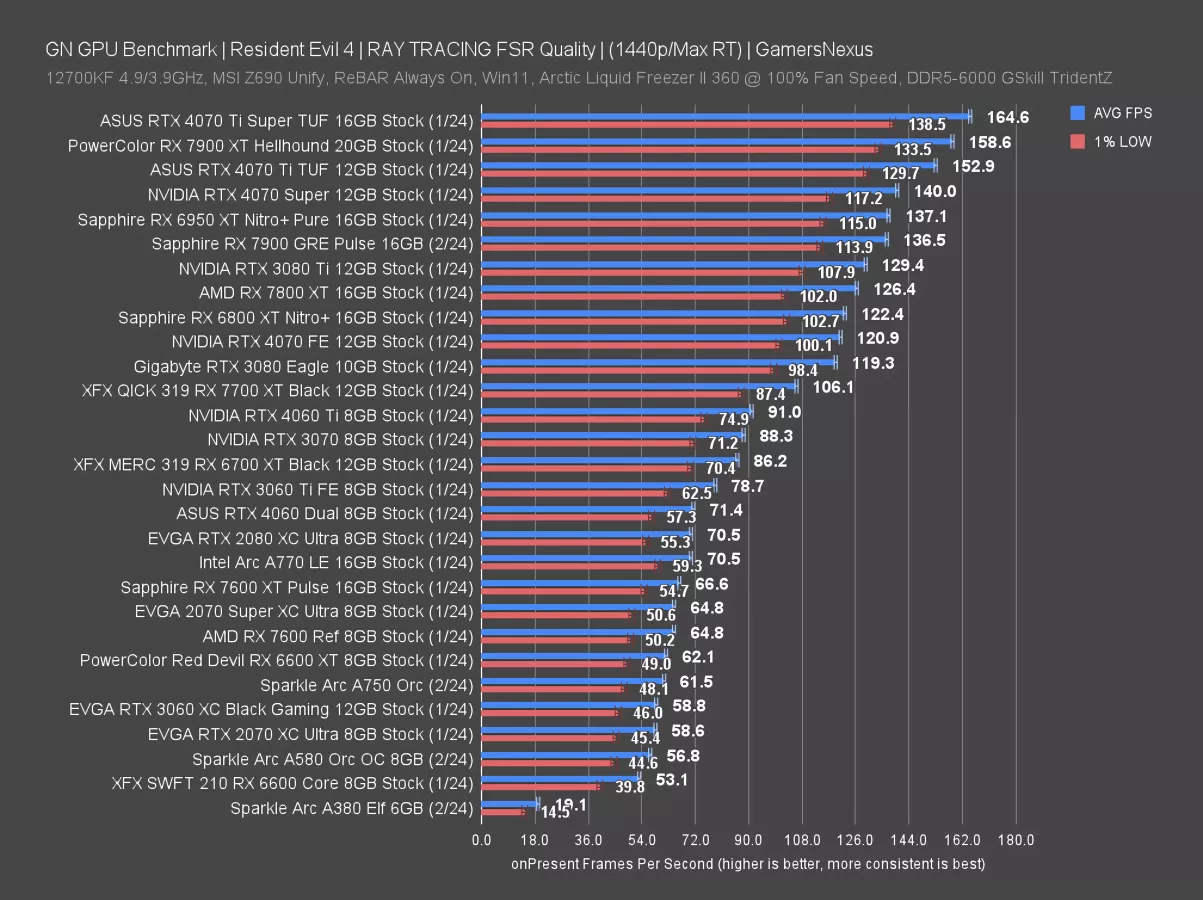
At 1440p, the GRE ran at 137 FPS AVG and fell behind the 4070 Super, although they’re less than 3% apart. Otherwise, everything else is predictable on the AMD side -- the 7900 XT and 7800 XT remain the flanks, and on the NVIDIA side, AMD is more competitive here than previously. That’s especially true now that the 7900 XT has dropped and held its cheaper price.
1080p Benchmarks
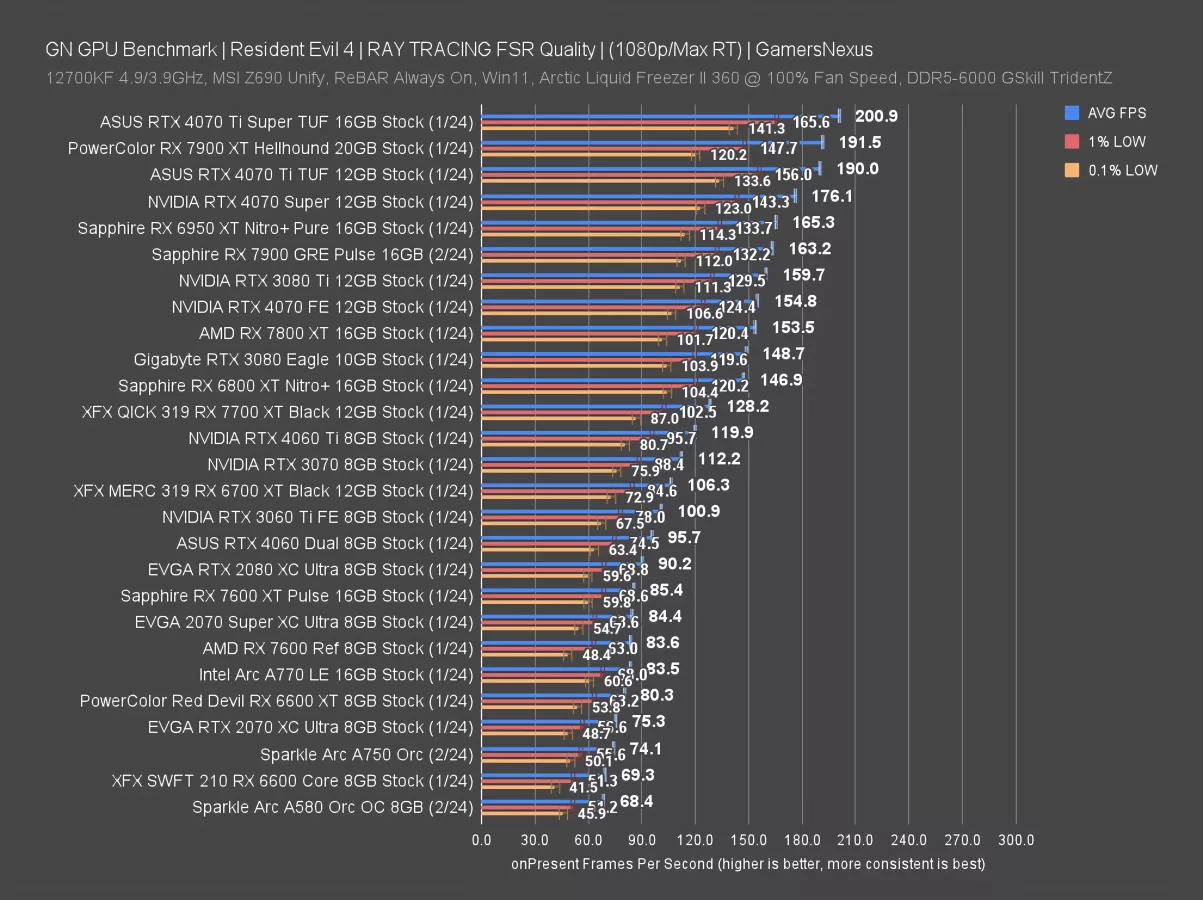
At 1080p, the 4070 Super continues its upward trajectory and gains an 8% advantage over the GRE. As we’ve seen elsewhere, the AMD part is benefited by the higher resolution here, while NVIDIA benefits from the lower resolution.
(RT) Dying Light 2
1080p Benchmarks
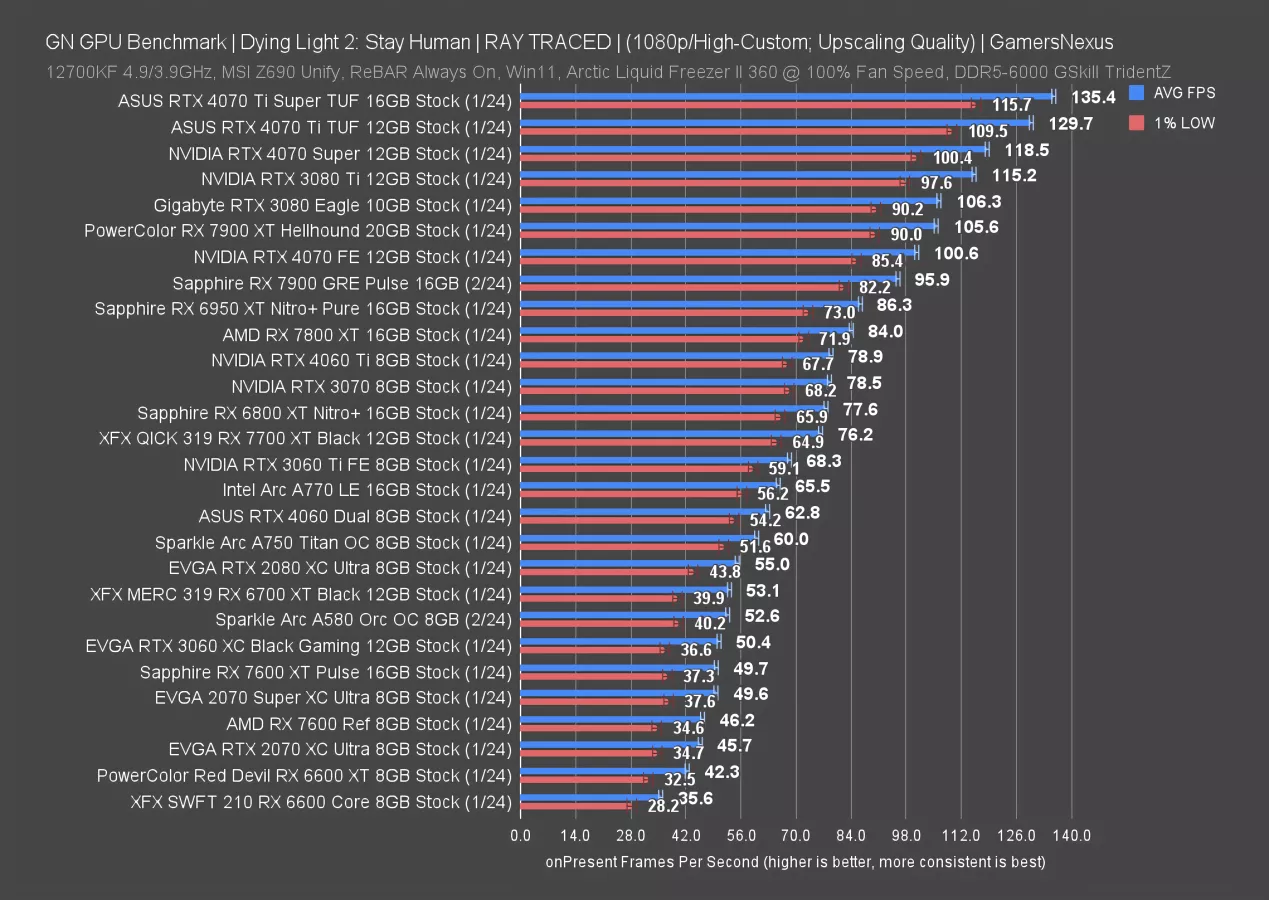
In Dying Light 2 with ray tracing, we’re back to a performance disparity closer to the Cyberpunk Medium results. Starting with 1080p, the RTX 4070 Super’s 119 FPS AVG leads the 7900 GRE by a comparatively staggering 24%. For the times AMD led this card in rasterization, NVIDIA is definitely trying to make it up in some of these RT loads. Positioning against the 7800 XT is the same as before: The GRE is about 14% better.
1440p Benchmarks
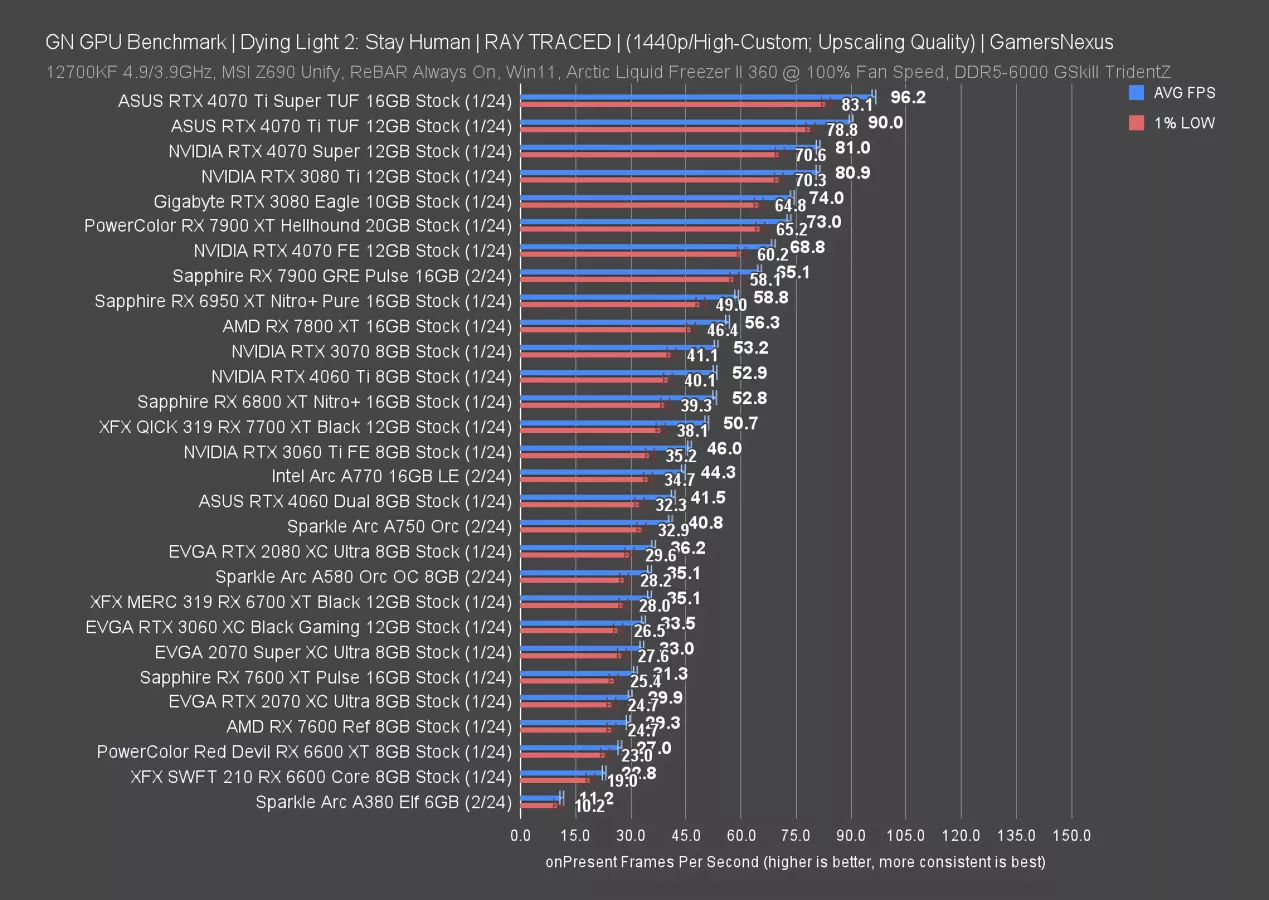
At 1440p, the 7900 GRE runs at about 65 FPS AVG. It’s still capable of this game with RT when using FSR quality like this. The 4070 Super keeps its 24% lead. The 7900 XT and 7800 XT remain positionally the same as before, with the 4070 non-Super ahead of the GRE now.
AMD RX 7900 GRE Power Consumption
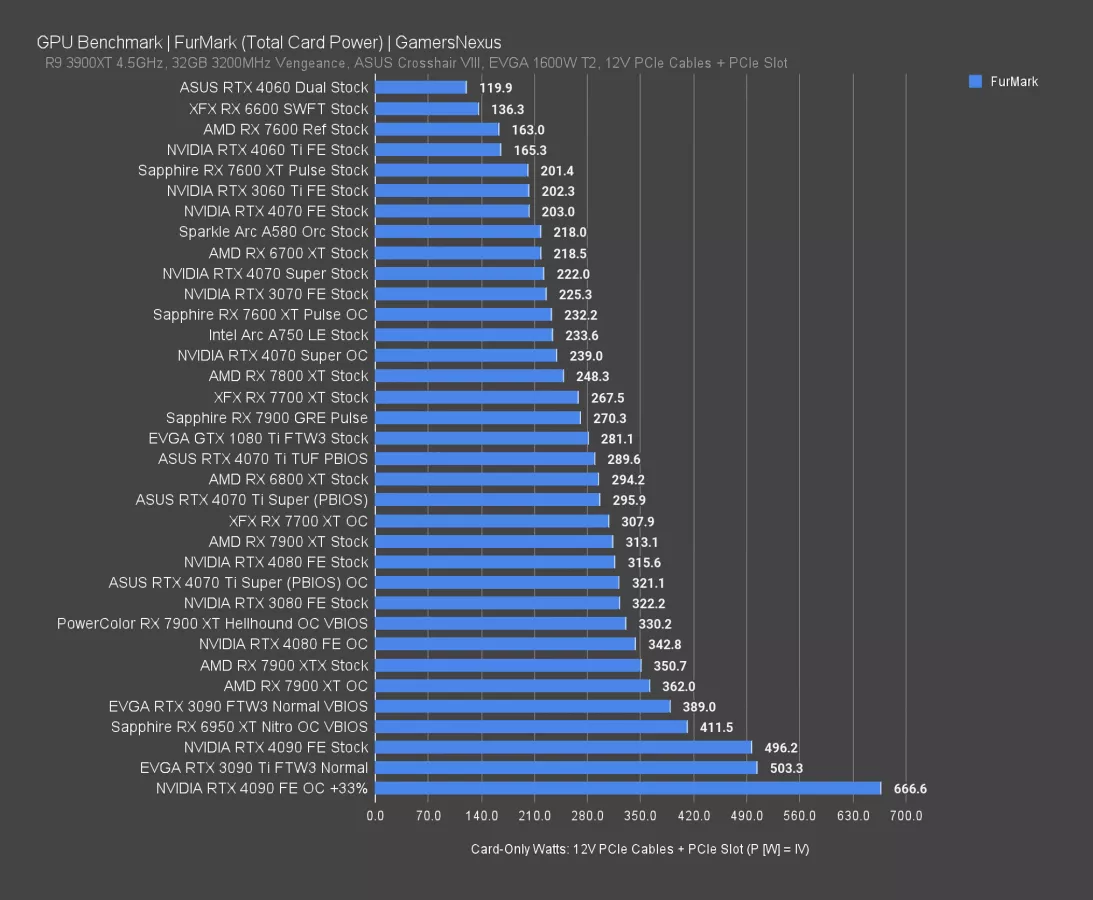
For power consumption, this is pretty quick. The 7900 GRE that we tested measured out about 270 watts when it was under a complete workload. The 7900 XT was around 313 just for reference. The 4070 Super, which was the closest competitor in the rasterized testing, was at 222 watts so NVIDIA definitely holds an efficiency advantage here. And then the 7900 XT with the Hellhound partner model card was at 330 watts.
AMD RX 7900 GRE Conclusion

The AMD RX 7900 GRE performs exactly as you’d expect: Generally speaking, it’s often equidistant from the RX 7900 XT and RX 7800 XT. Some scenarios that are more memory bandwidth-constrained or core clock sensitive allow the 7800 XT to get closer to the GRE and the 7900 XT to pull ahead more notably.
The 7900 GRE trades places with the 4070 Super in many of the rasterized tests we ran. It also is disproportionately favored at 4K in some of these tests, where NVIDIA’s bandwidth choices allow it to slip in the ranks and lose some of that proportional scaling it has at 1080p.
NVIDIA holds a significant advantage in some of the RT workloads, to the extent that you really should strongly consider going that route if heavy RT games -- like Cyberpunk -- are part of your play plans. If not, or if the RT games you’re interested in are more focused on singular features or reduced RT strain overall, then the relevance is reduced.
Again, this isn’t a new card, but we do think it’s relevant as a competitor to the NVIDIA 4070-class cards.
