We benchmarked the RTX PRO 6000 in gaming scenarios using an AMD Ryzen 9800X3D, experimented with LLM benchmarks, and ran thermal and acoustic tests
The Highlights
- The RTX 6000 features 24,064 CUDA cores, which is nearly an 11% increase over the RTX 5090
- Unlike the 5090, which uses liquid metal, the RTX Pro 6000 uses thermal paste
- On the gaming side, the RTX Pro 6000 outperformed the 5090 by roughly 5 to 14% in our tests, but that alone isn’t a good reason to buy the card
- Original MSRP: $8,000 - $11,000
- Release Date: March 18, 2025
Table of Contents
- AutoTOC

Intro
We paid $8,000 for an RTX PRO 6000 GPU with 96GB of VRAM when we bought it from Brent Rambo, the actual guy in this meme, who’s grown up now and had access to an RTX Pro 6000. These days, Rambo is busy with custom and bespoke PC builds these days on his own website, and that means he has access to interesting hardware.
It’s a shame that NVIDIA has left us feeling like it’s holding its engineers hostage for manipulating reviews, but it’s clear that we don’t mind buying our own hardware to review.
Editor's note: This was originally published on June 24, 2025 as a video. This content has been adapted to written format for this article and is unchanged from the original publication.
Credits
Test Lead, Host, Writing, Editing
Steve Burke
Testing
Patrick Lathan
Video Editing
Vitalii Makhnovets
Camera, Video Editing
Tim Phetdara
Testing, Writing, Camera
Tannen Williams
Writing, Web Editing
Jimmy Thang
The RTX PRO 6000 is the best marketing for AMD’s Ryzen 9800X3D (read our review) that we use in our GPU test benches, mostly because we’re seeing 5% to 14% scaling in gaming benchmarks versus the RTX 5090 (read our review). We also tore it down and found the most insanely dense PCB we’ve ever seen with a reversion away from liquid metal.
But this doesn’t have 96GB of VRAM just because that’s where it all went when they lost it on the RTX 5080 (read our review), 5070 Ti (read our review), 5070 (read our review), 5060 Ti 8GB (read our review), and 5060 (read our review)-- it’s also there because it’s better for... AI.
Today, we’re benchmarking some of those in a round of experimental benchmarks. We haven’t done machine learning and LLM tests before and we don’t have a full methodology defined yet, but we’ve begun experimenting.
NVIDIA RTX 6000 Overview
This card is not for gaming. That much is obvious. We’re still testing it in games, and that’s mostly for our own purposes: We want to know how much room the 9800X3D has in it to scale for GPUs, and fortunately, it looks like there’s still plenty for another generation of reviews. The 9800X3D keeps up with the RTX PRO 6000 even when at 1080p in some situations.
The biggest difference between the PRO 6000 and the 5090 after the 96GB vs. 32GB memory capacity is the GPU itself: The PRO 6000 has 24,064 CUDA cores to the 21,760 of the 5090, nearly an 11% increase. That’s a big difference.
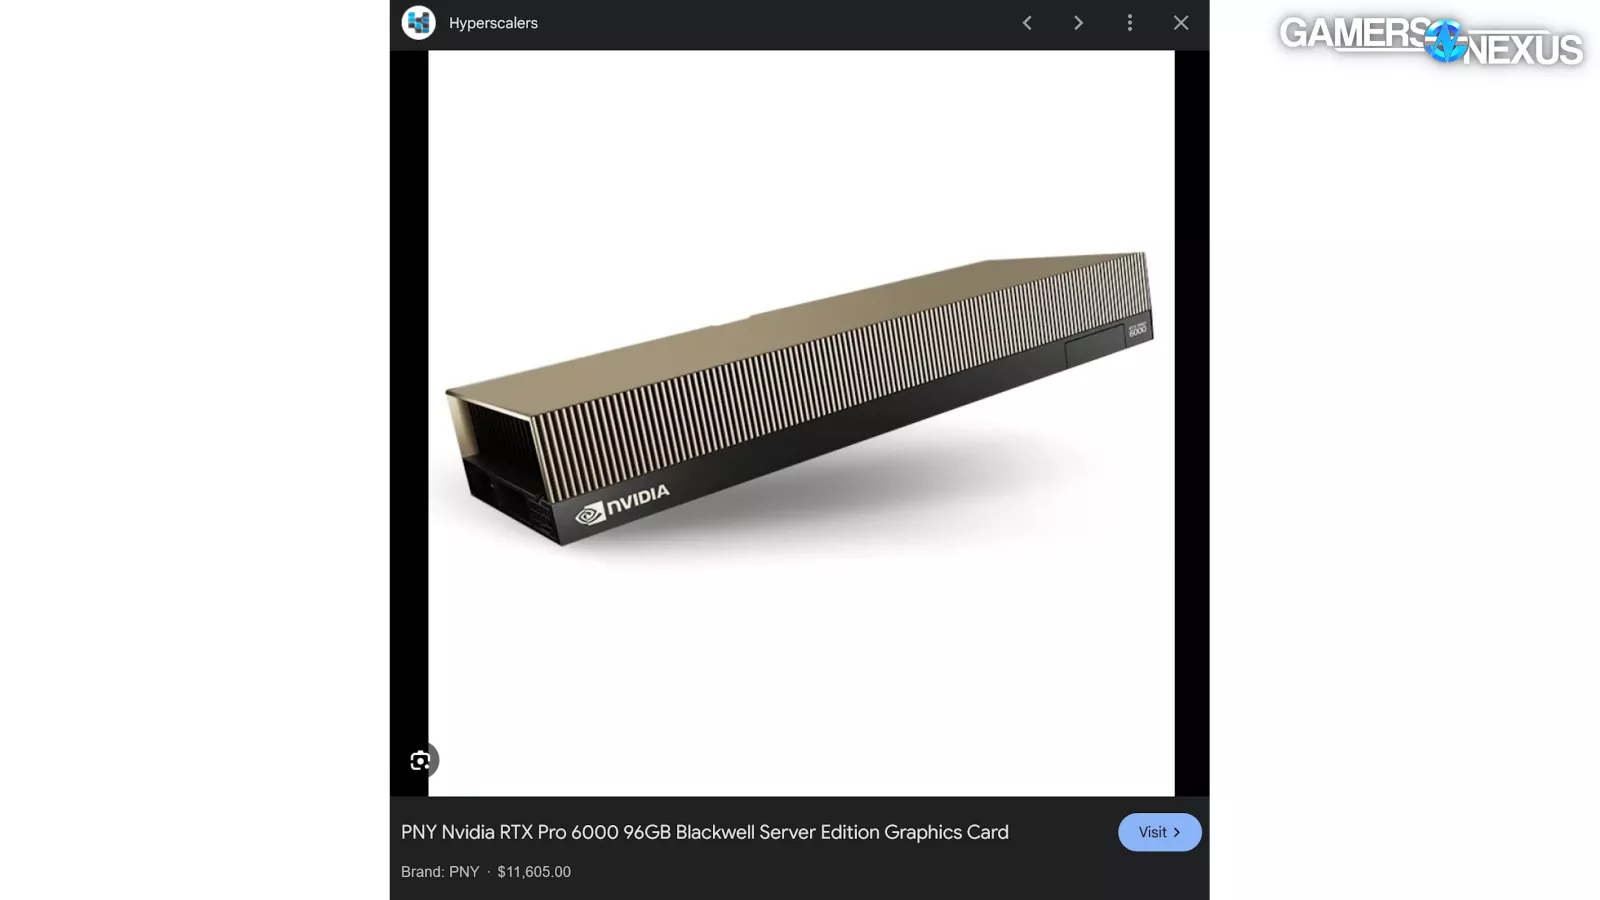
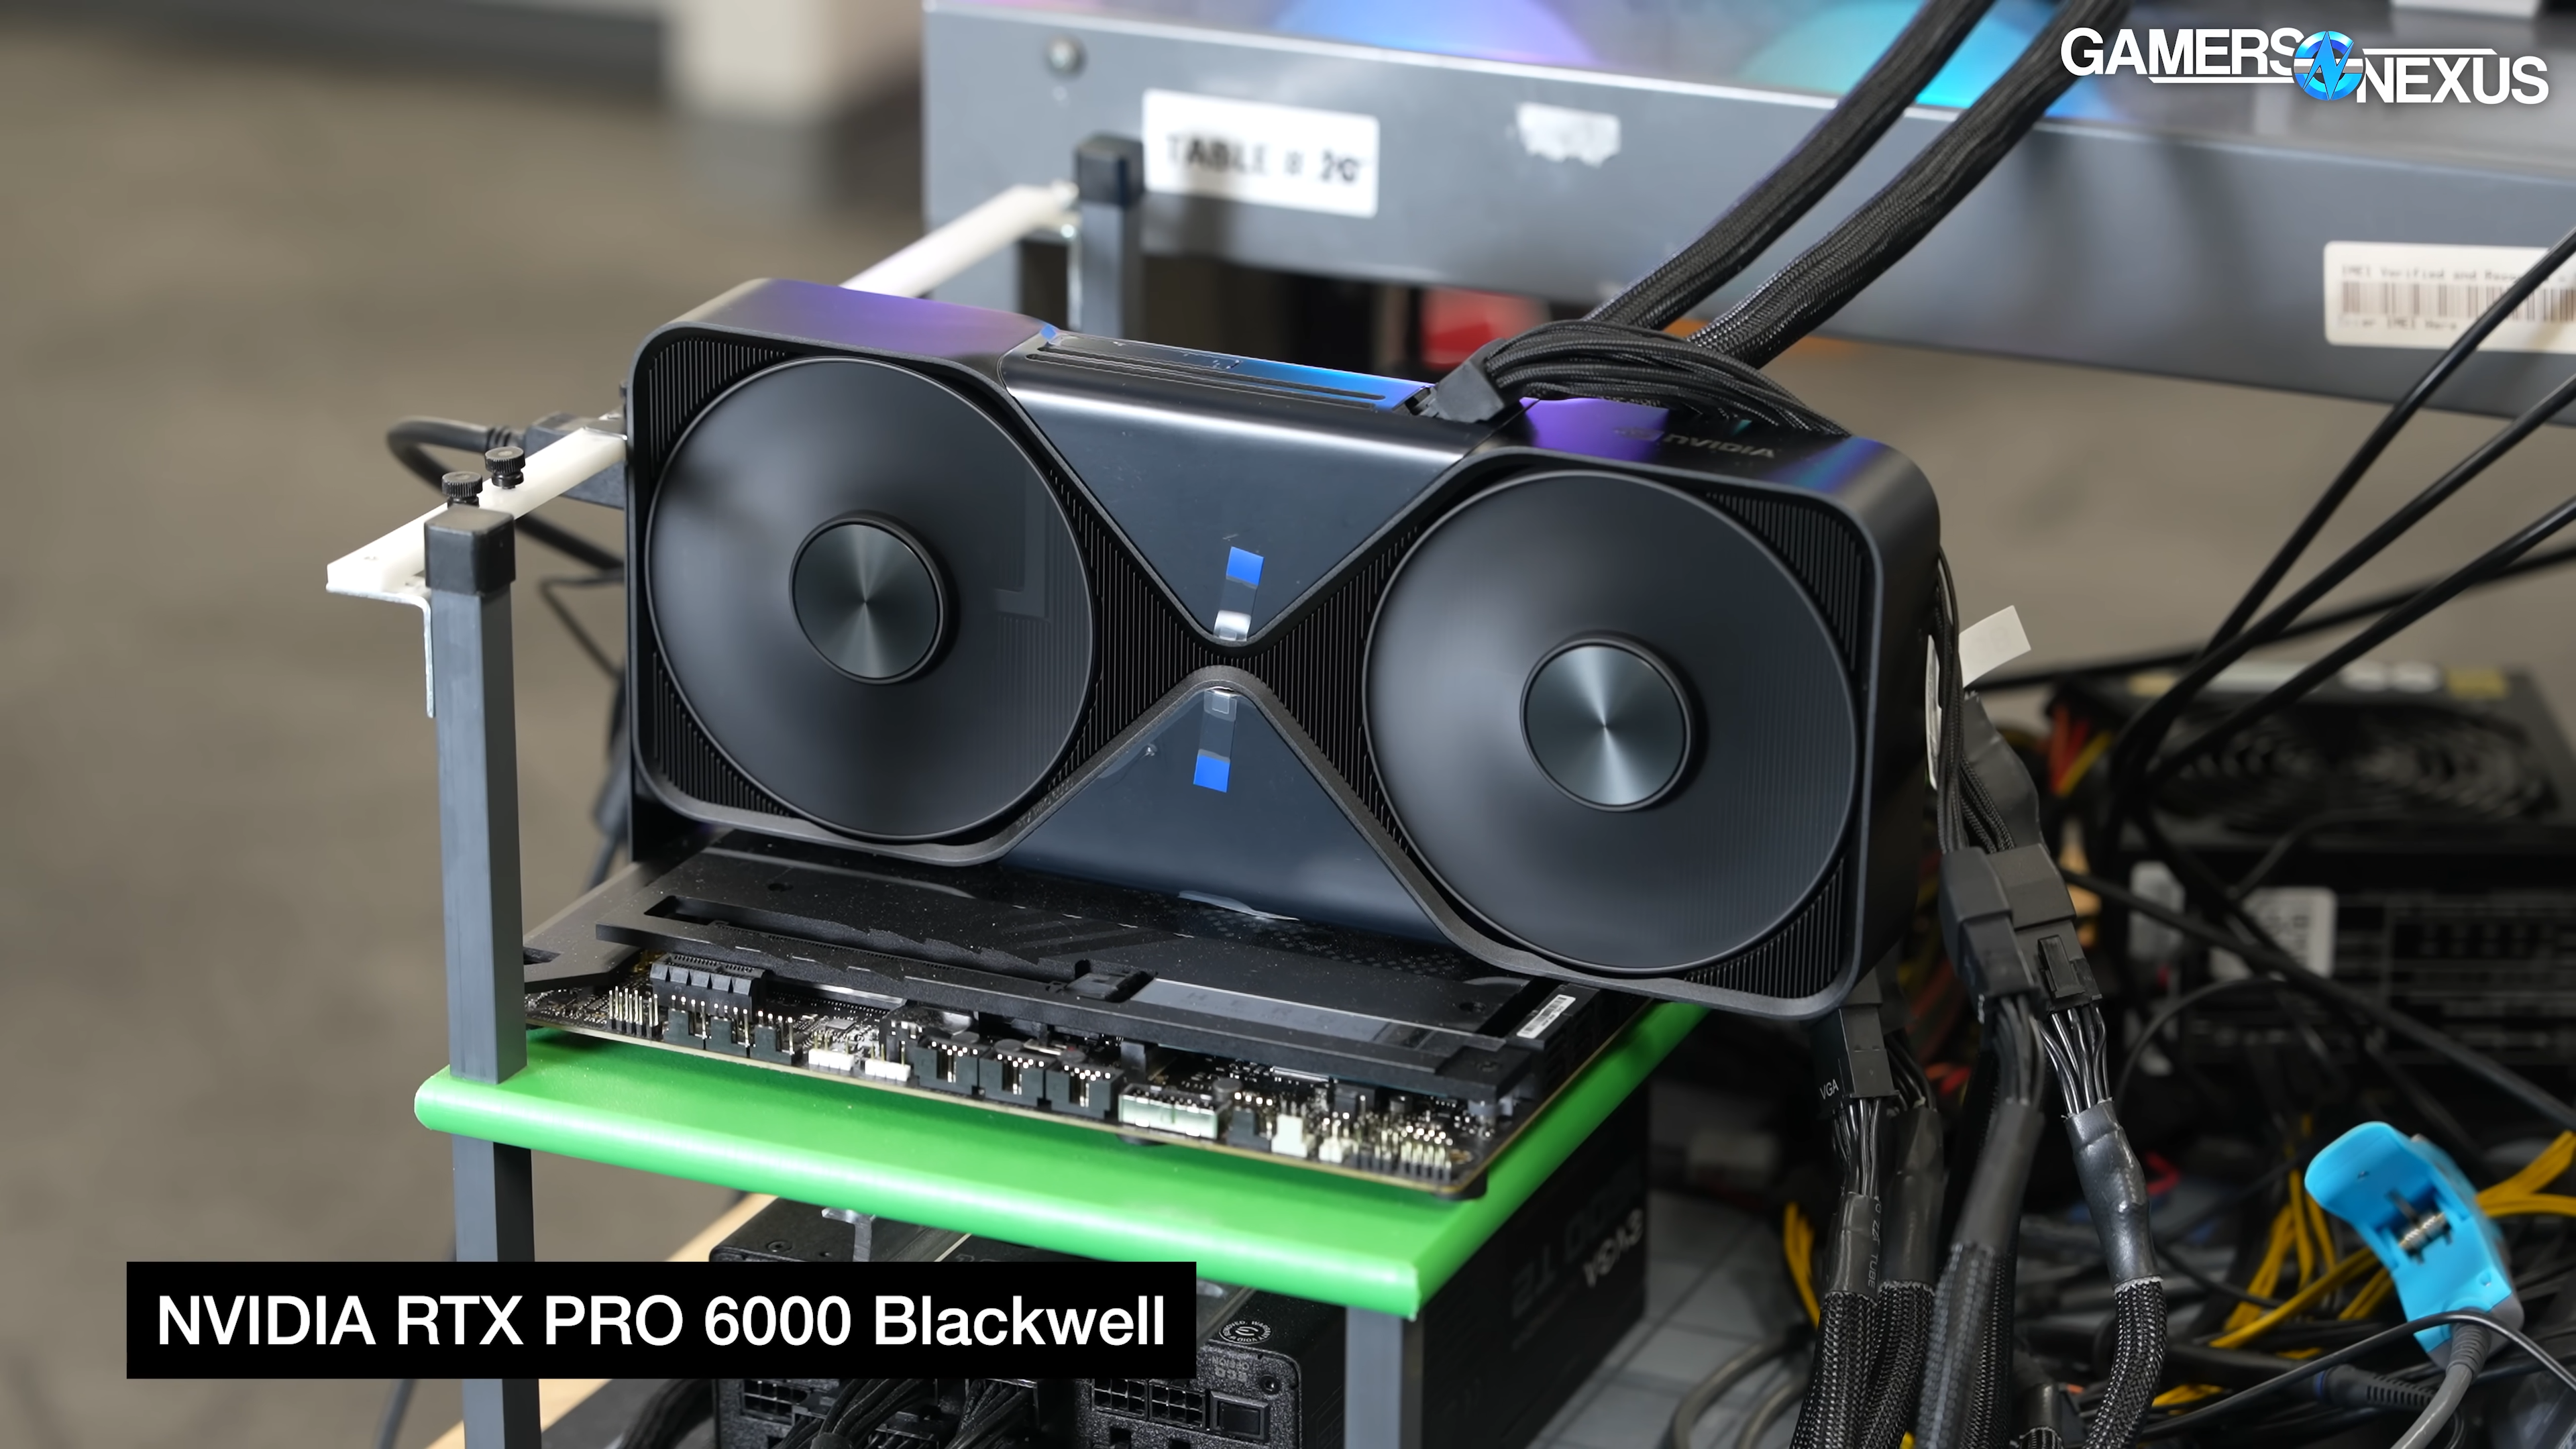
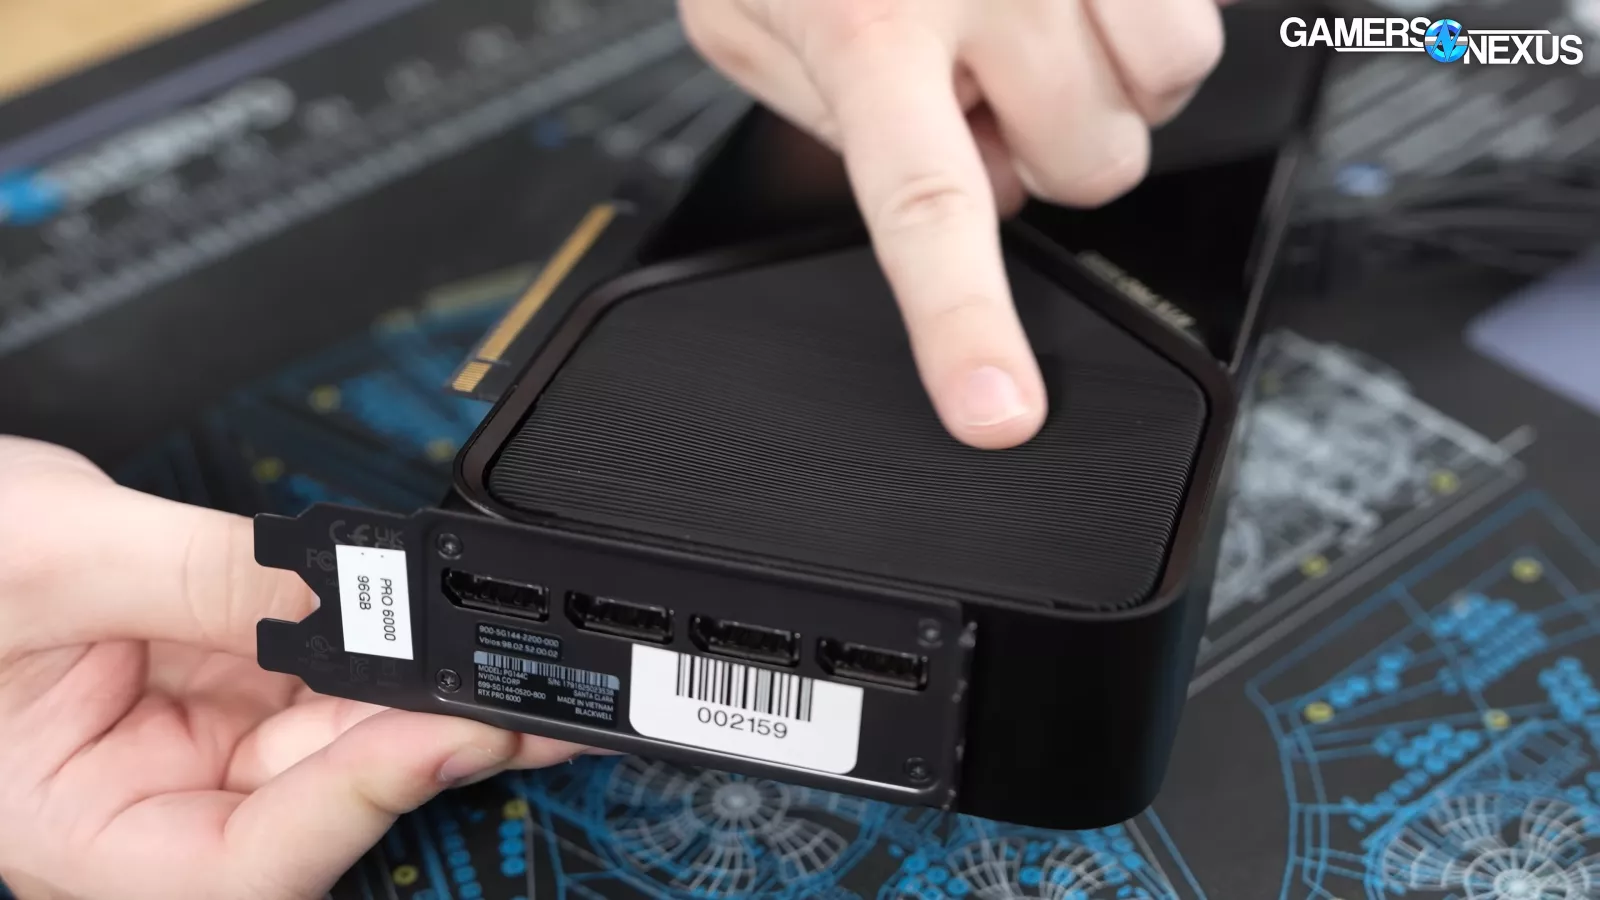
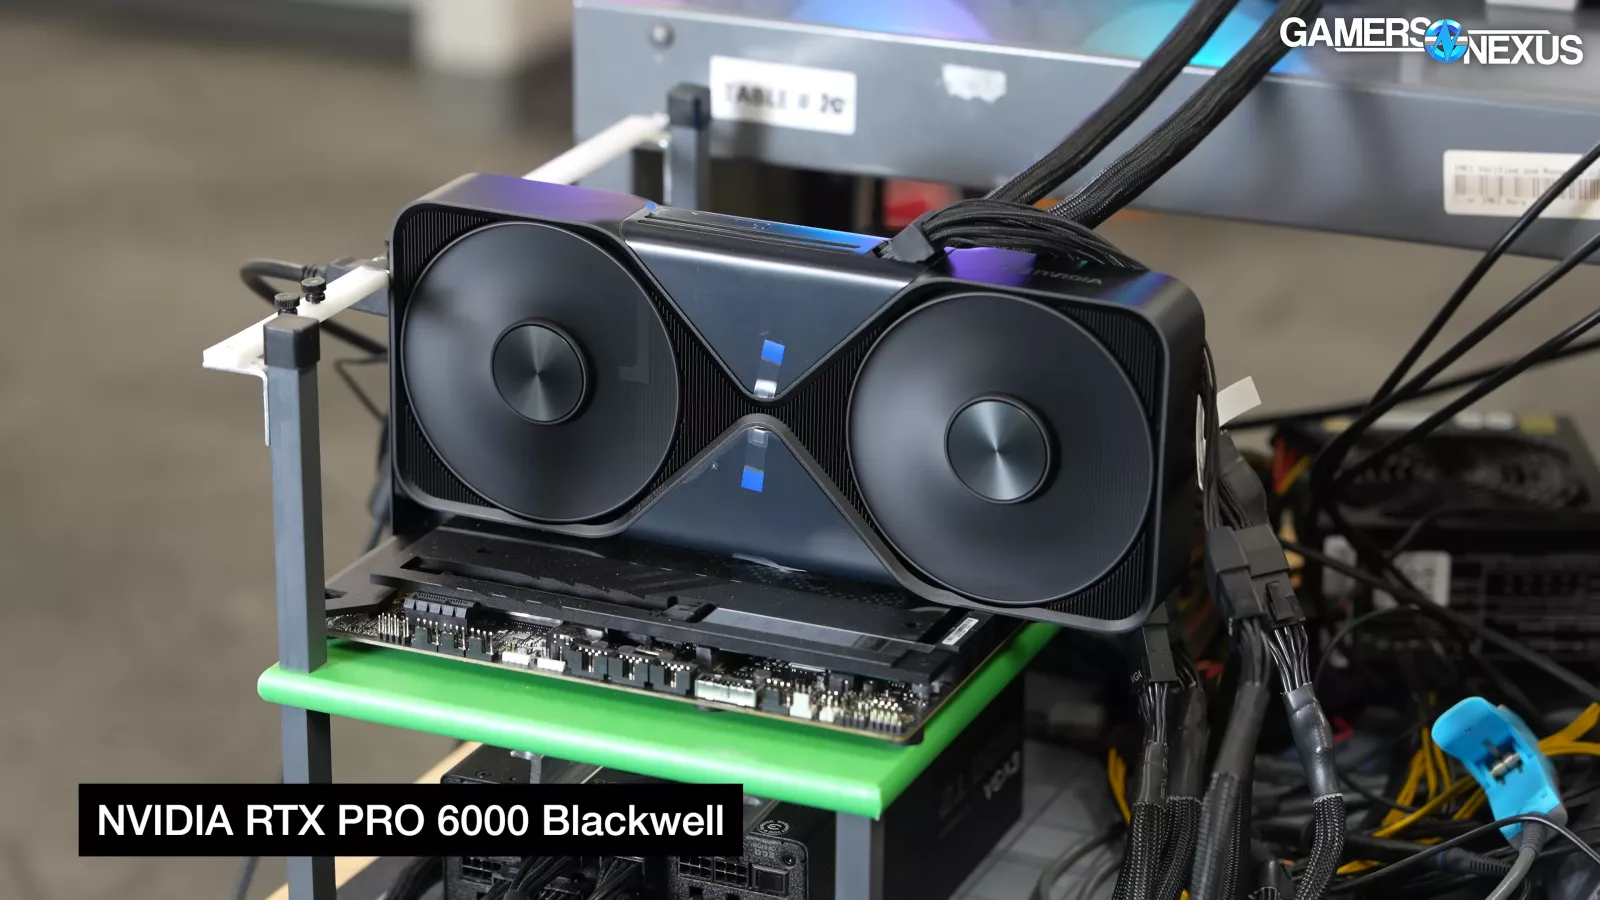
There are multiple versions of the RTX 6000. The one we're looking at specifically is called the Blackwell Workstation Edition, but NVIDIA also has so-called “server editions” of the cards, and those are intended to go into servers and racks where they're getting force fed air from the front of the chassis rather than using an FE style cooler, which is the one we're looking at today. So, the one we're looking at is more similar to what we would see in sort of the consumer to prosumer workstation class.
NVIDIA RTX 6000 Specs, Architecture Basics, and Price
Getting into the specs:
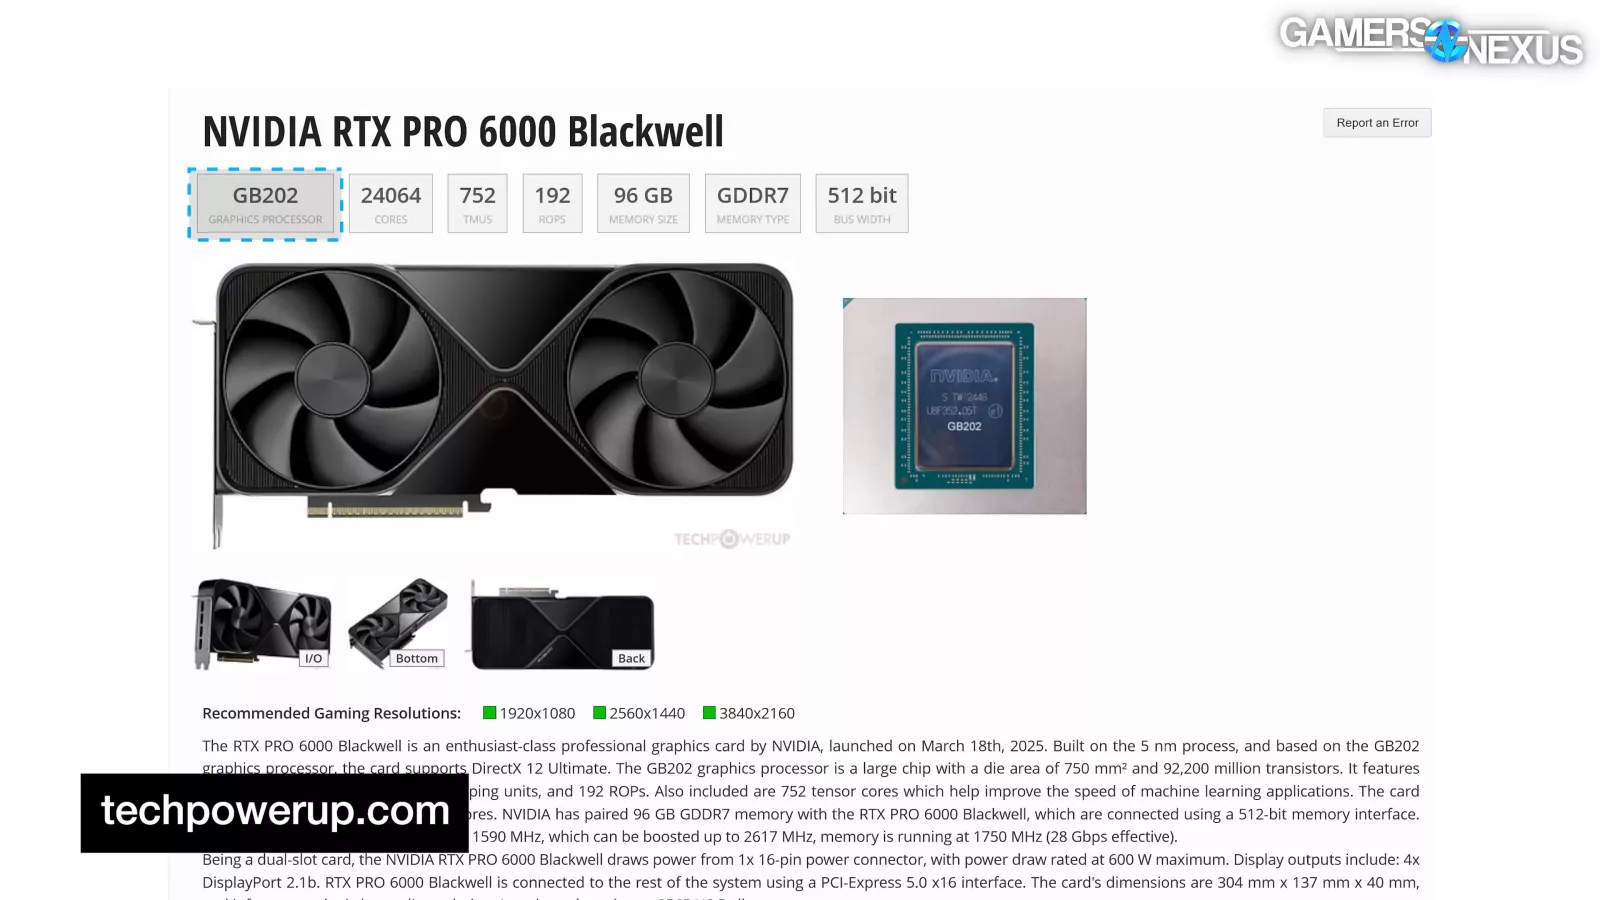
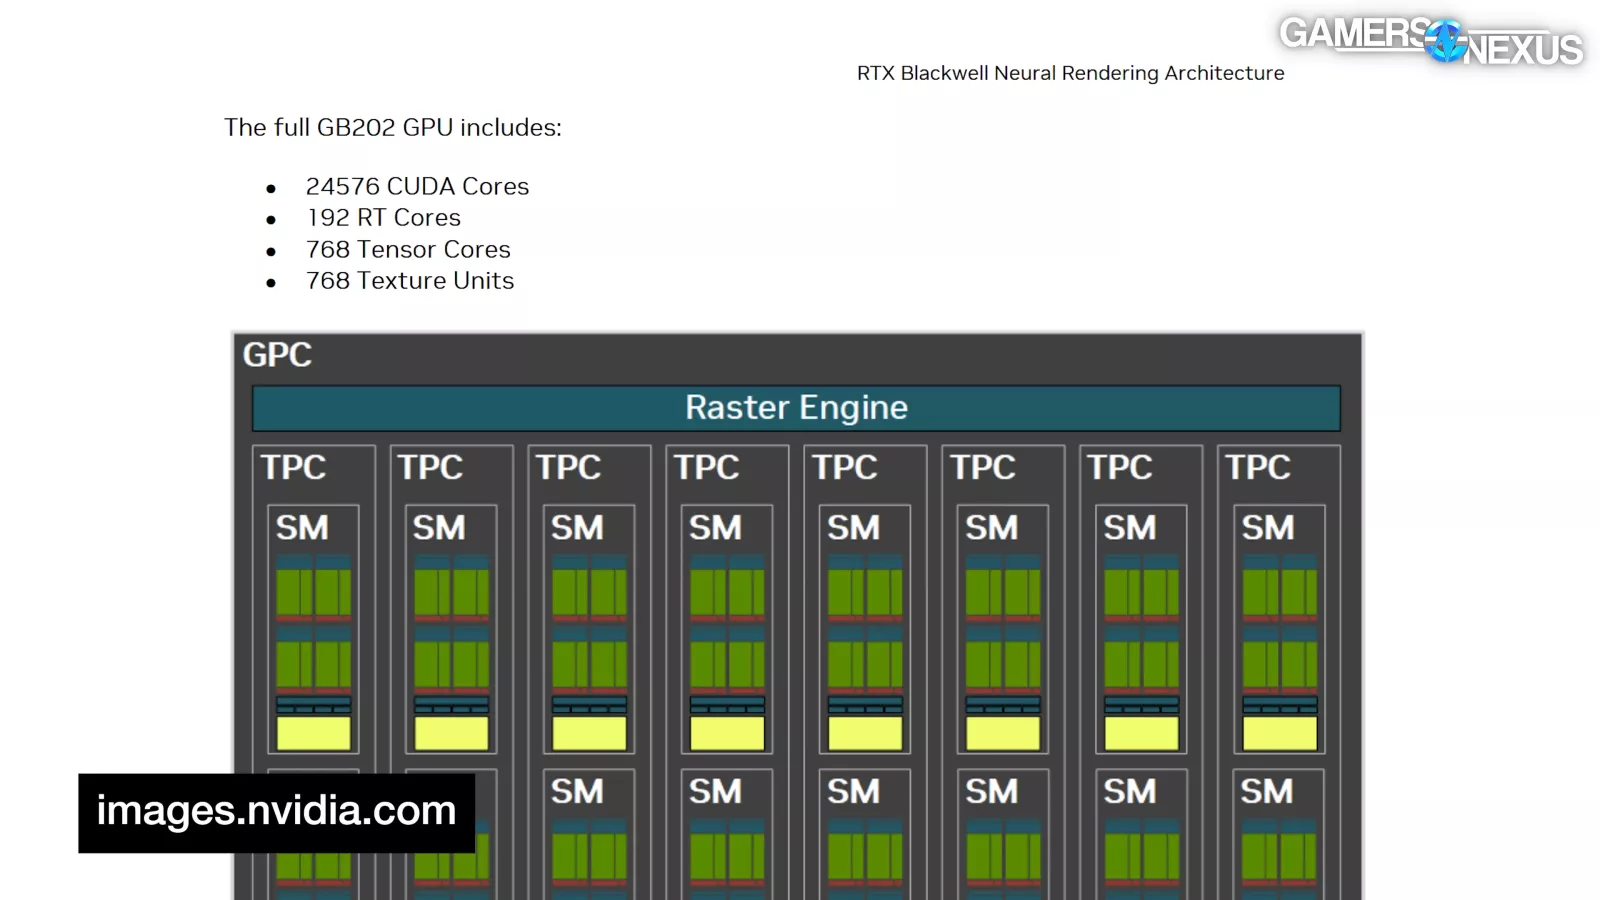
The RTX PRO 6000 Blackwell GPU is built on the GB202 Blackwell die. The full GB202 die has support for up to 24,576 CUDA cores, 768 TMUs, 192 ROPs that might even be present, and is also used for the RTX 5090.
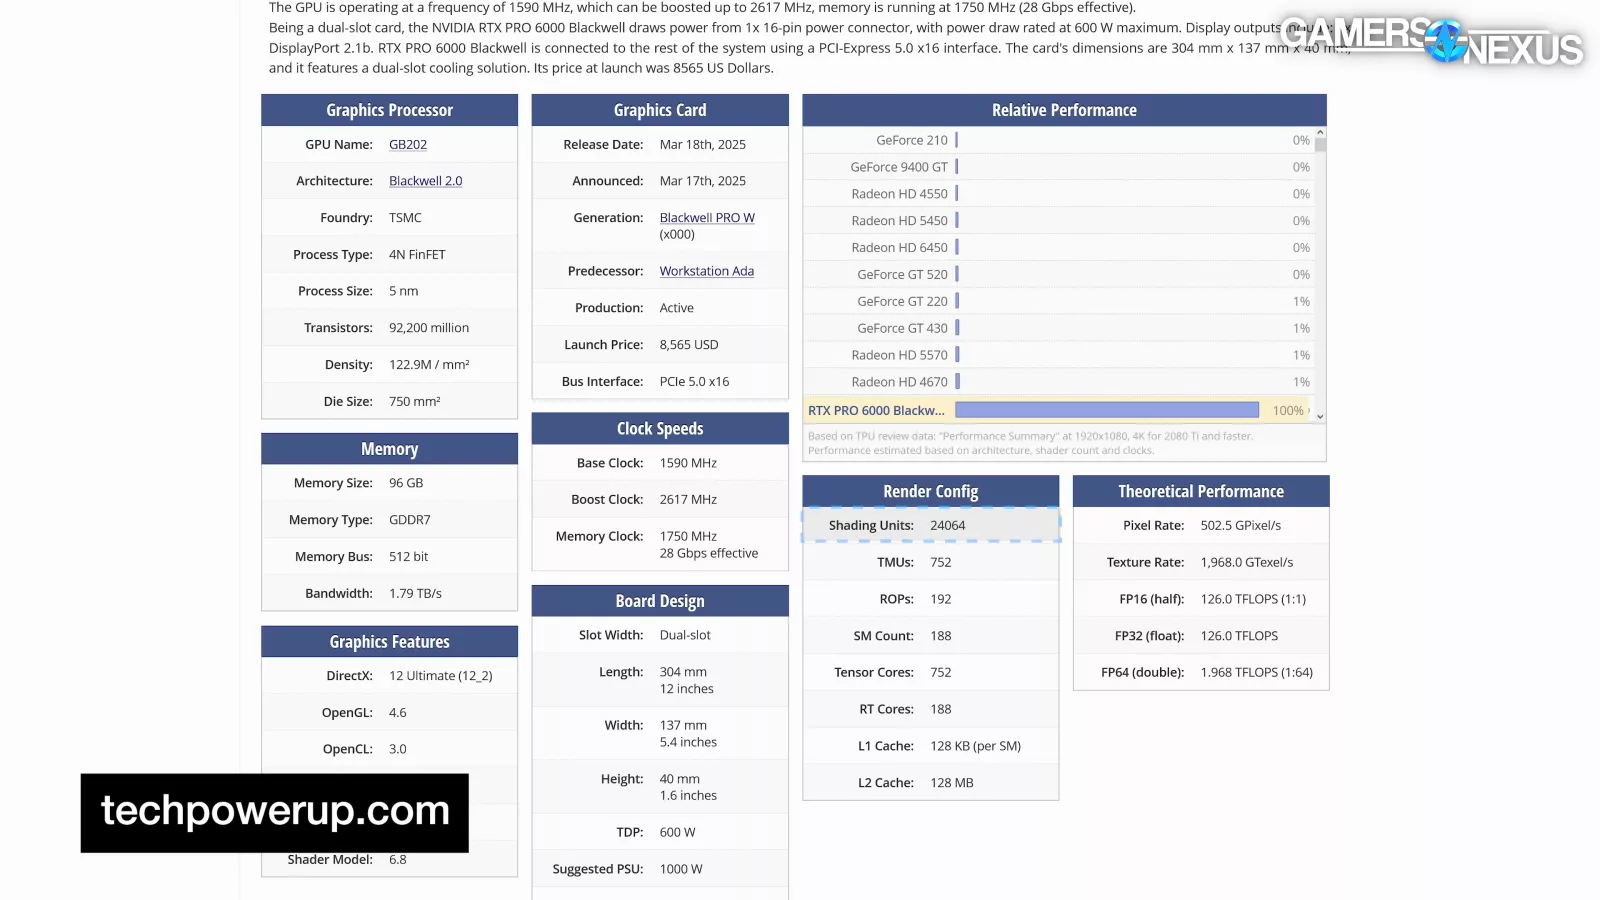
The PRO 6000 variation on this GPU has 24,064 CUDA cores, so it’s down by 512 and isn’t a perfect die, with 752 TMUs (down from 768) and still 192 ROPs, and they’d better all be there for the price. The card is also running 188 RT cores and supports PCIe 5.0 x16. Advertised clocks are 1590 MHz base and 2617 MHz boost. The real reason people buy this card is its memory, though, at 96GB of GDDR7.
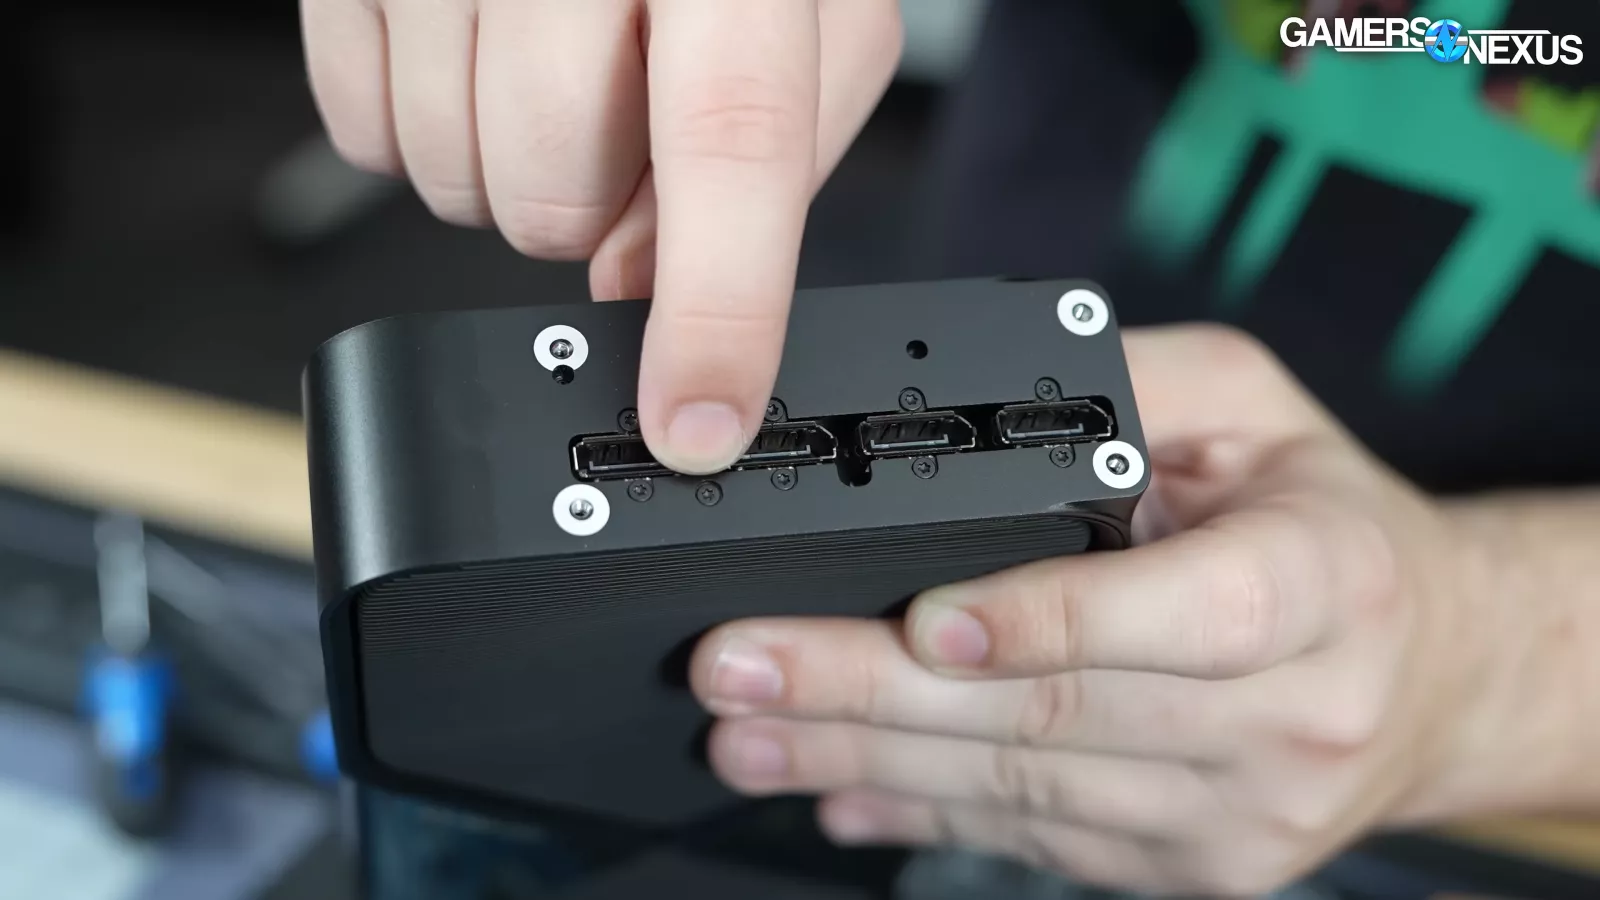
The closest consumer class card to compare against is the RTX 5090. It’s built on the same die, but with 176 ROPs, 680 TMUs, 170 RT cores, 21,760 CUDA cores, 32GB of GDDR7 memory, a 512-bit bus width, and a far lower price at $2,000 to, realistically, $3,000 rather than $8,000 to $11,000.
For some notable differences: The 5090 only has a third of the memory capacity of the PRO card, and the RTX PRO 6000’s die is almost 98% present while the RTX 5090’s die is closer to 88.5% present, with the remainder either being fused off or defective fallout and fused off.
You could also technically buy four 5090s for the price of one RTX PRO 6000, so the use case really does come down to having as much memory as possible attached to a single GPU and PCIe slot.
NVIDIA RTX 6000 Tear-Down
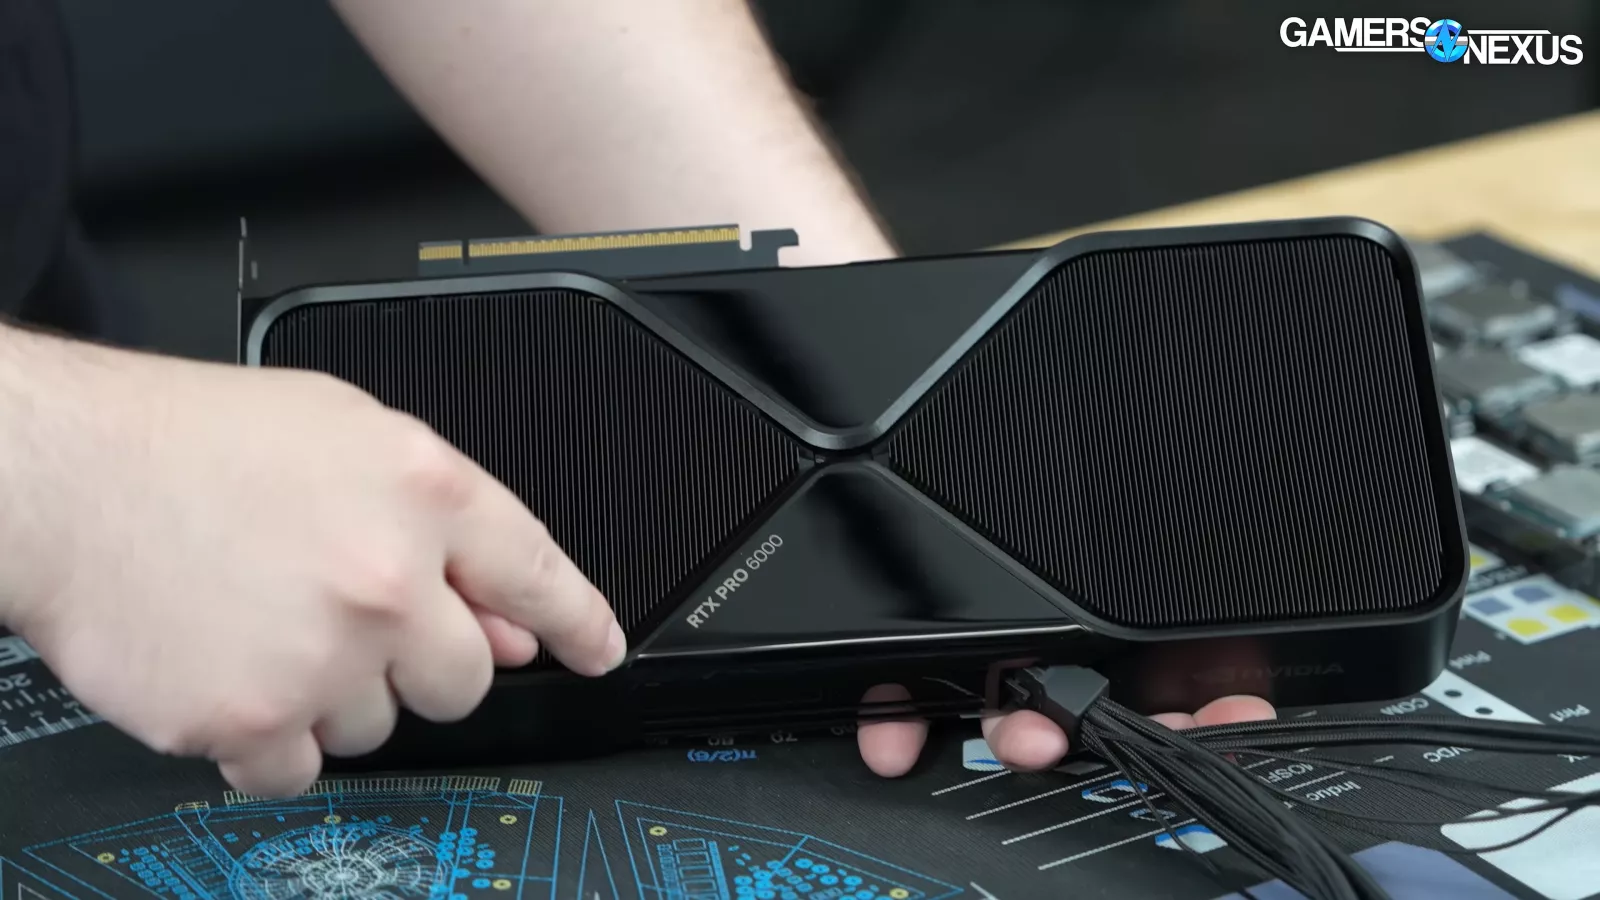
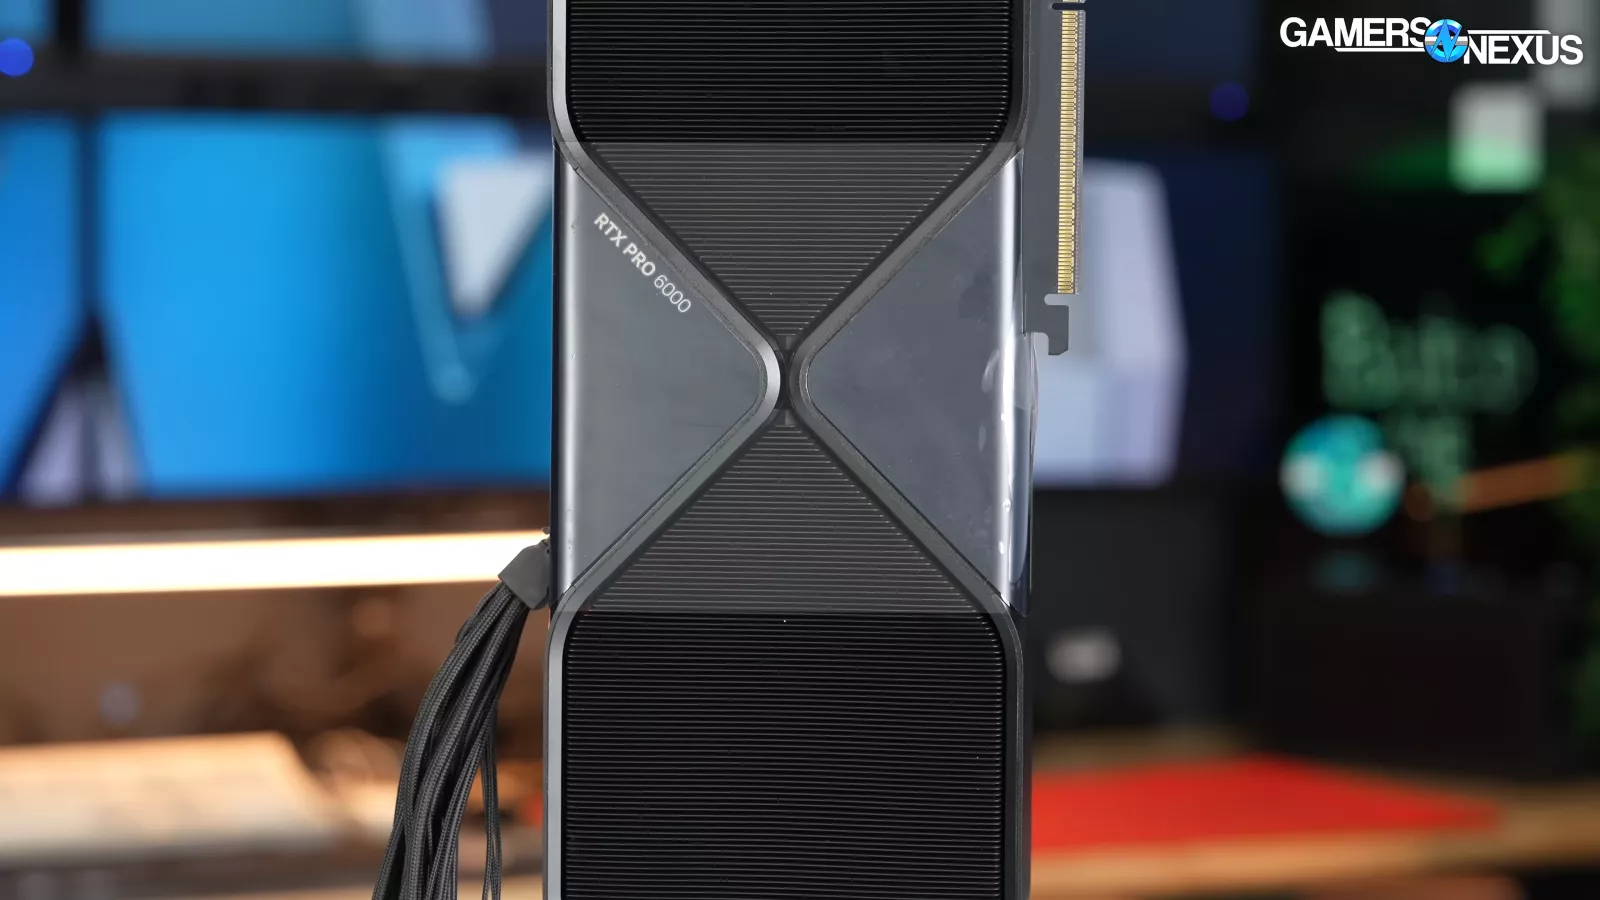
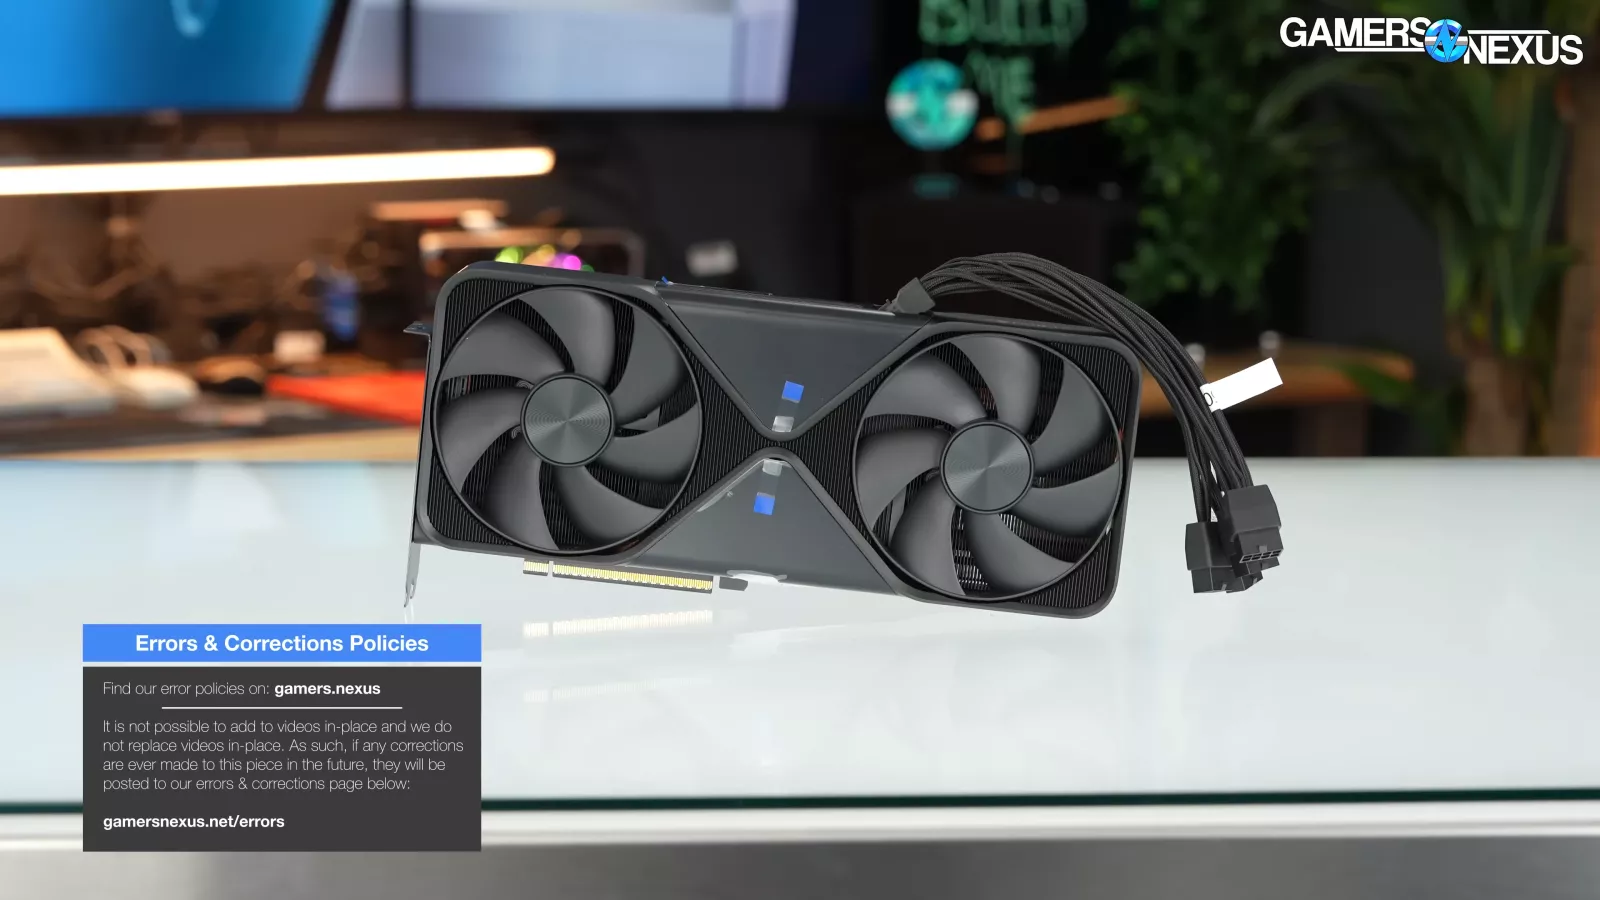
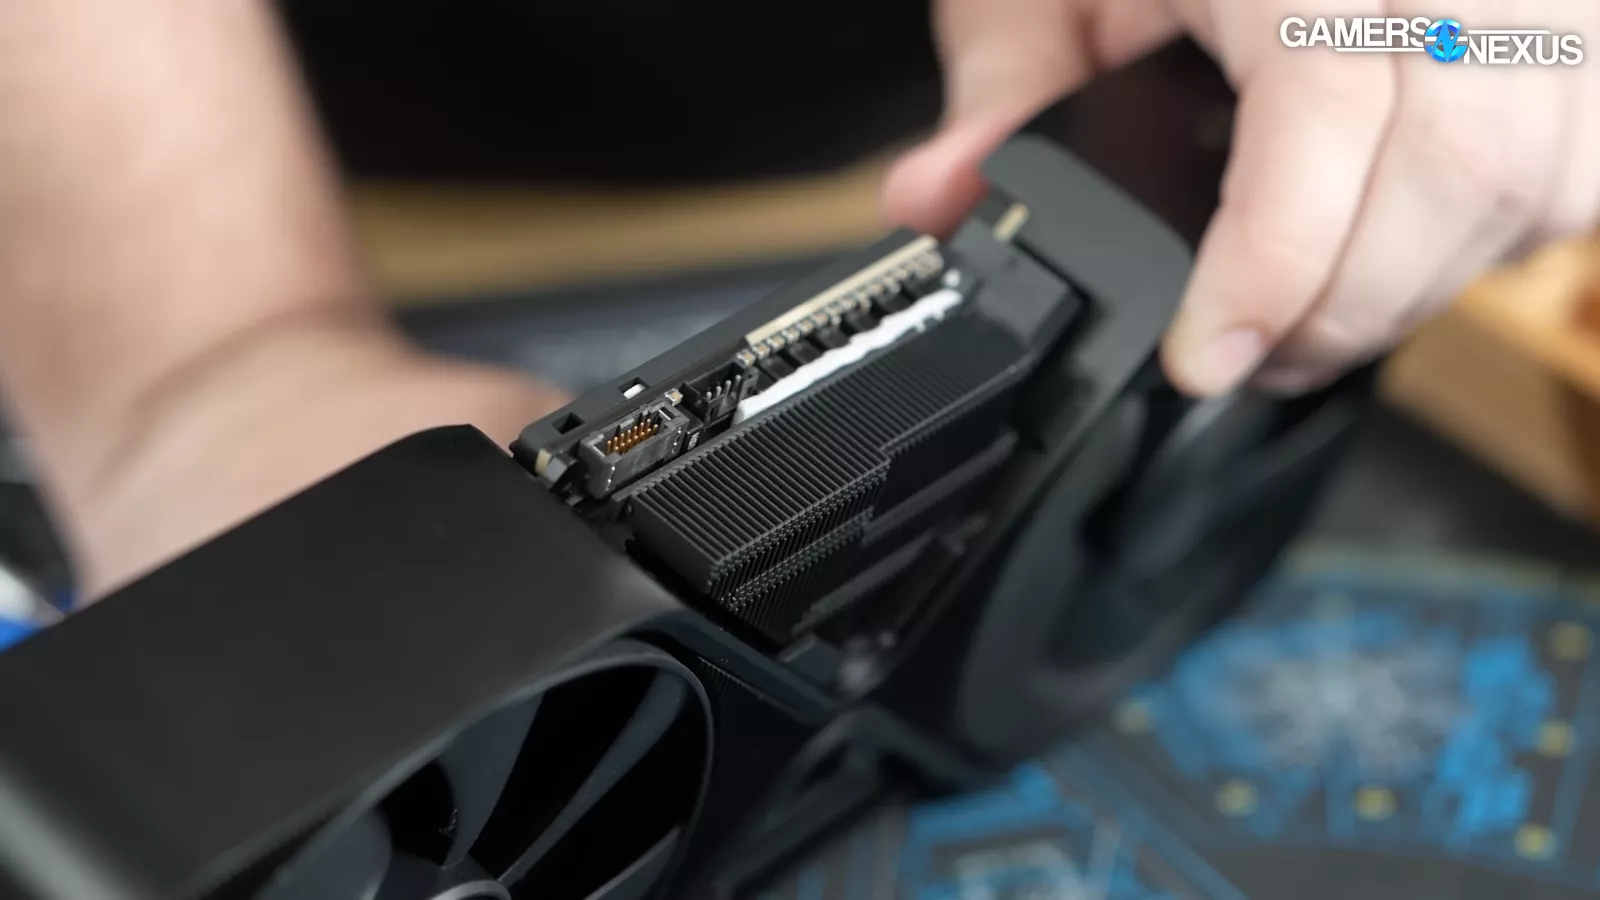
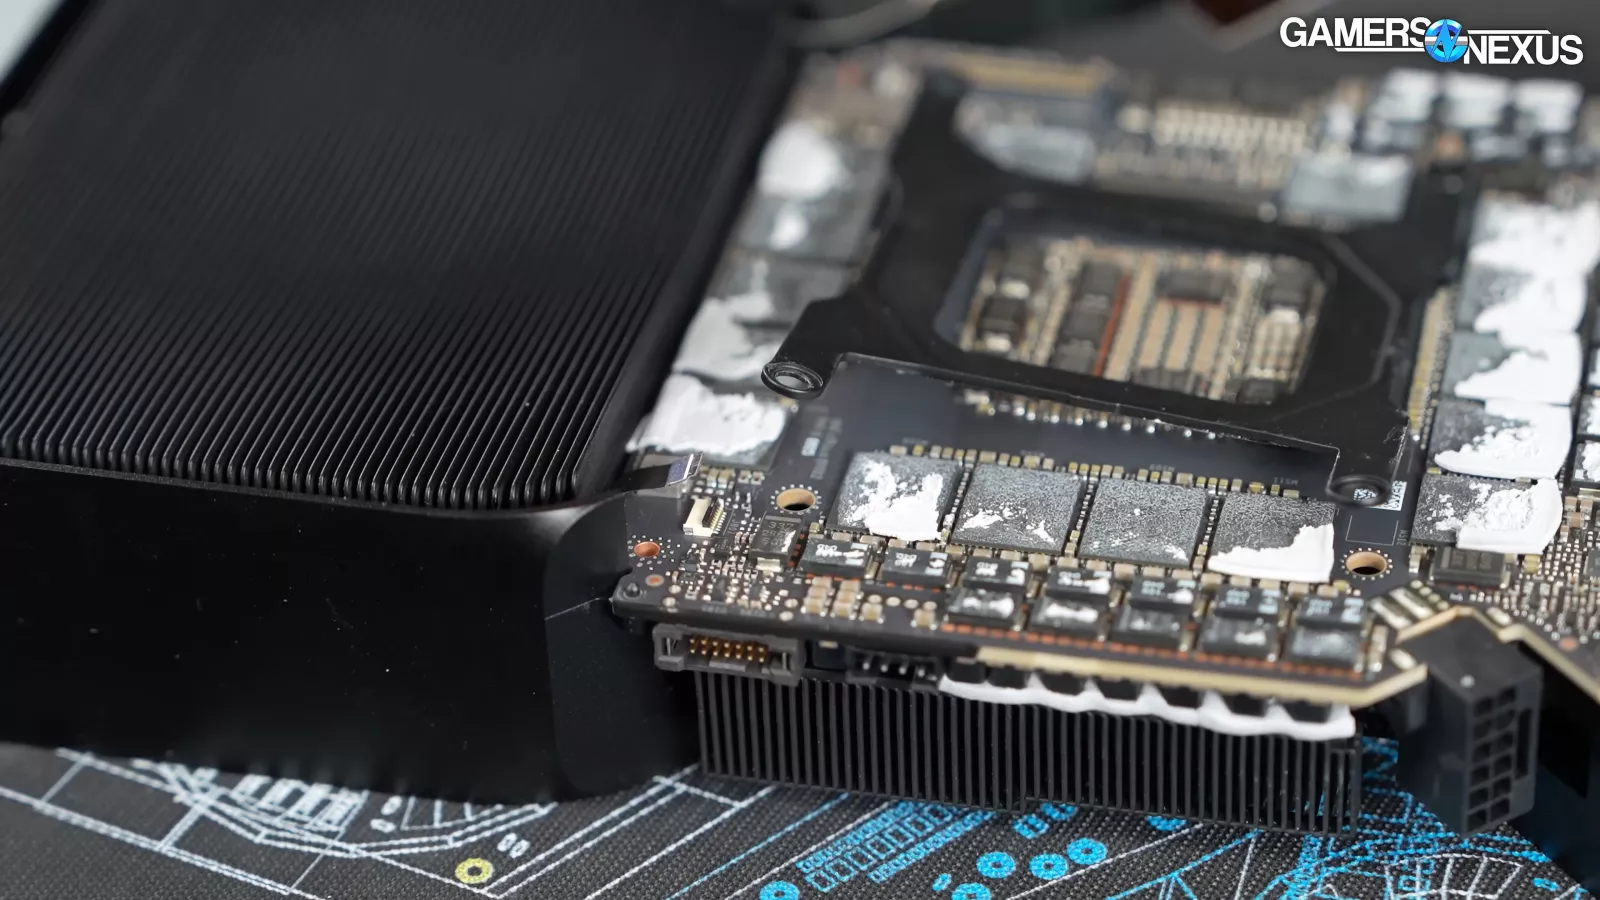
The RTX Pro 6000 we tested is a 2-slot card with 2 large fans on the front. The PCB is in the center of the card and you can see where the fins start to get taller. This indicates where the PCB plate ends.
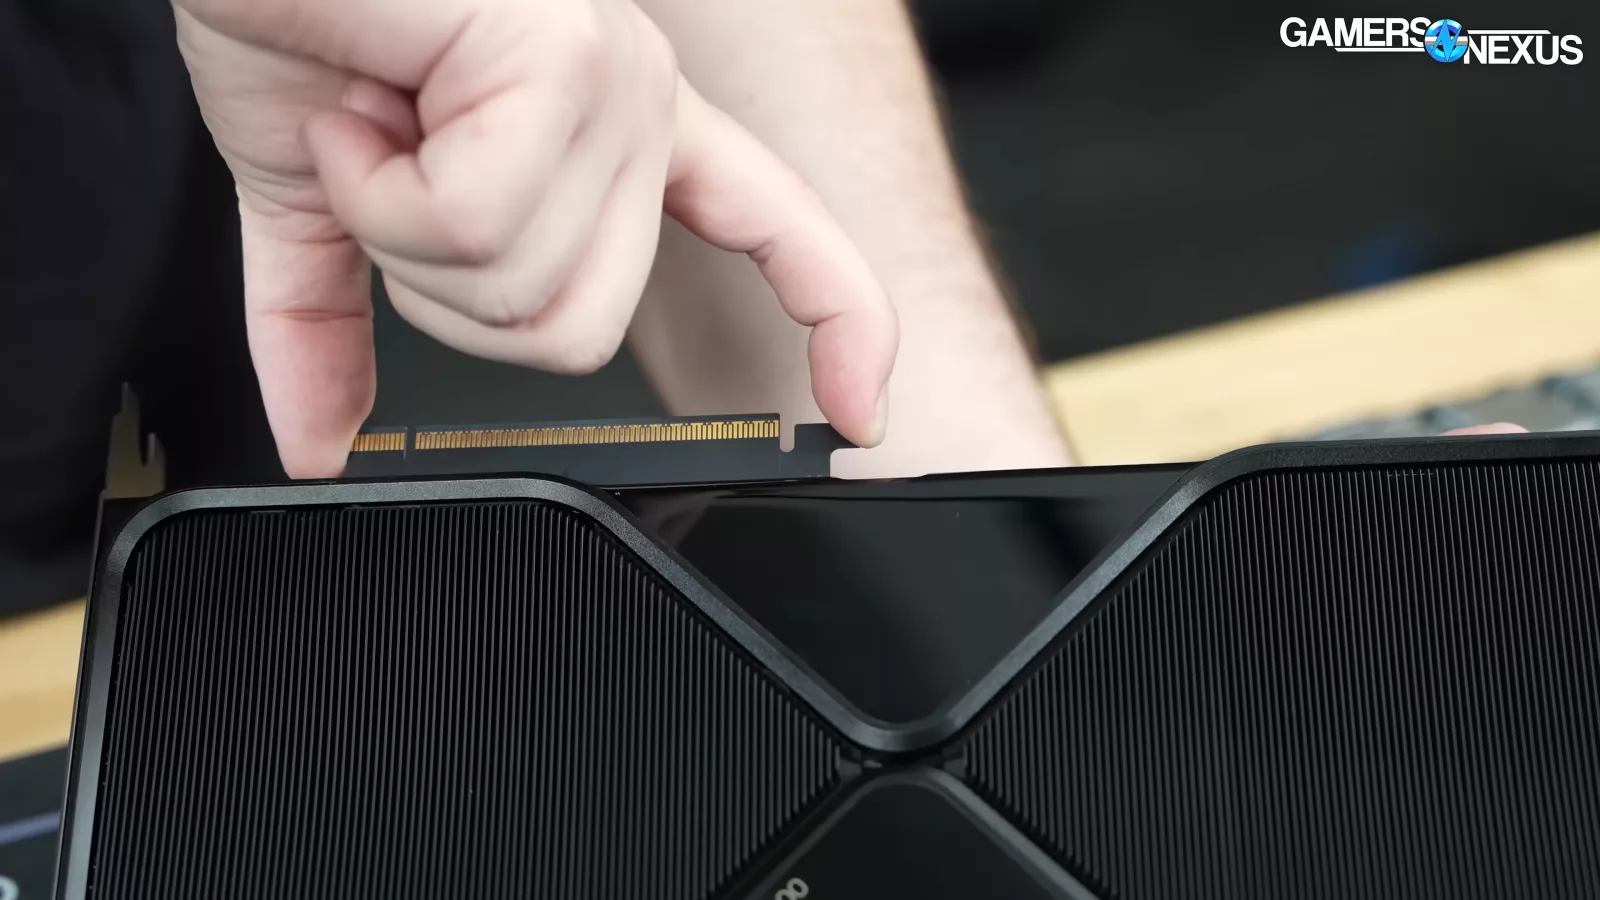
The card’s PCIe slot is connected via a customized pinout adapter.
If you look at the backside of the card where the fans are, you’ll notice a slight depression down towards the middle of the fins. This is supposed to help with pressure drop. The design is full flow-through, which pushes air straight through the card rather than into a PCB.
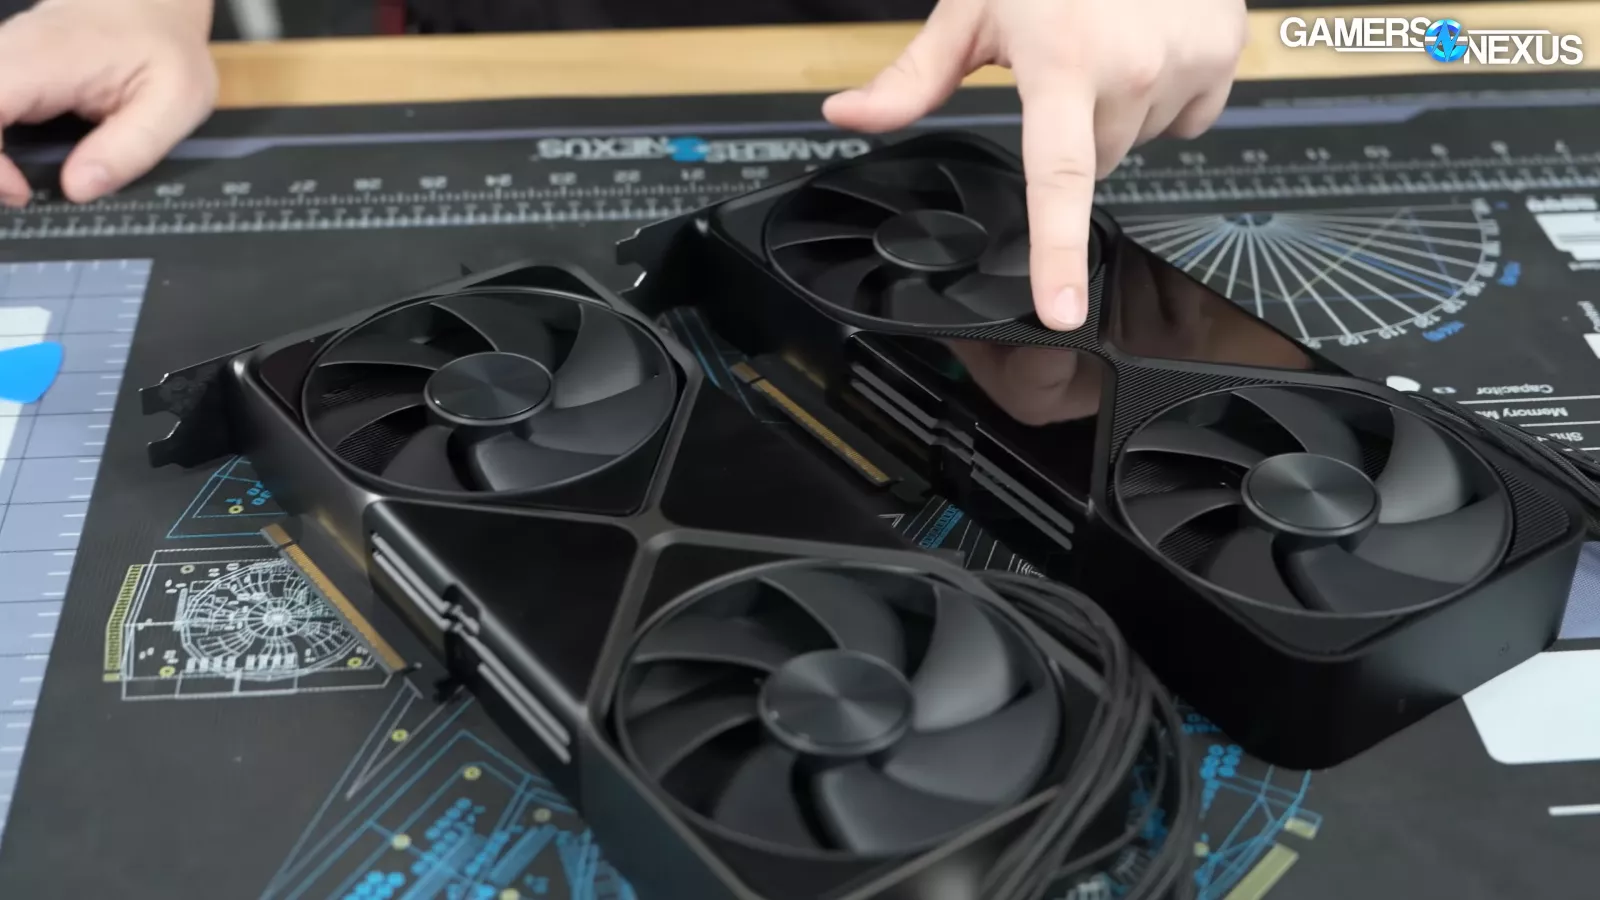
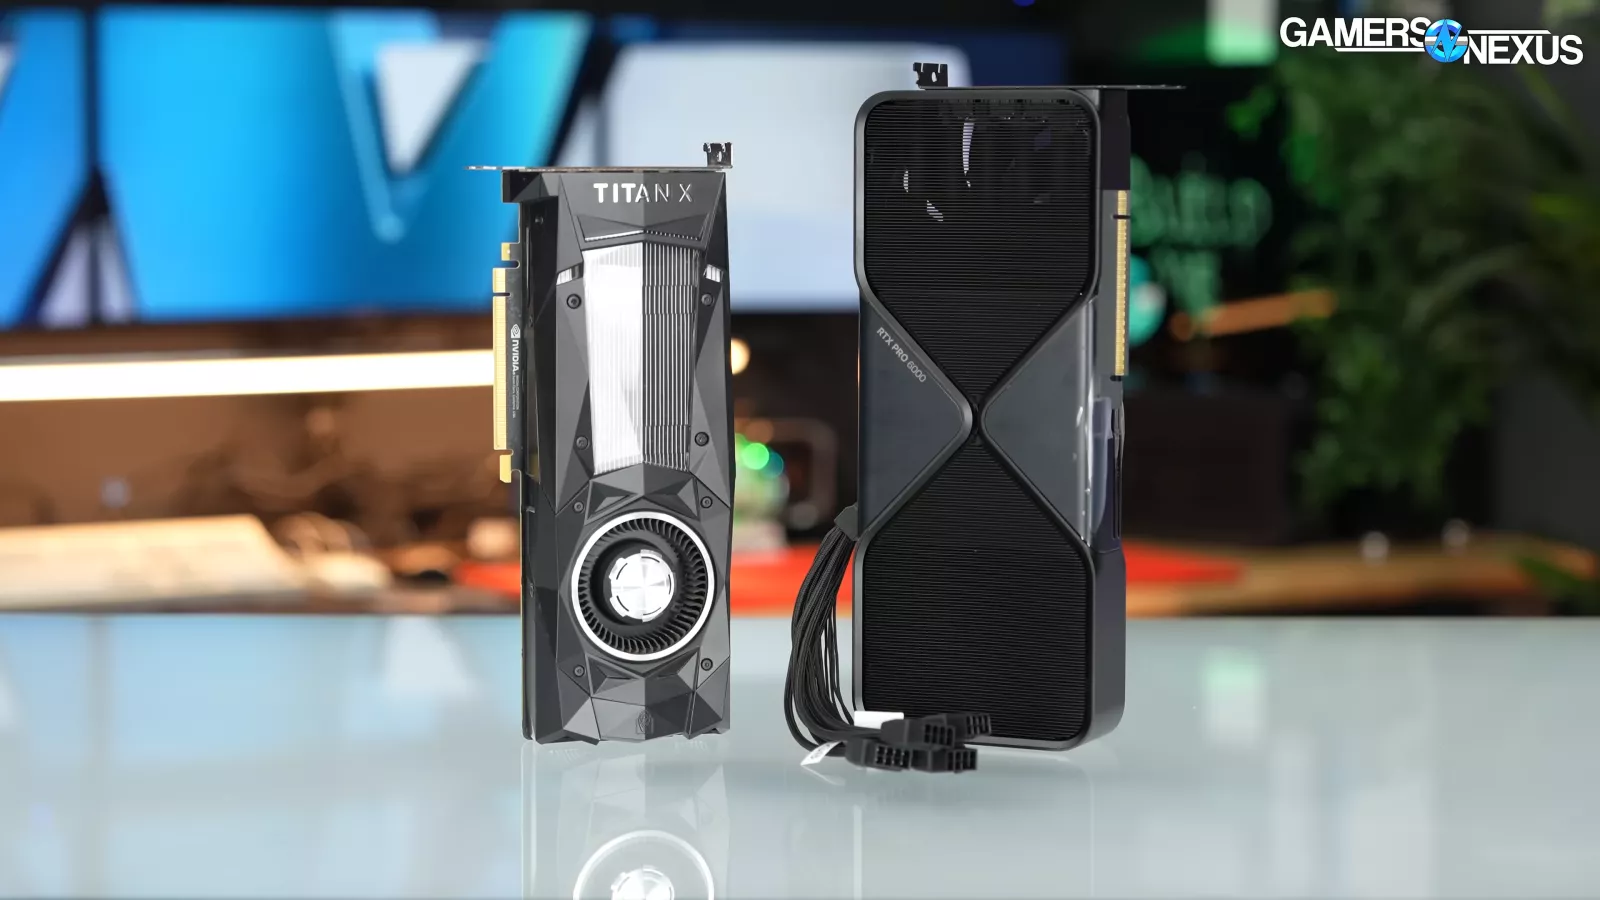
The other side of the card looks very similar to a 5090.
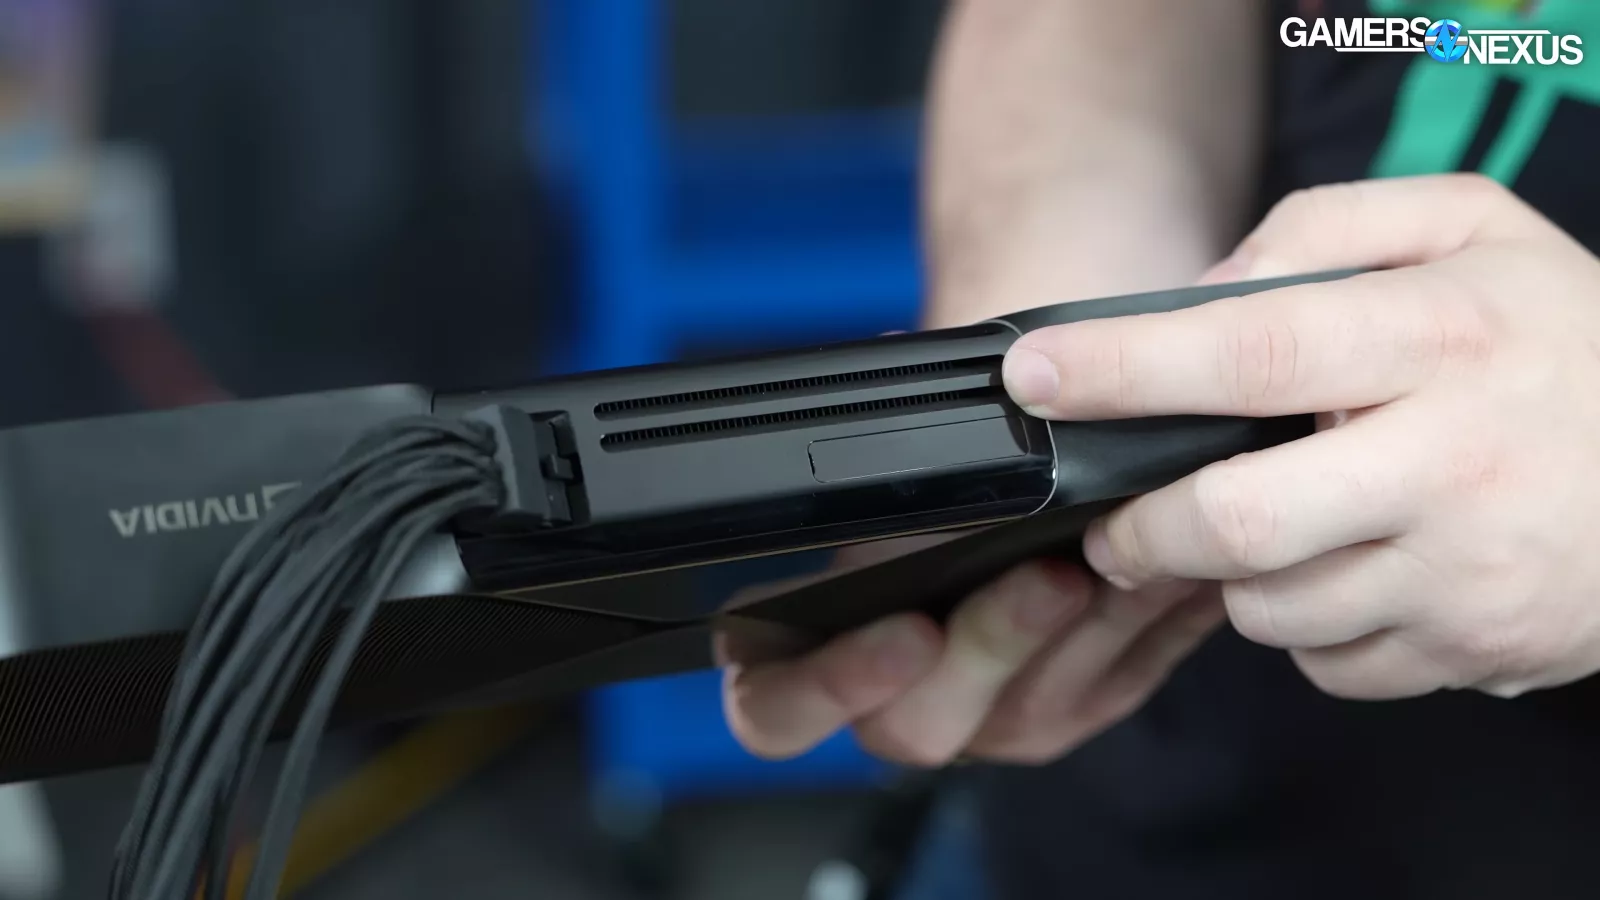
The top of the RTX Pro 6000 retains the angle on the card’s vented slats. This projects the air out at an angle that’s up and away from the card.
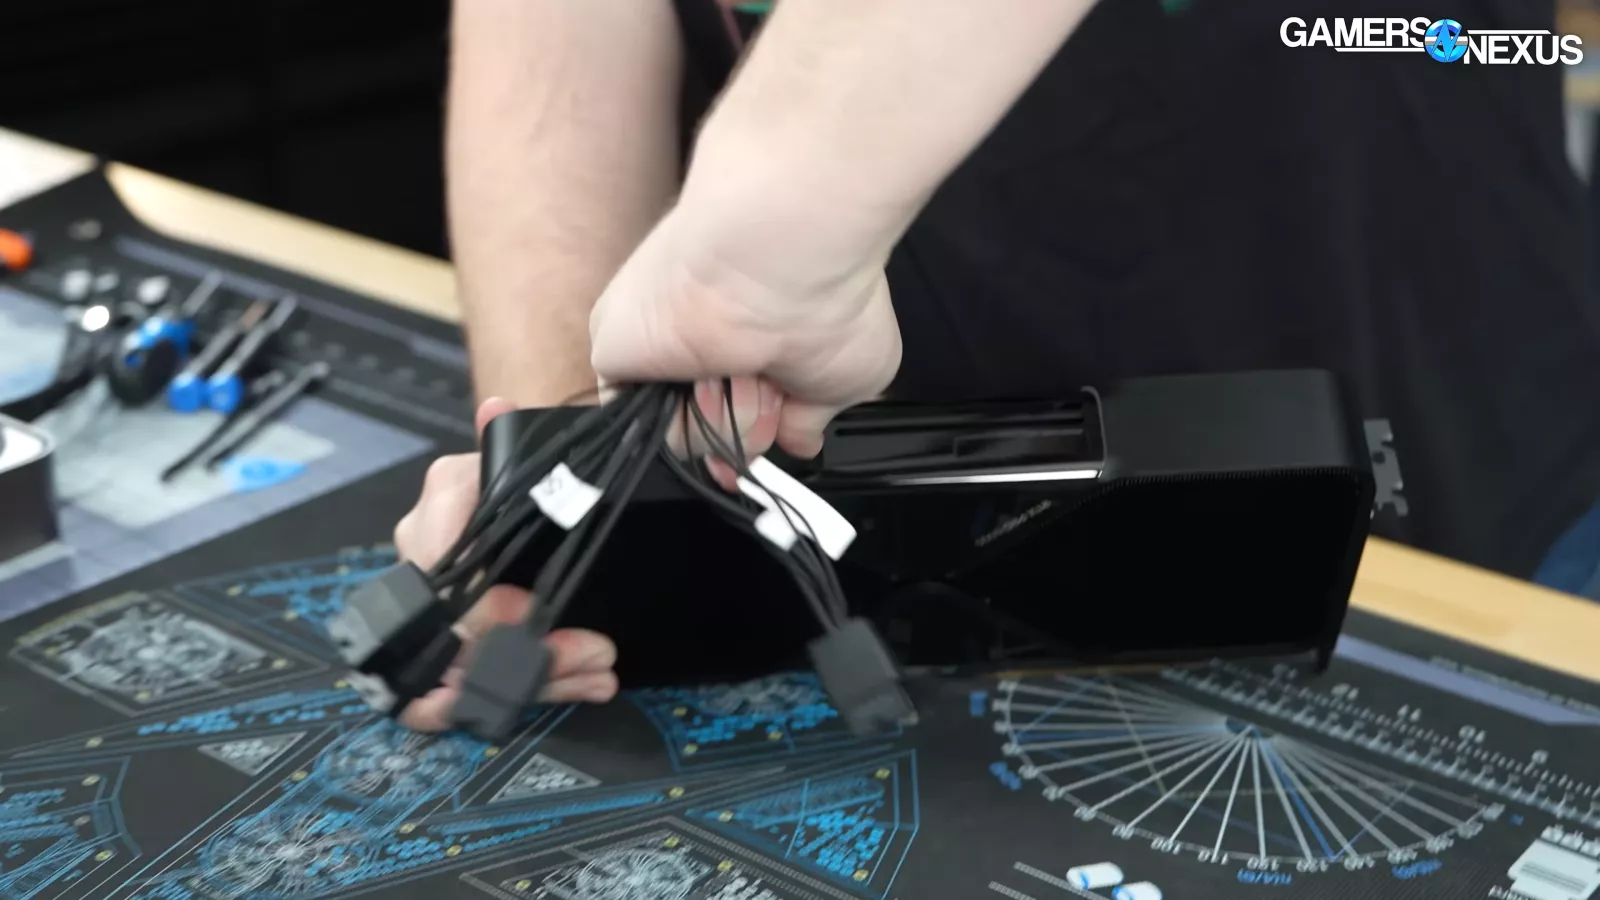
Like the 5090, the card uses a 12VHPWR cable.
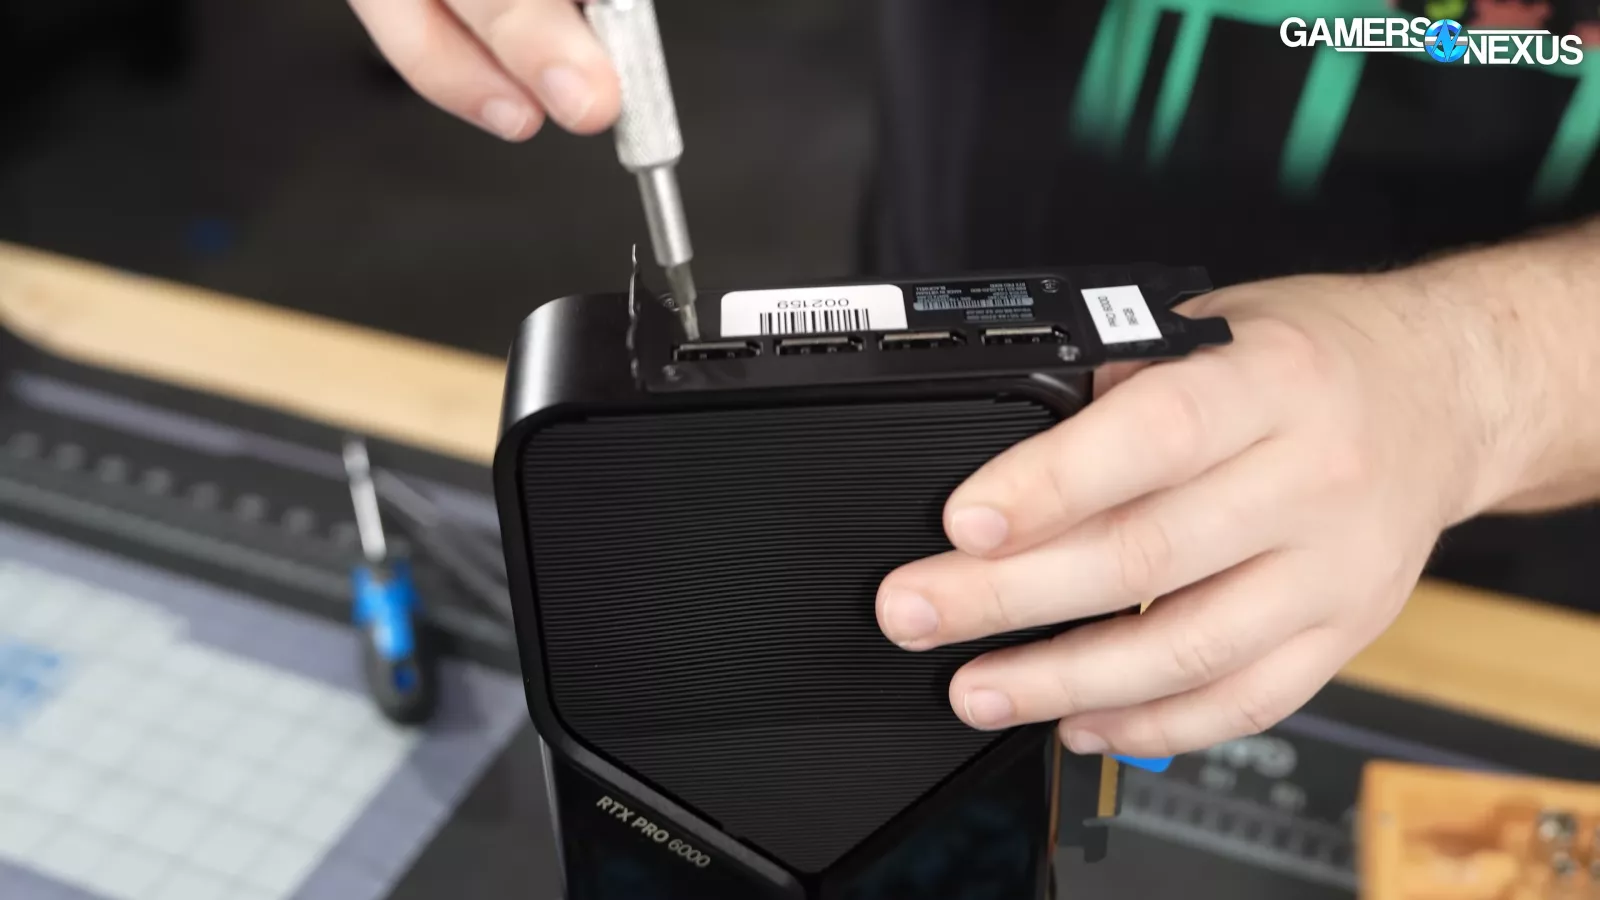
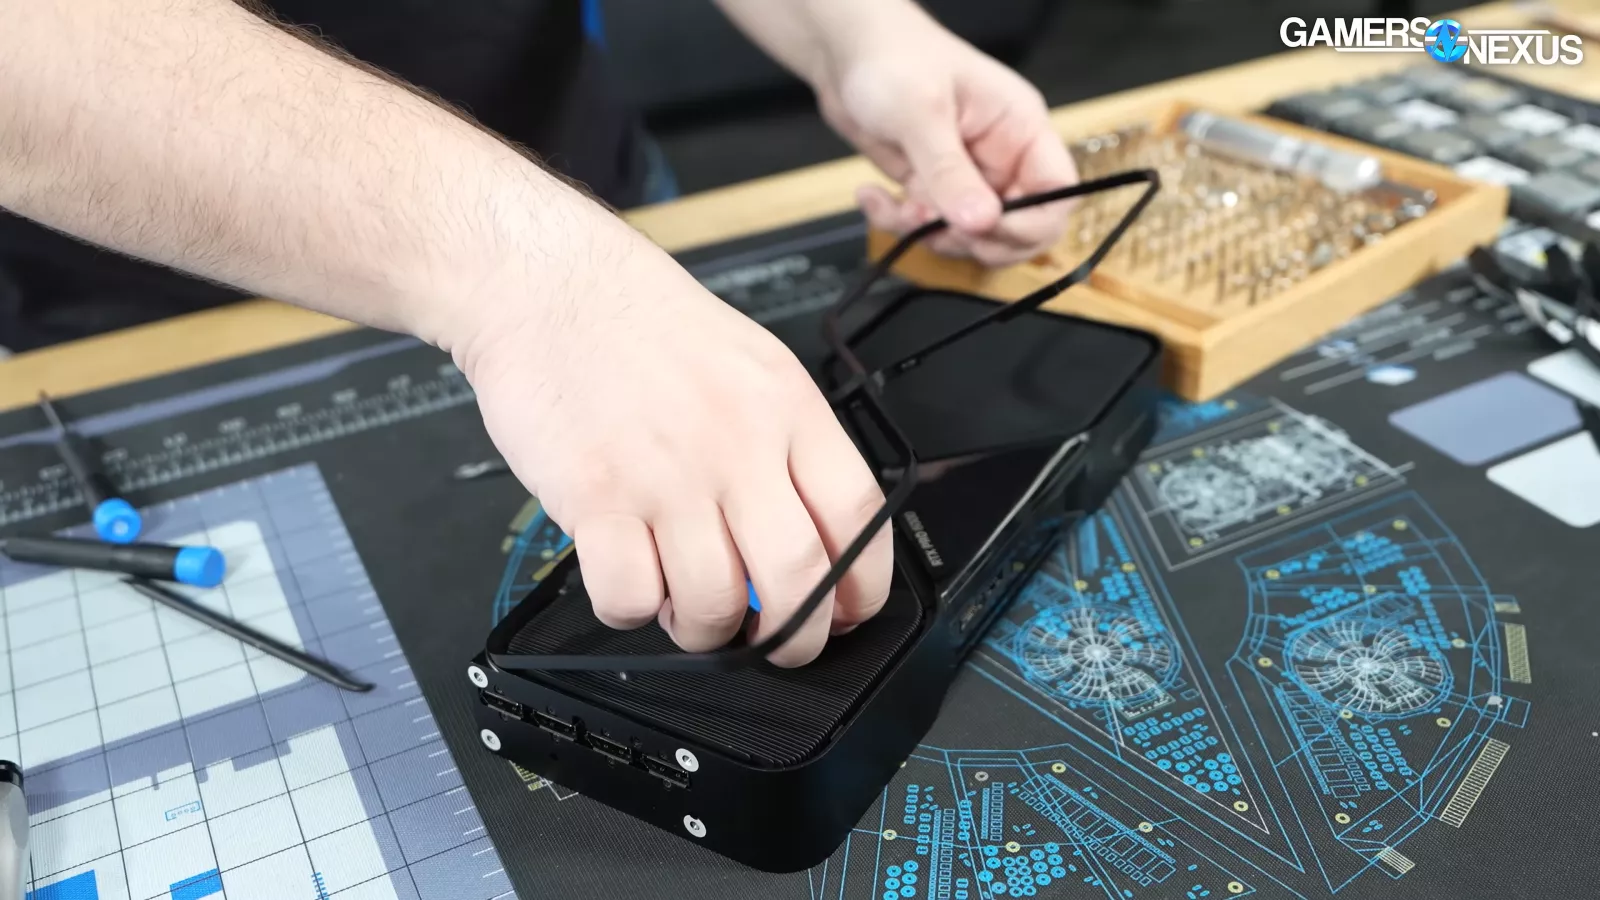
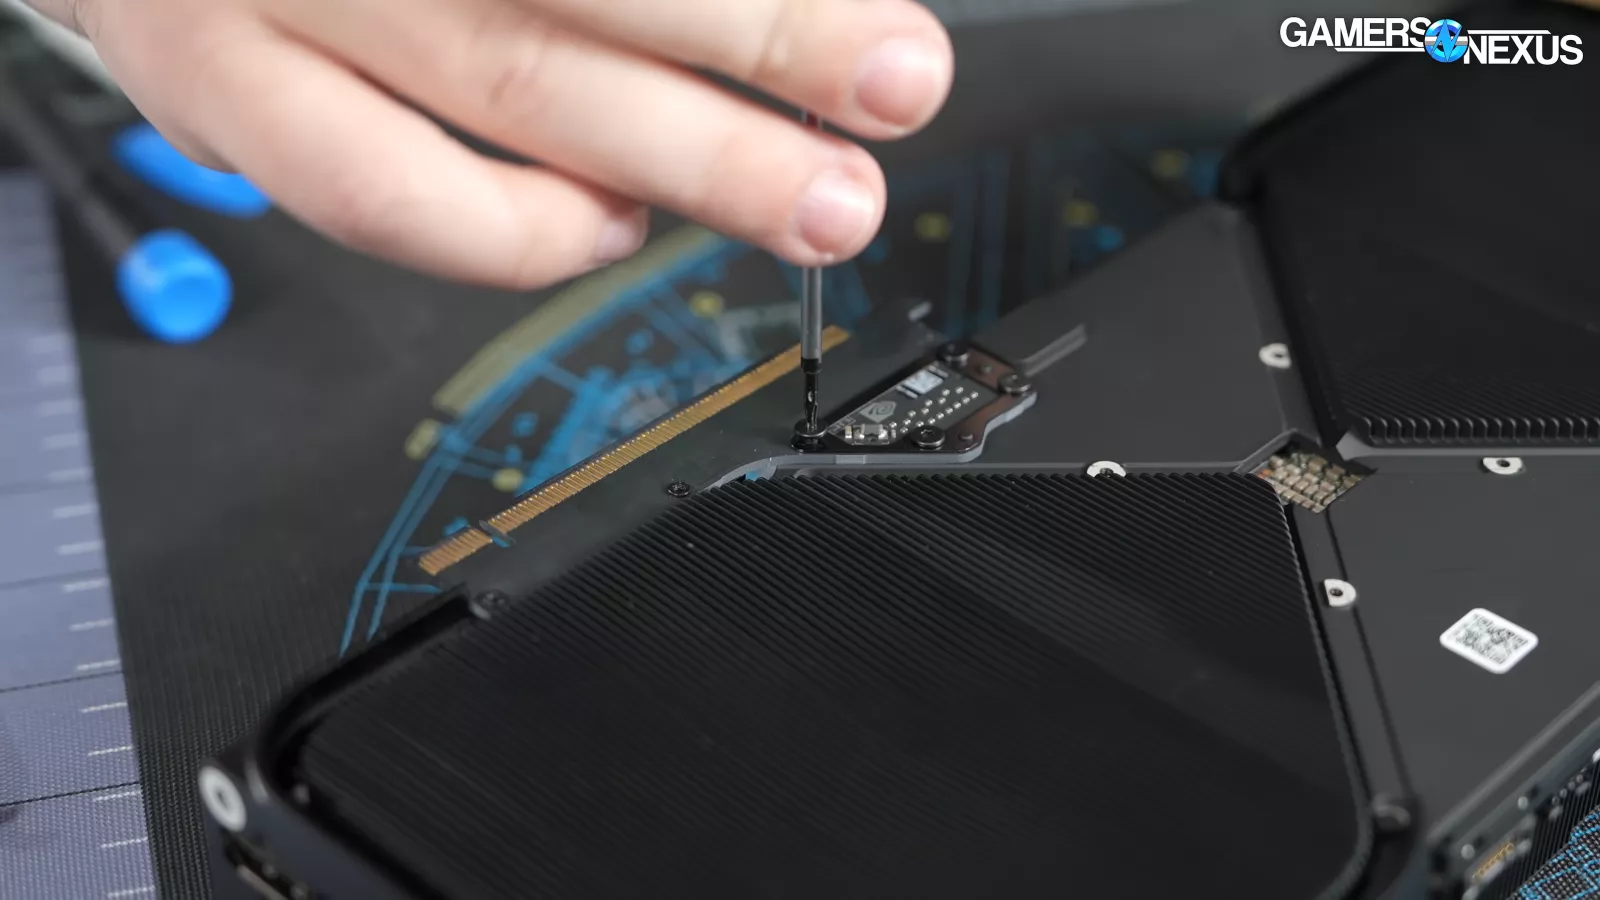
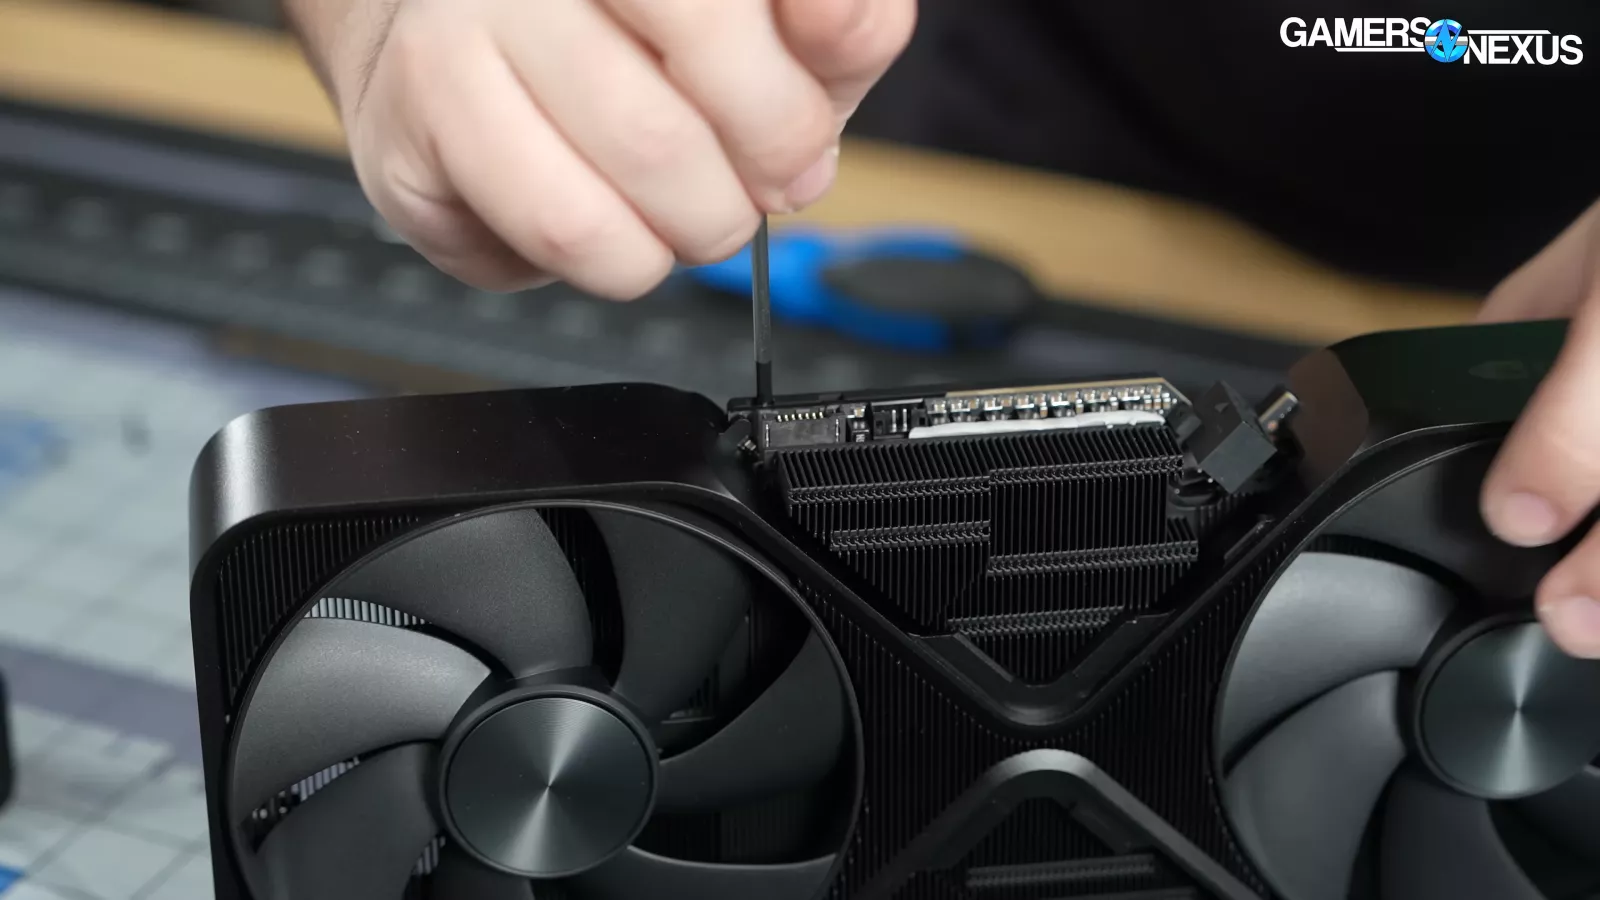
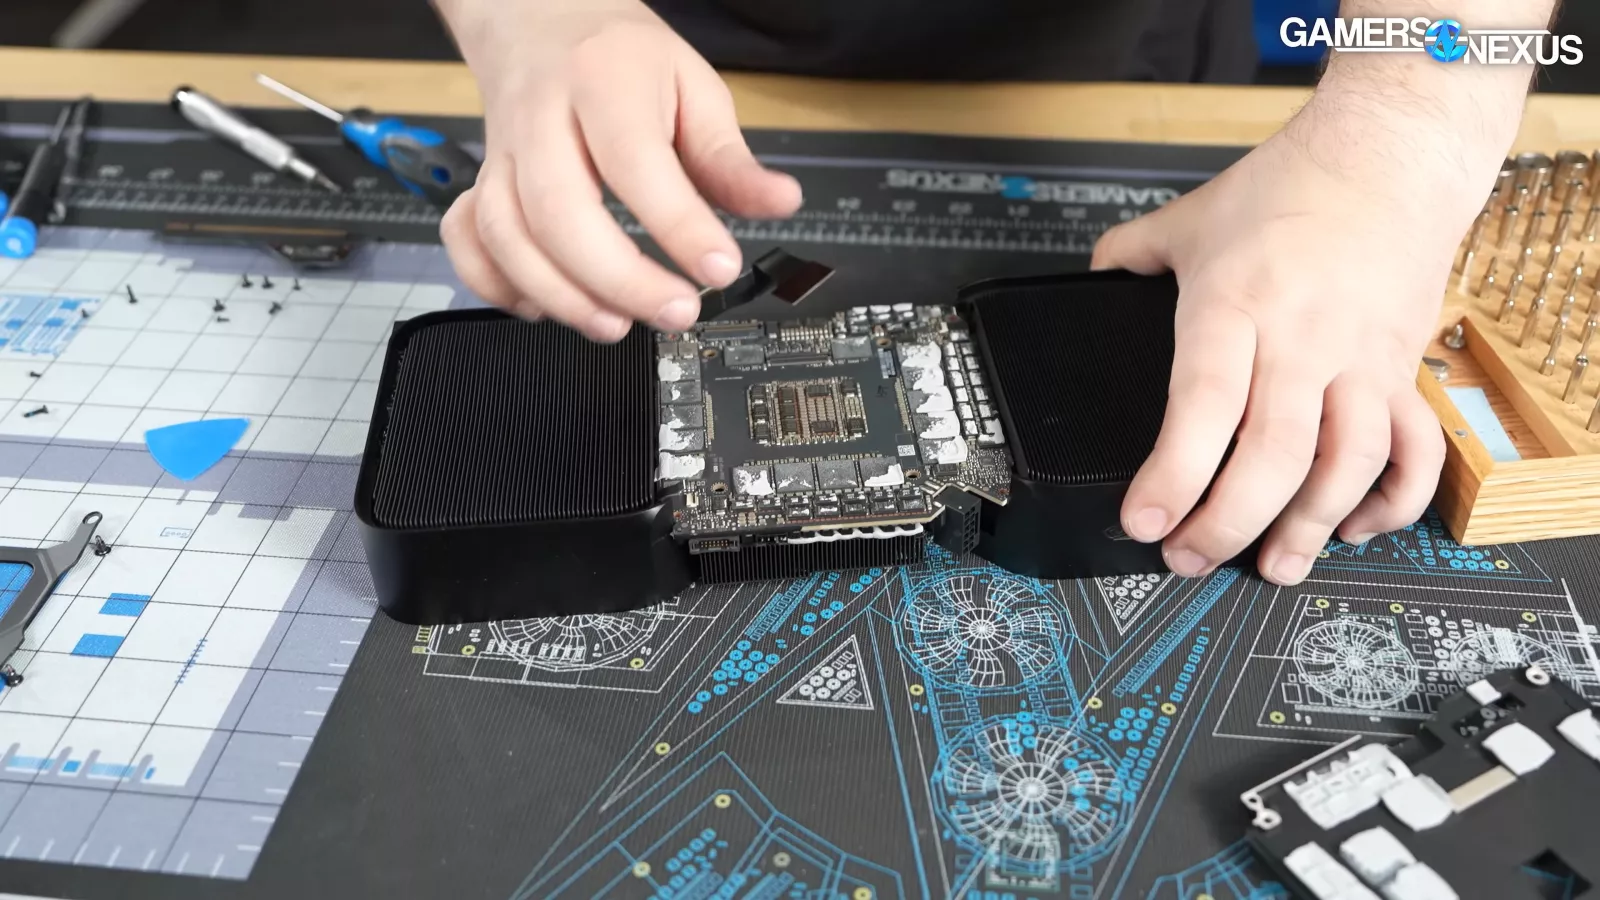
Starting disassembly, we removed the card’s back plate. Then we removed a single screw, which allowed us to pull off the card’s exterior frame.
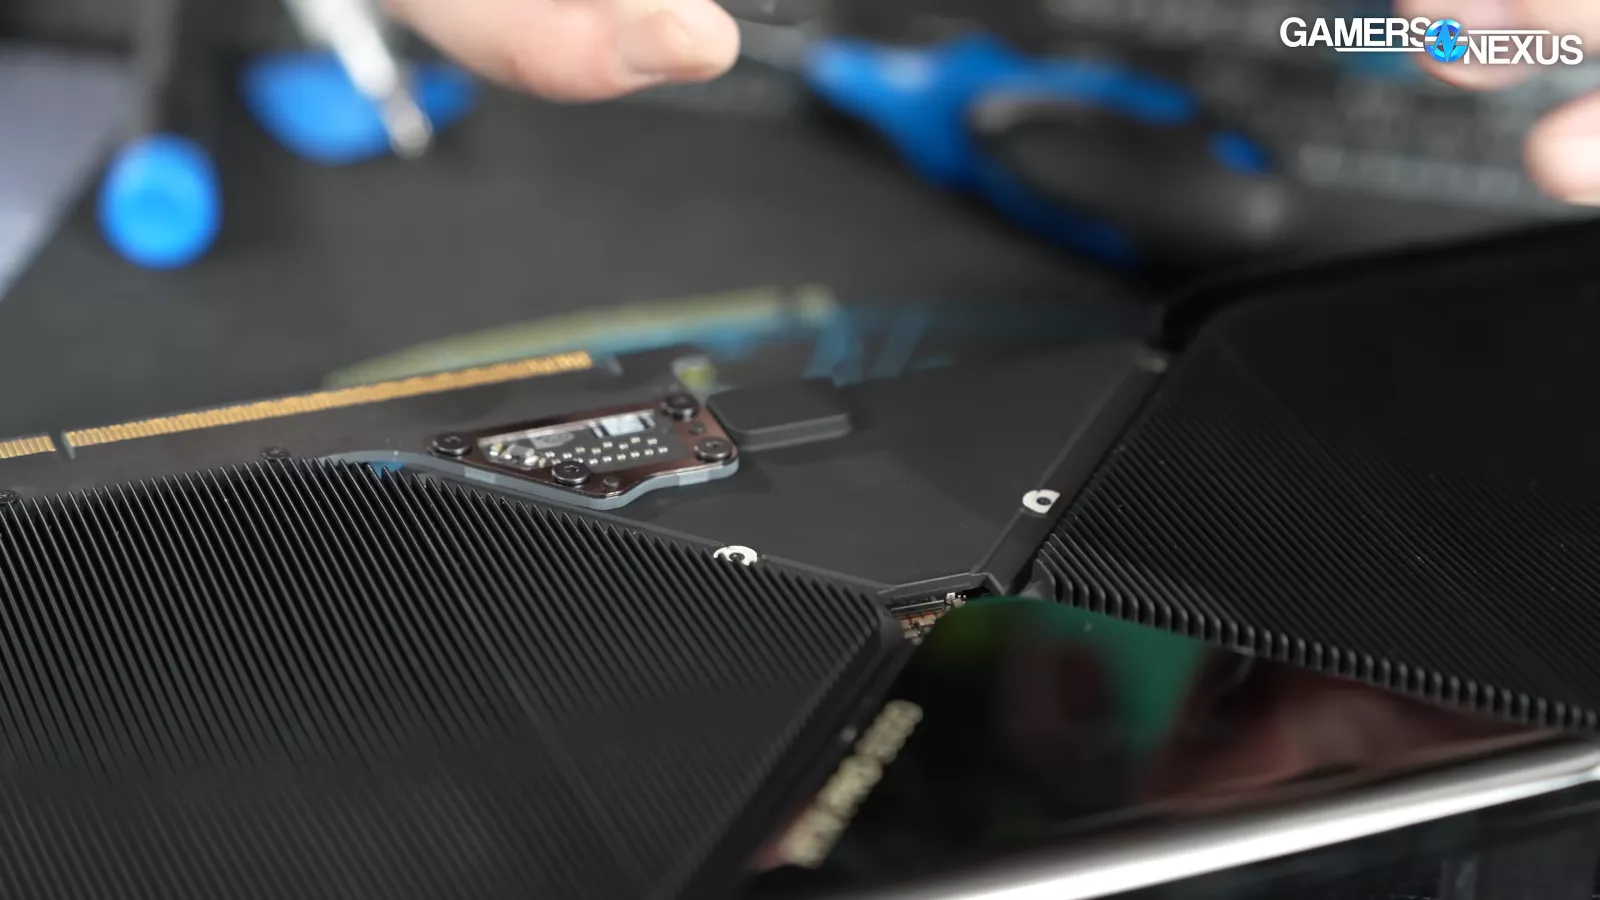
From here, we removed some screws around the center of the card to remove the center covers. Doing this reminded us of how masterful the mechanics of the FE design is. It’s assembled really well, it’s easy to take apart, and there’s no mechanisms to try and prevent disassembly.
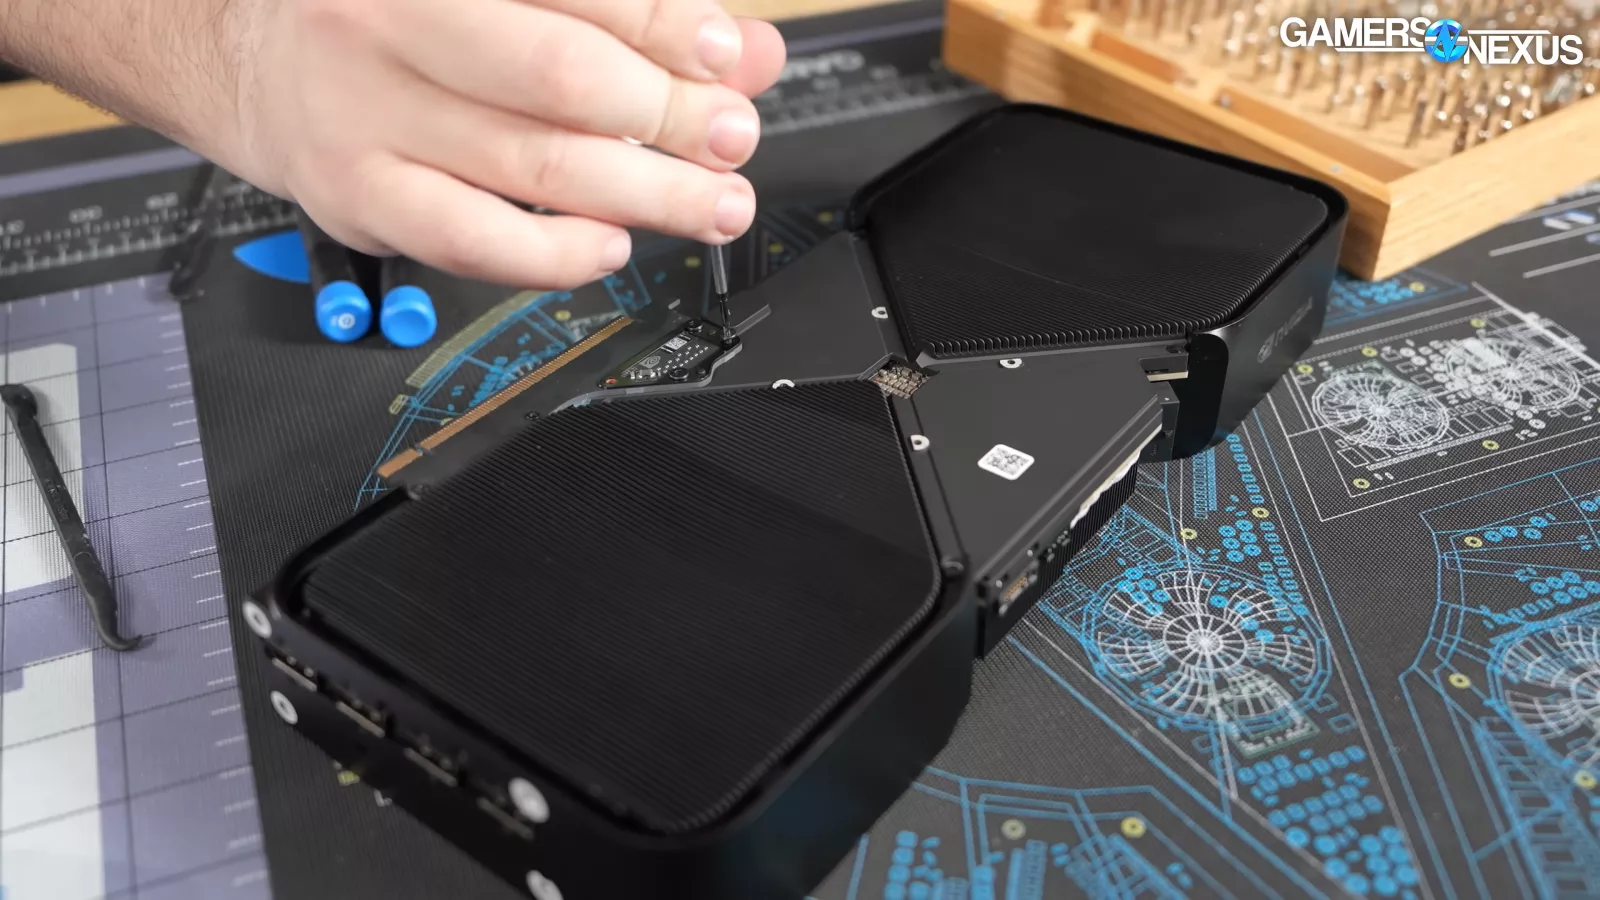
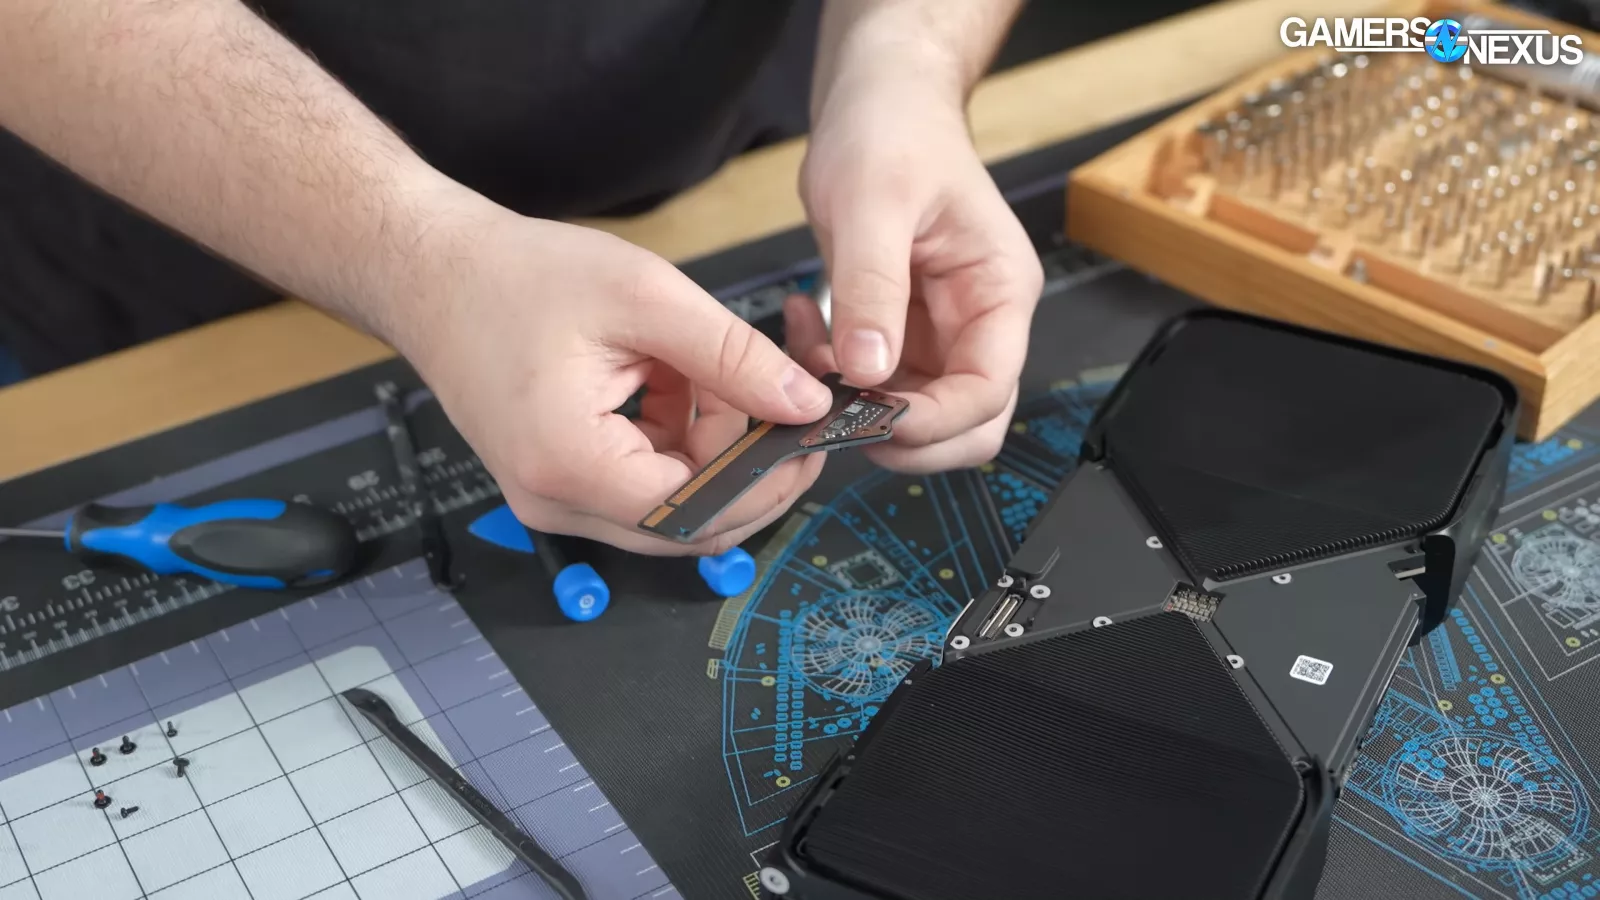
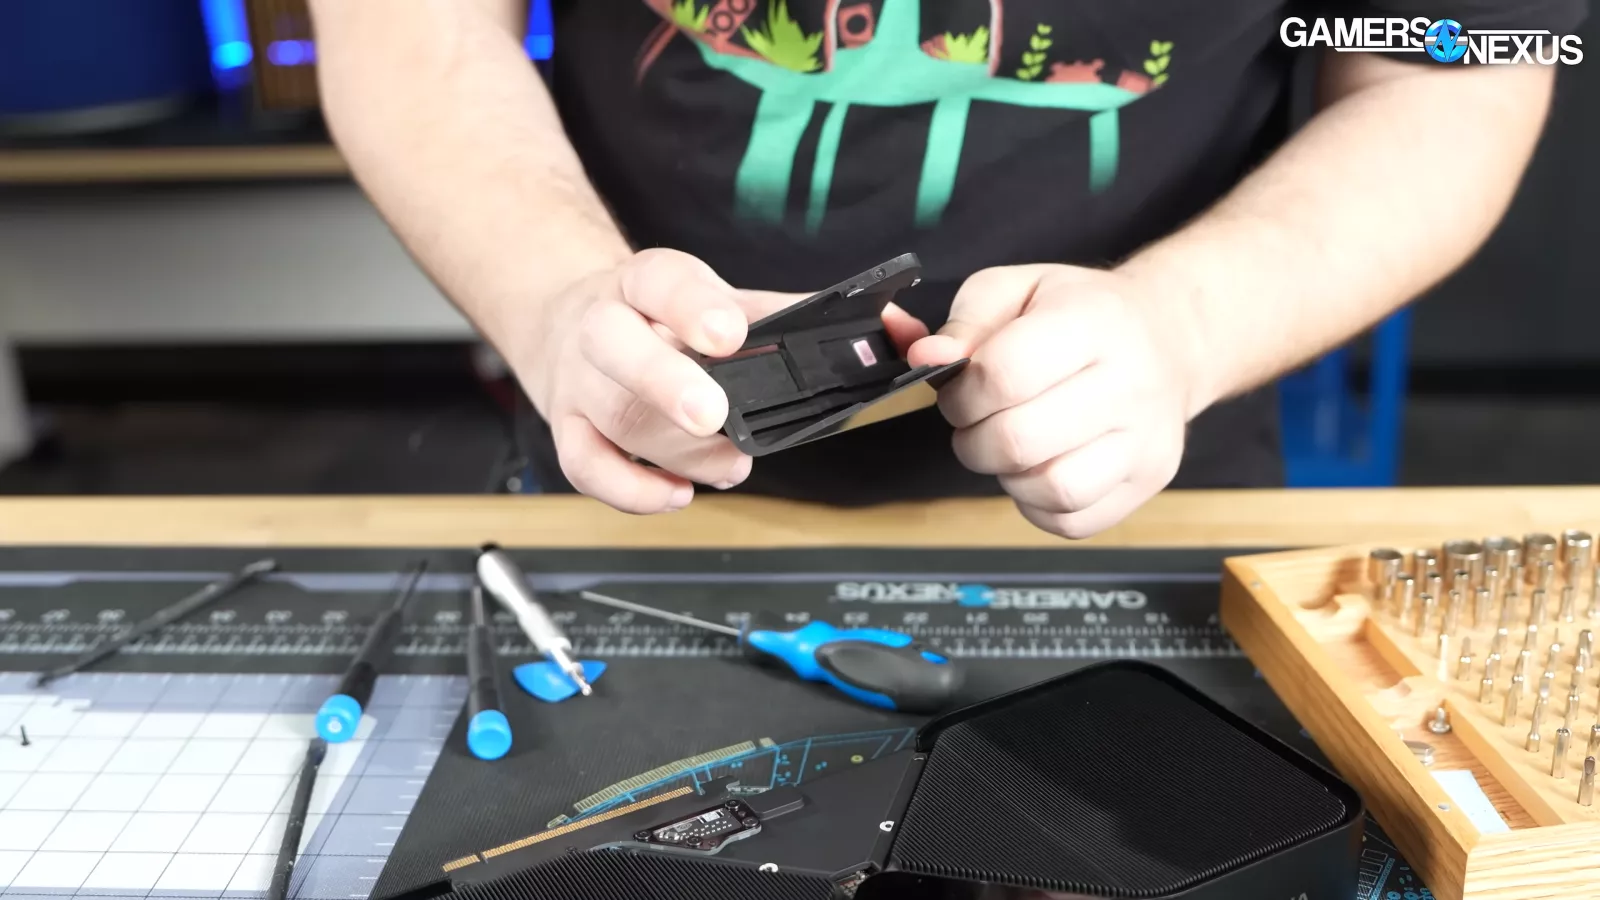
Next, we unscrewed the clamp that holds the PCIe slot to the card.
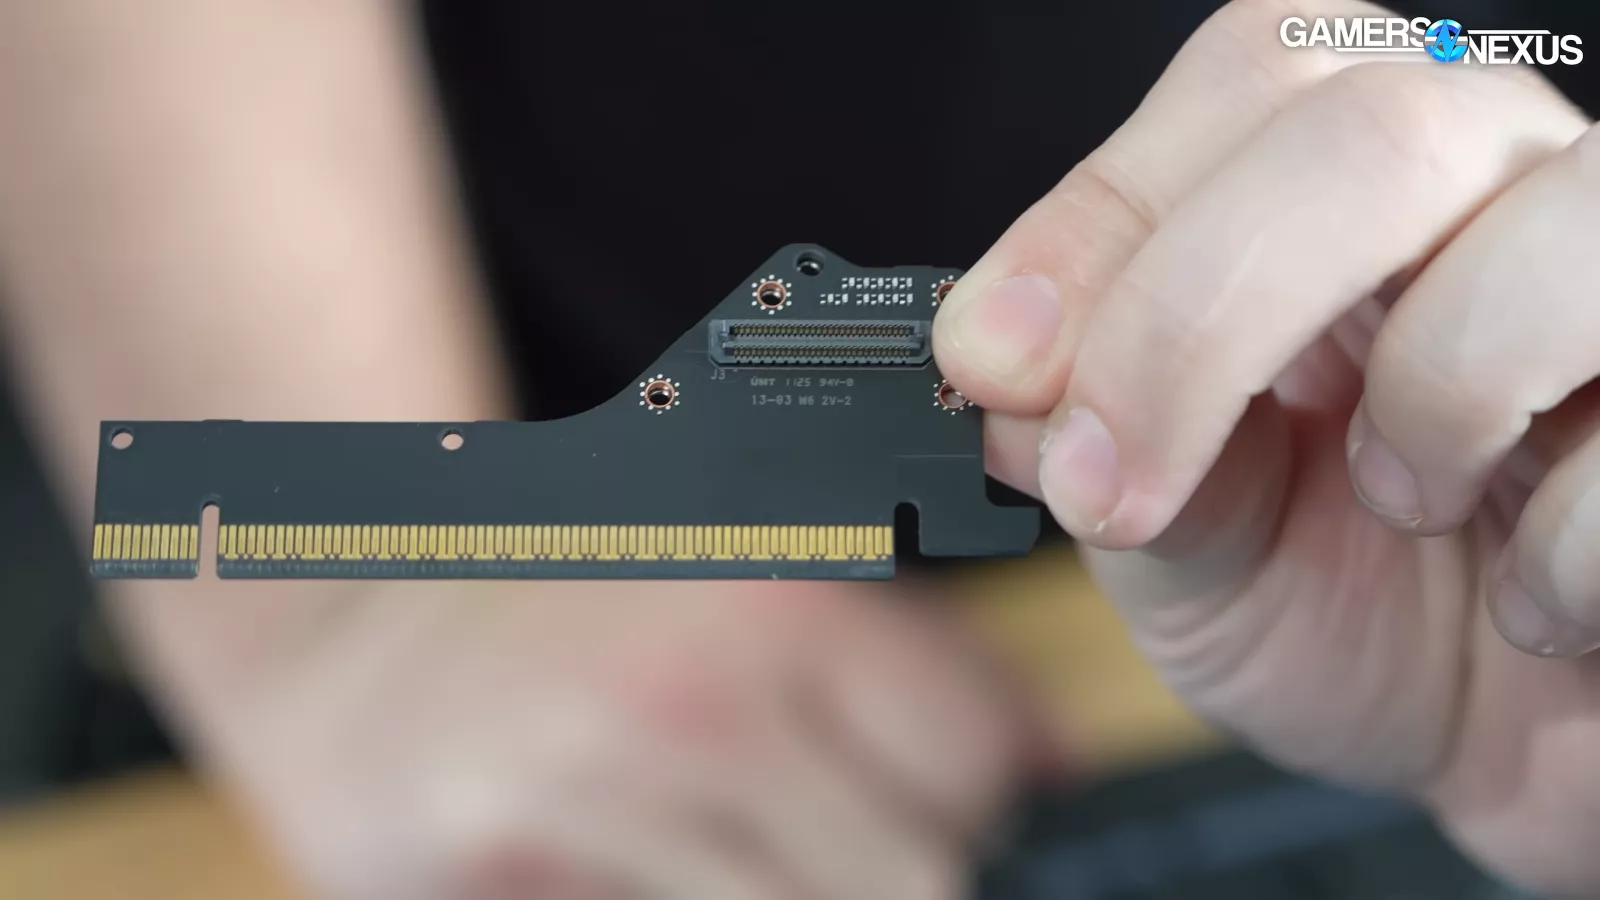
Here’s a close look at the removed PCIe adapter.
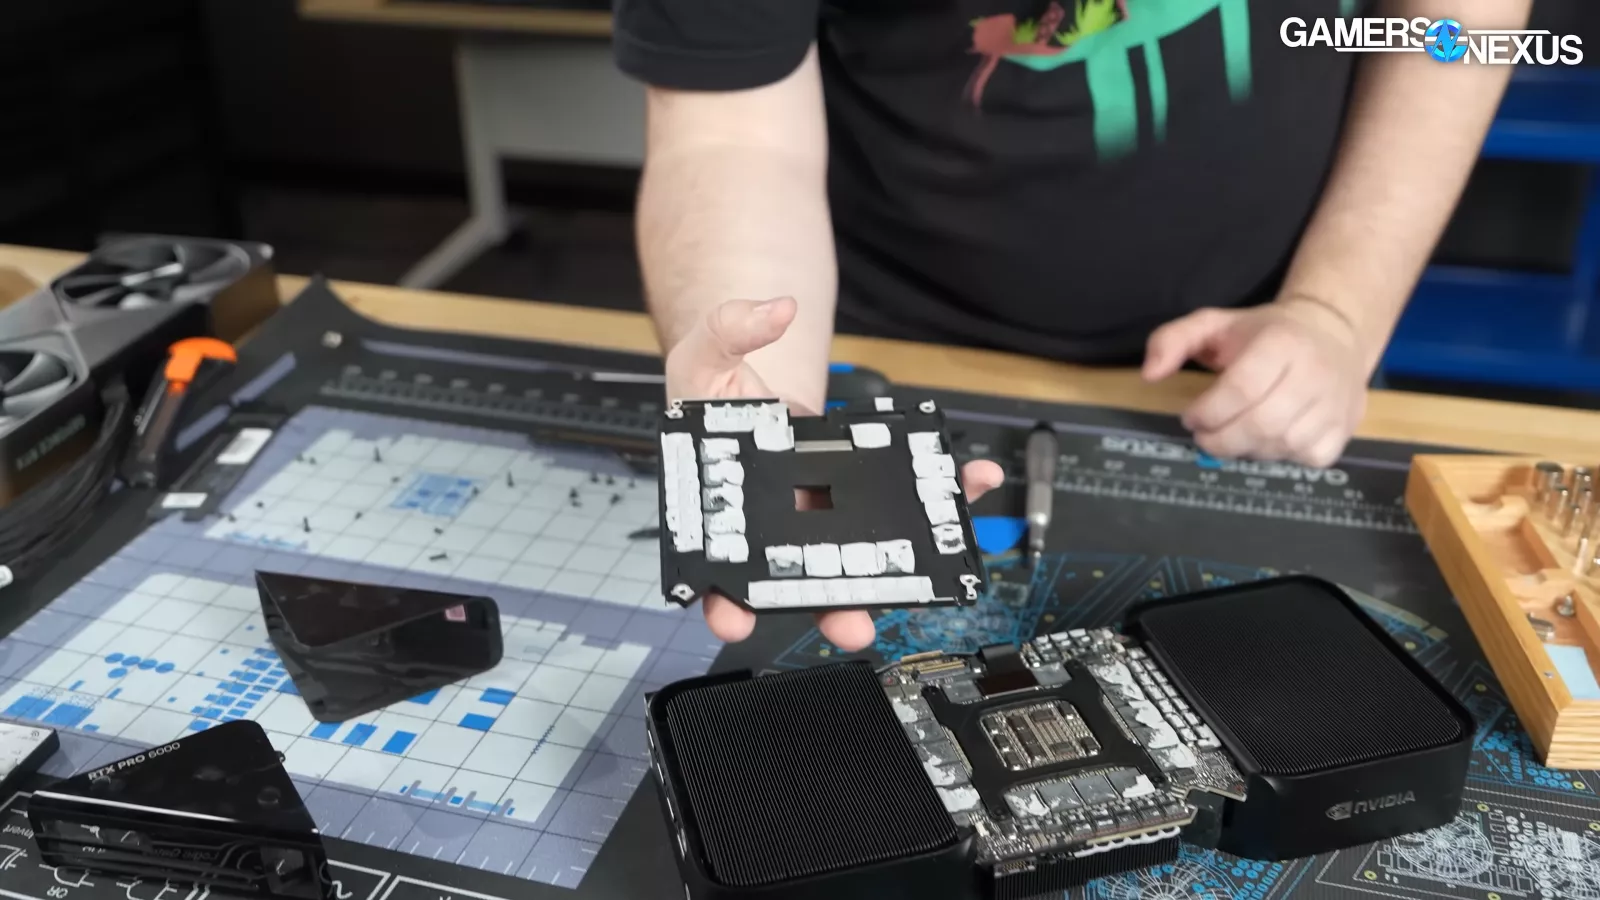
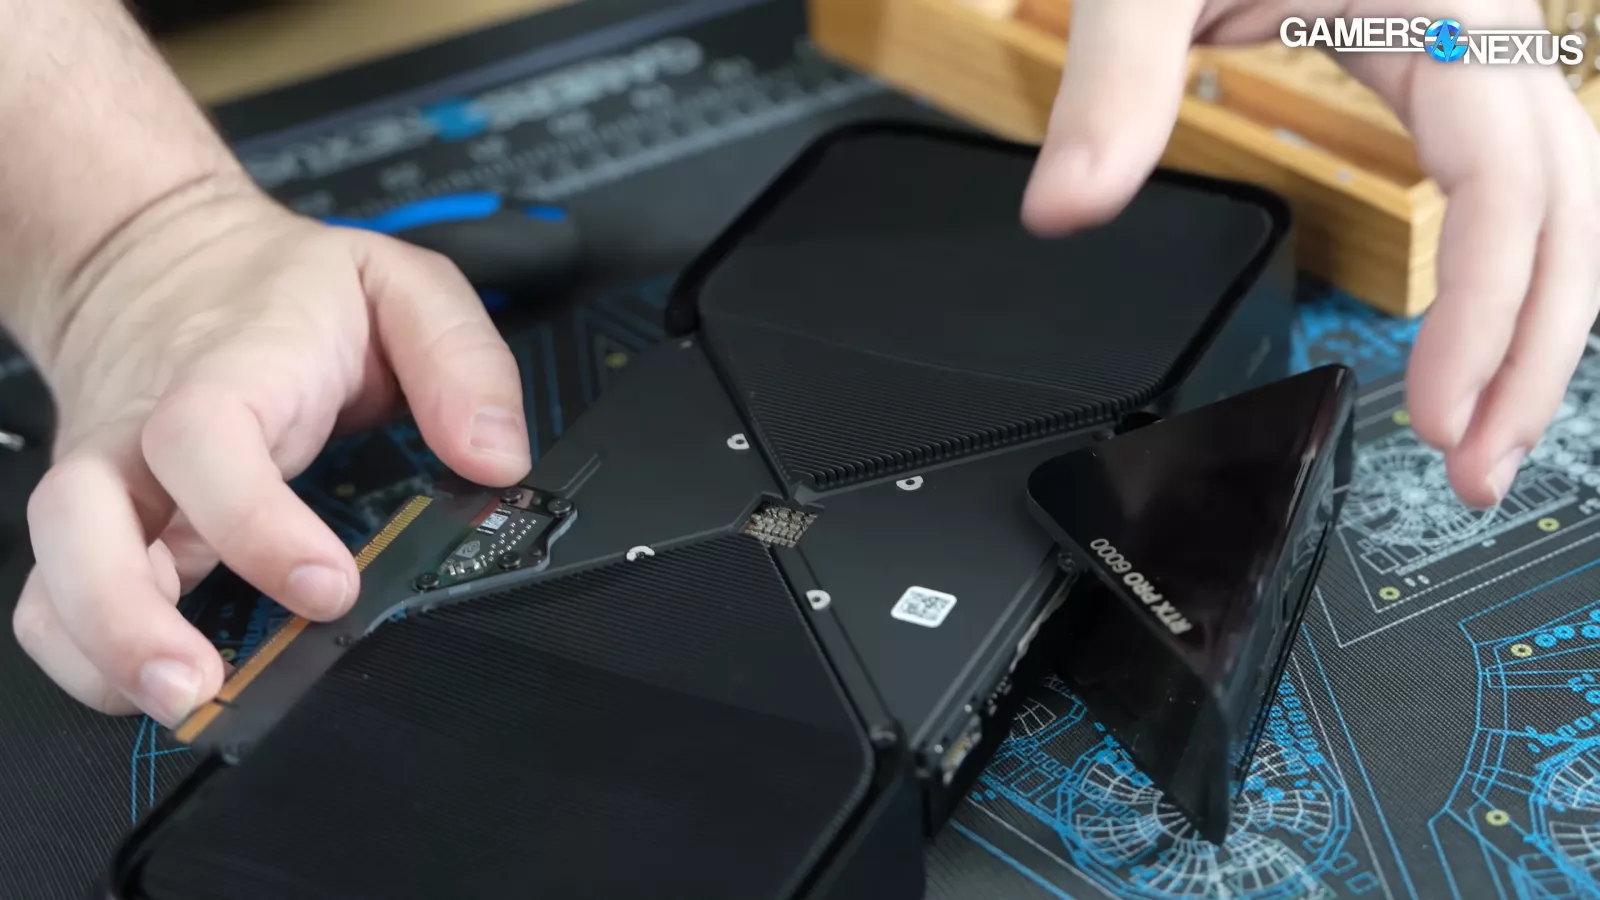
From here, we pried a plate off of the card, exposing the PCB.
This gave us our first look at where the memory is connected. We counted 16 memory modules on the back with the clay type of thermal pads.
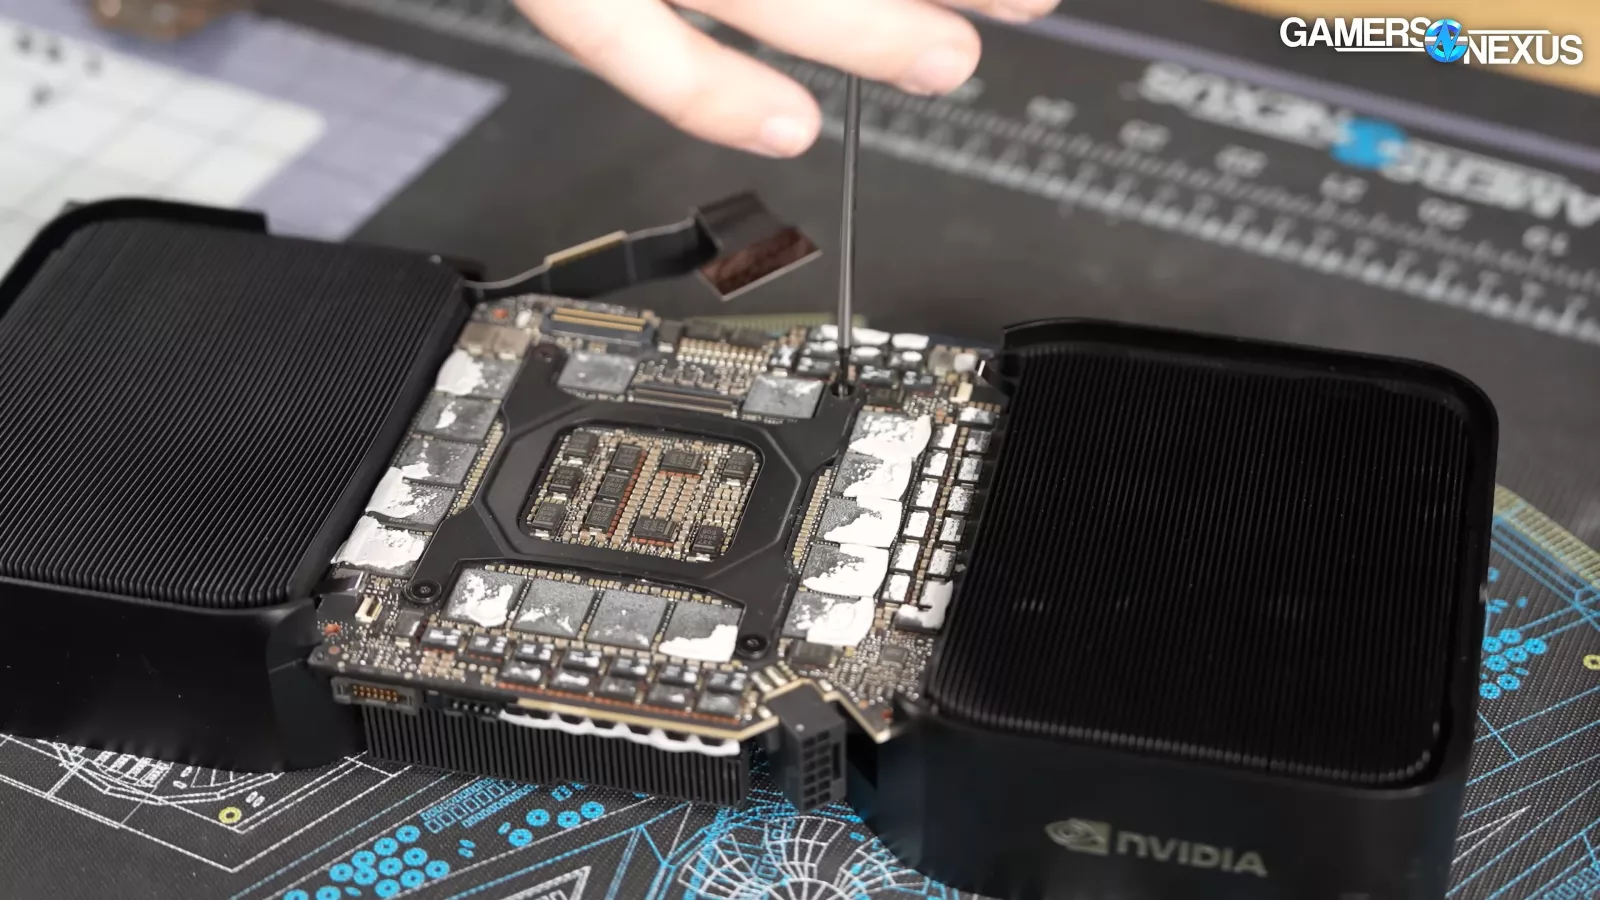
The PCB is crazy dense, which is an engineering challenge.
We then proceeded to remove ribbon cables and screws to the leaf spring to access the GPU.
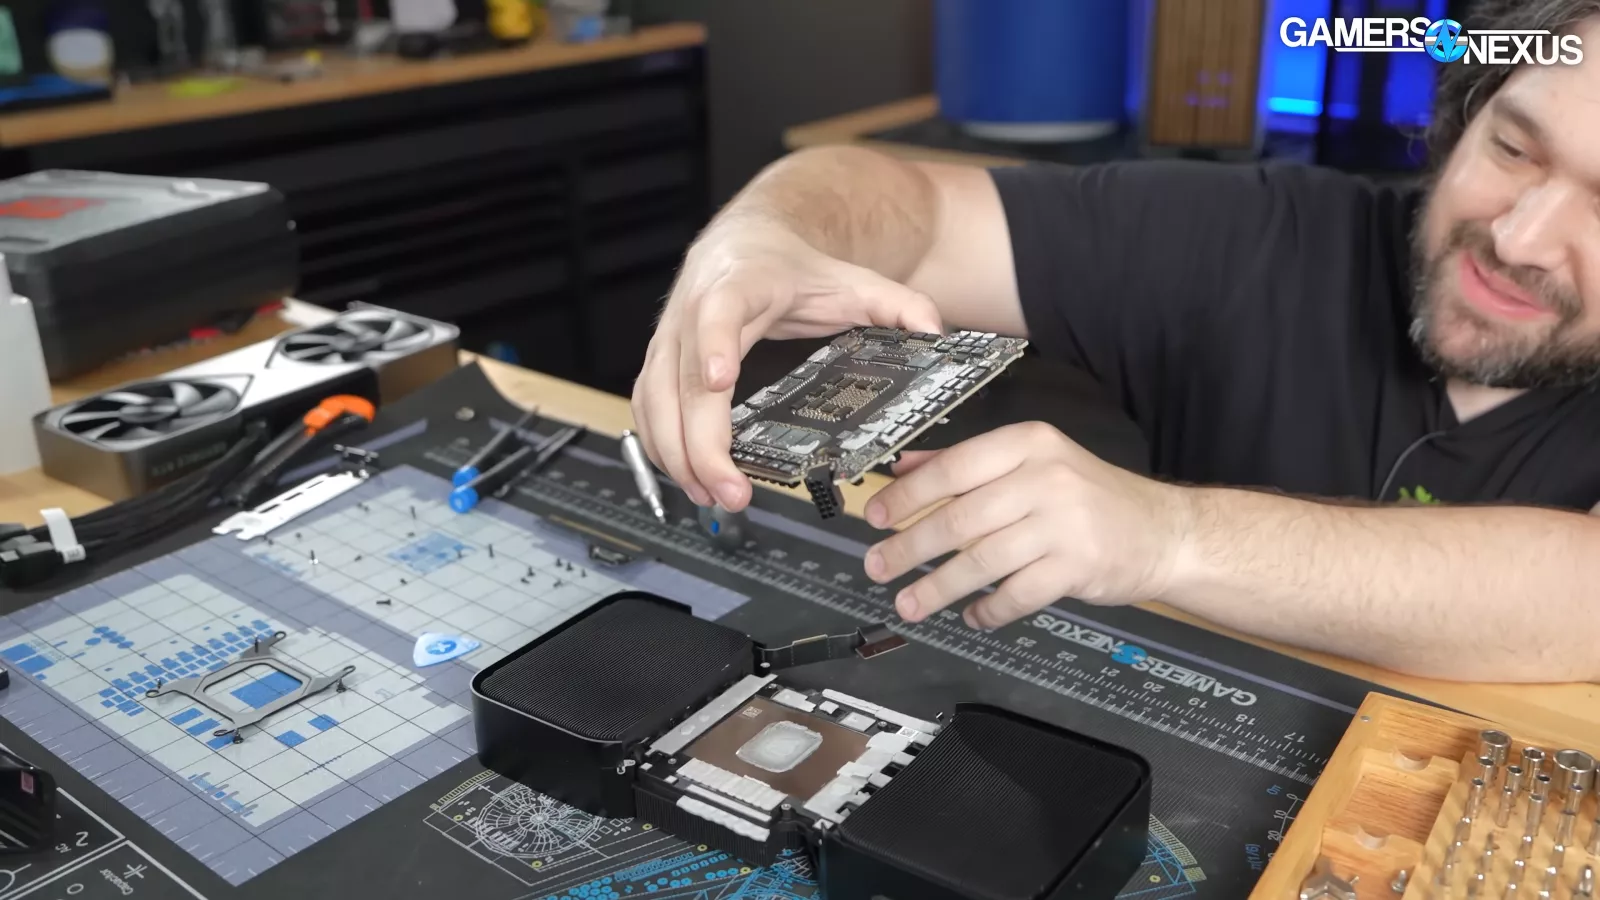
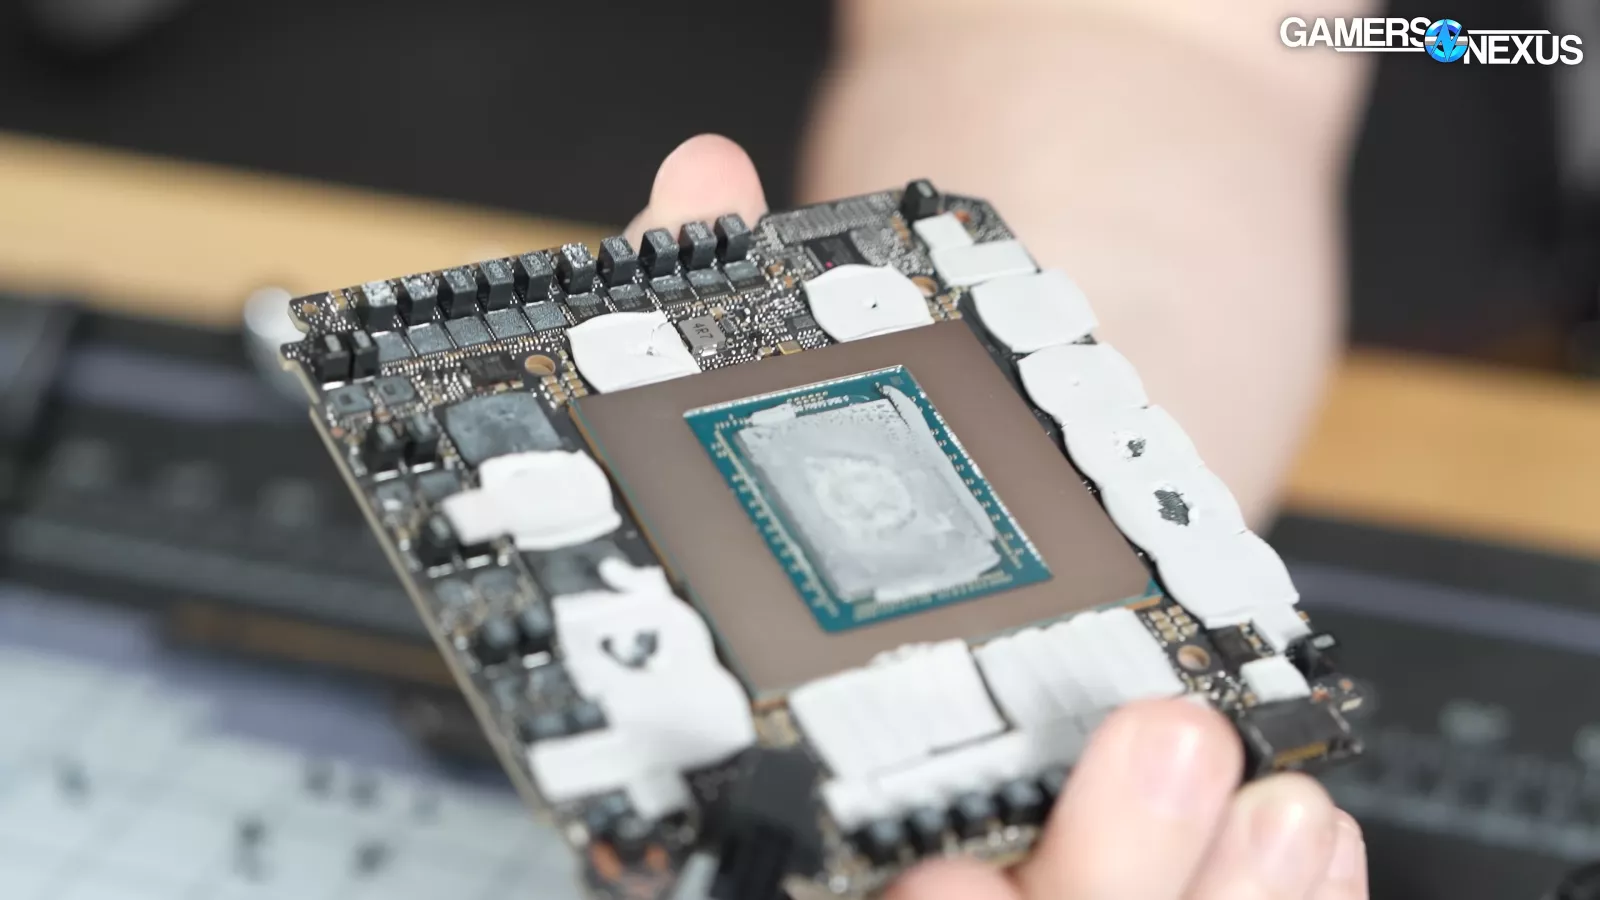
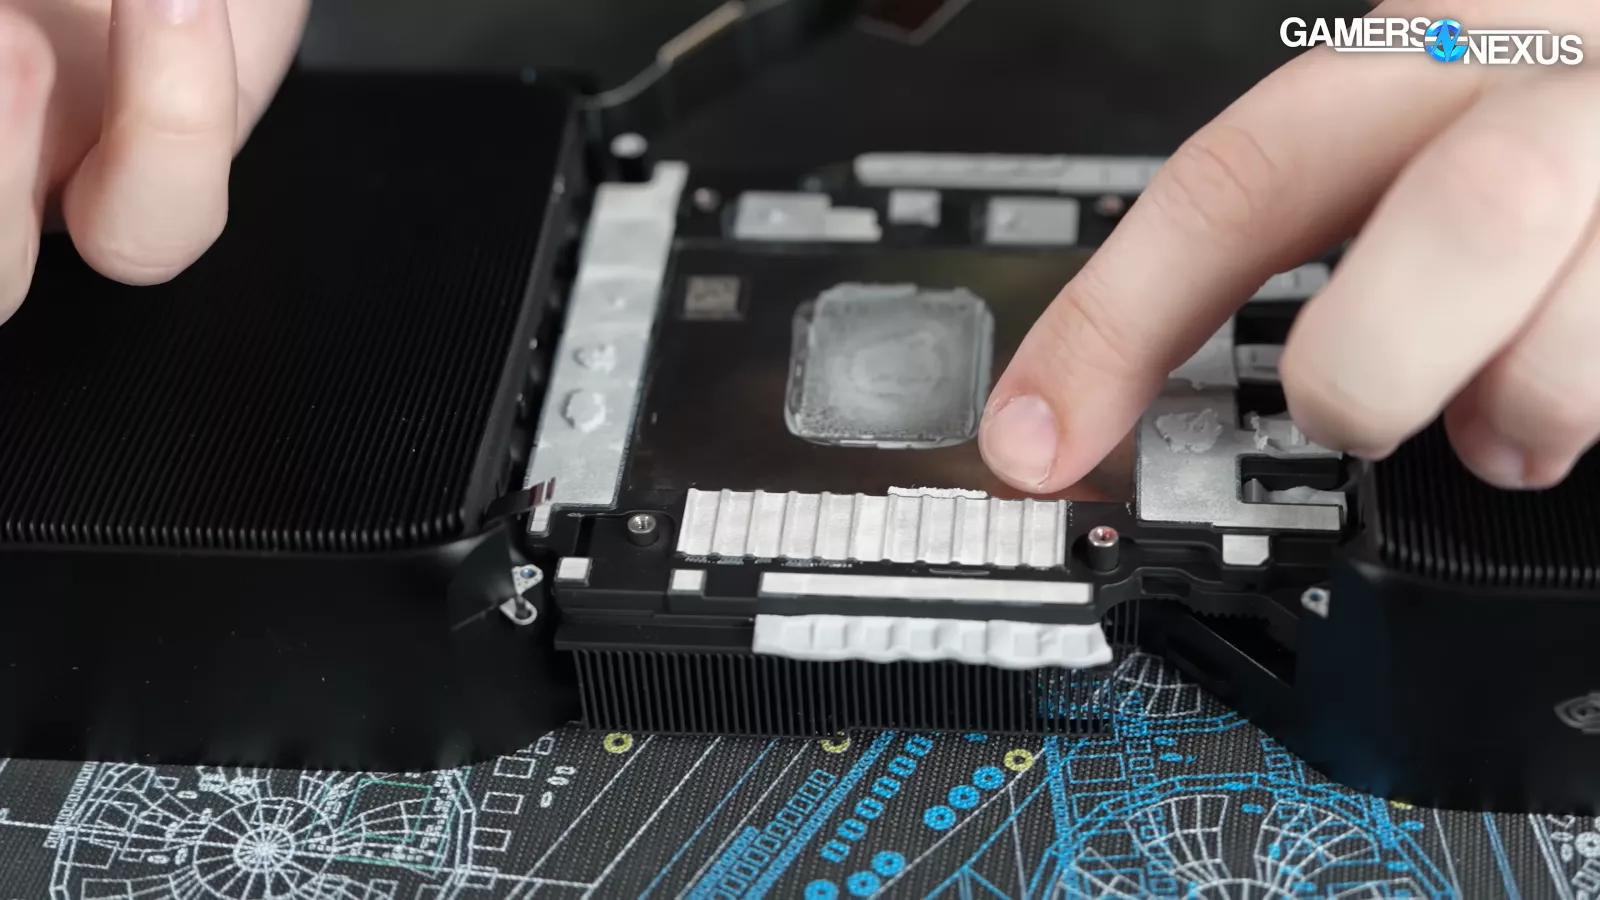
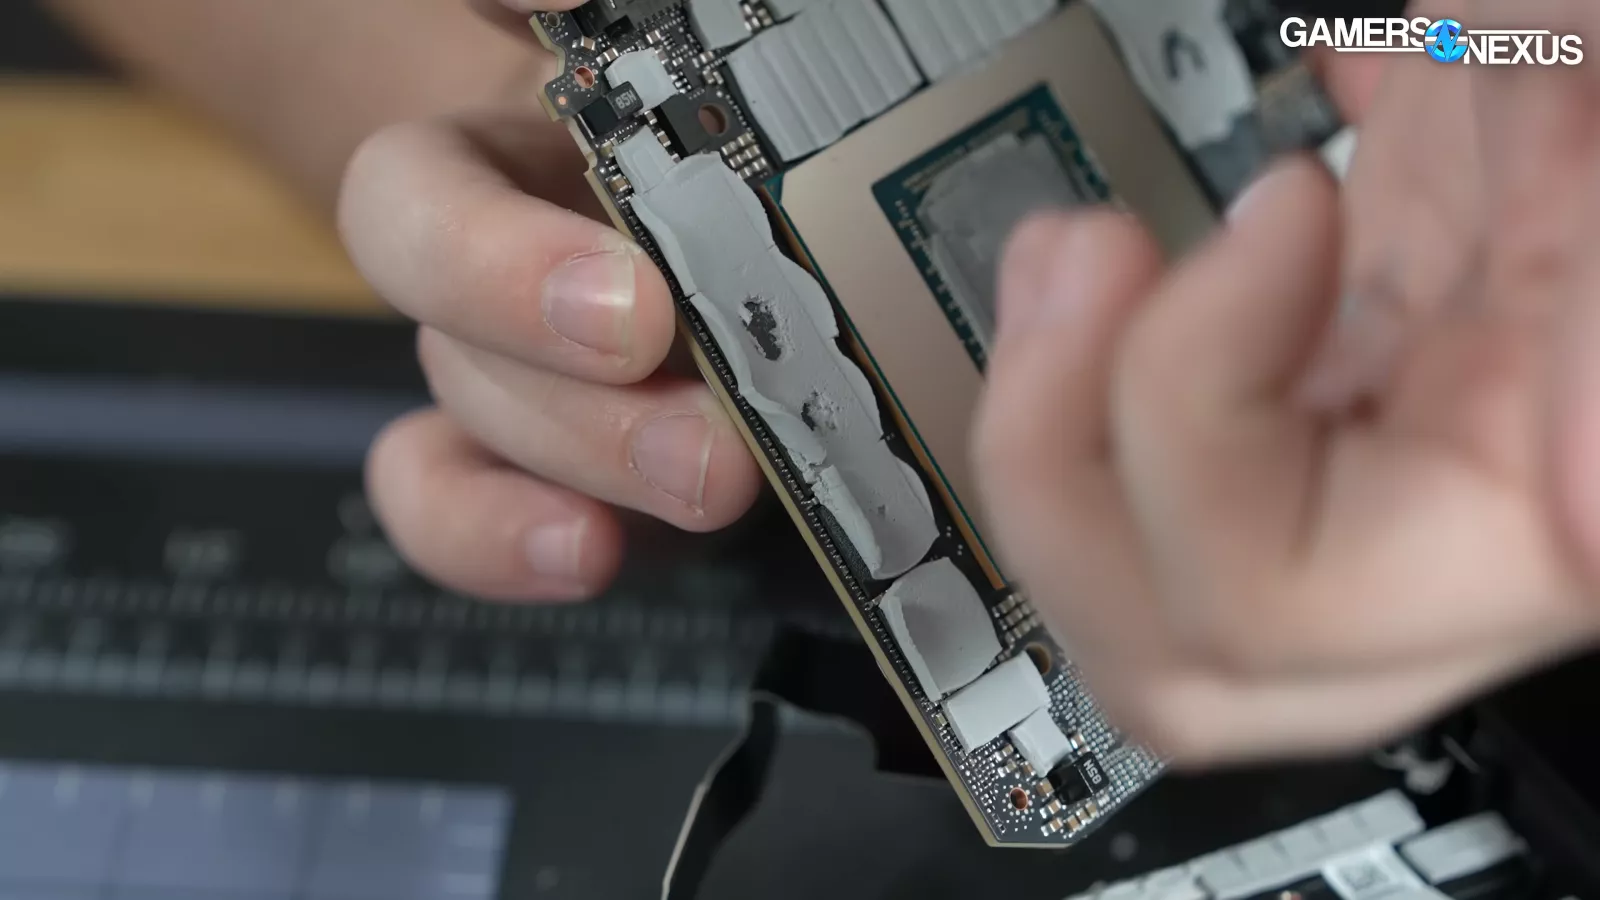
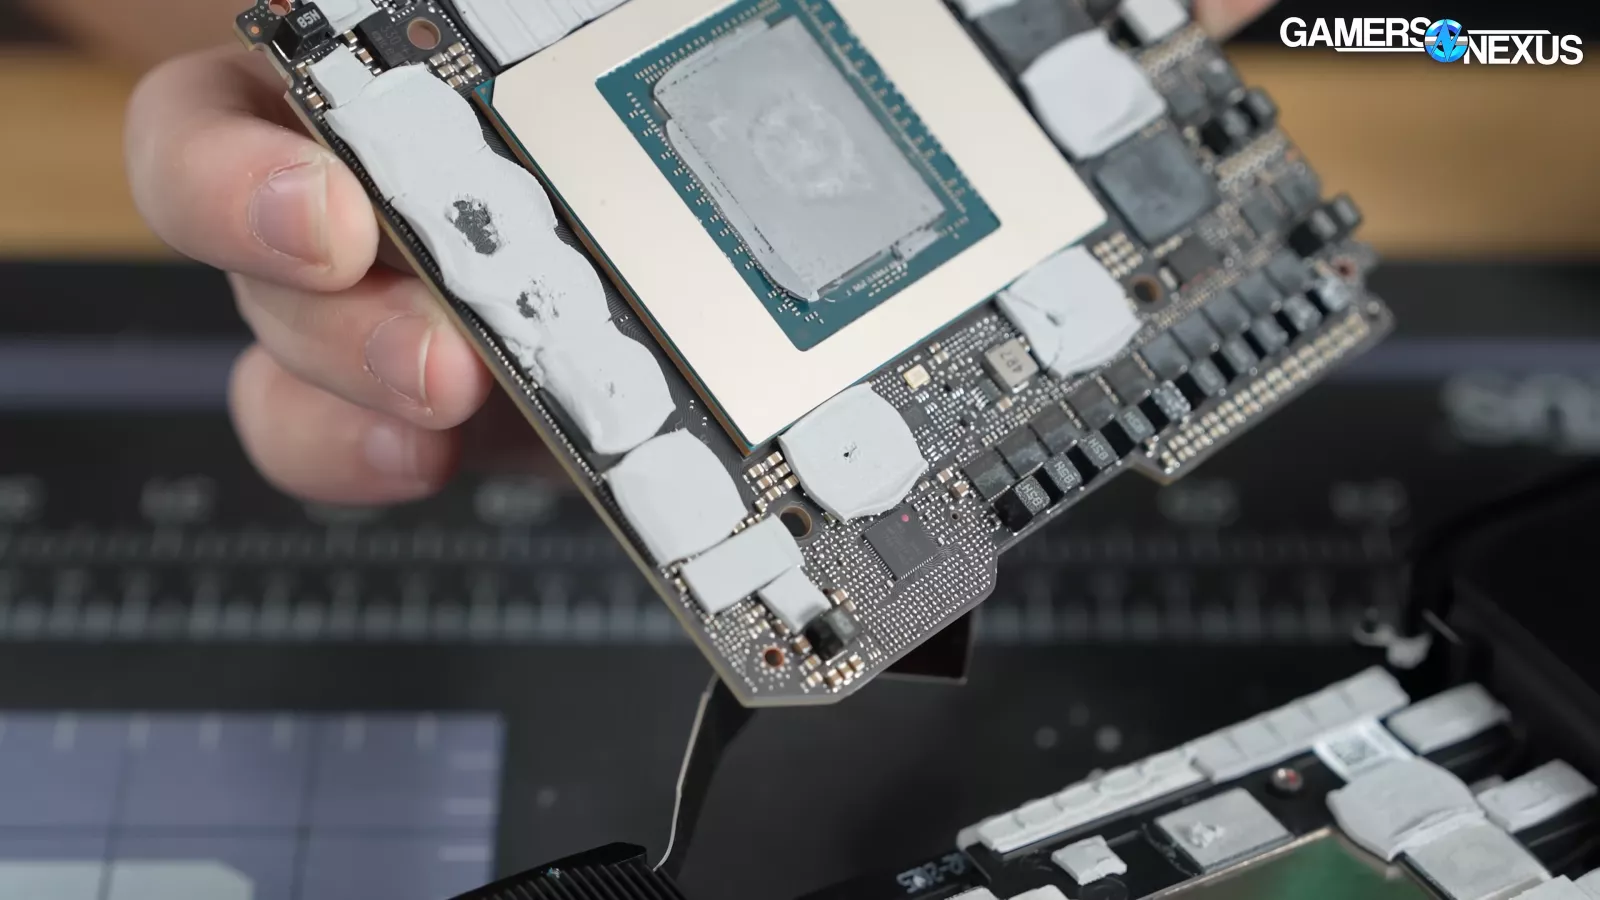
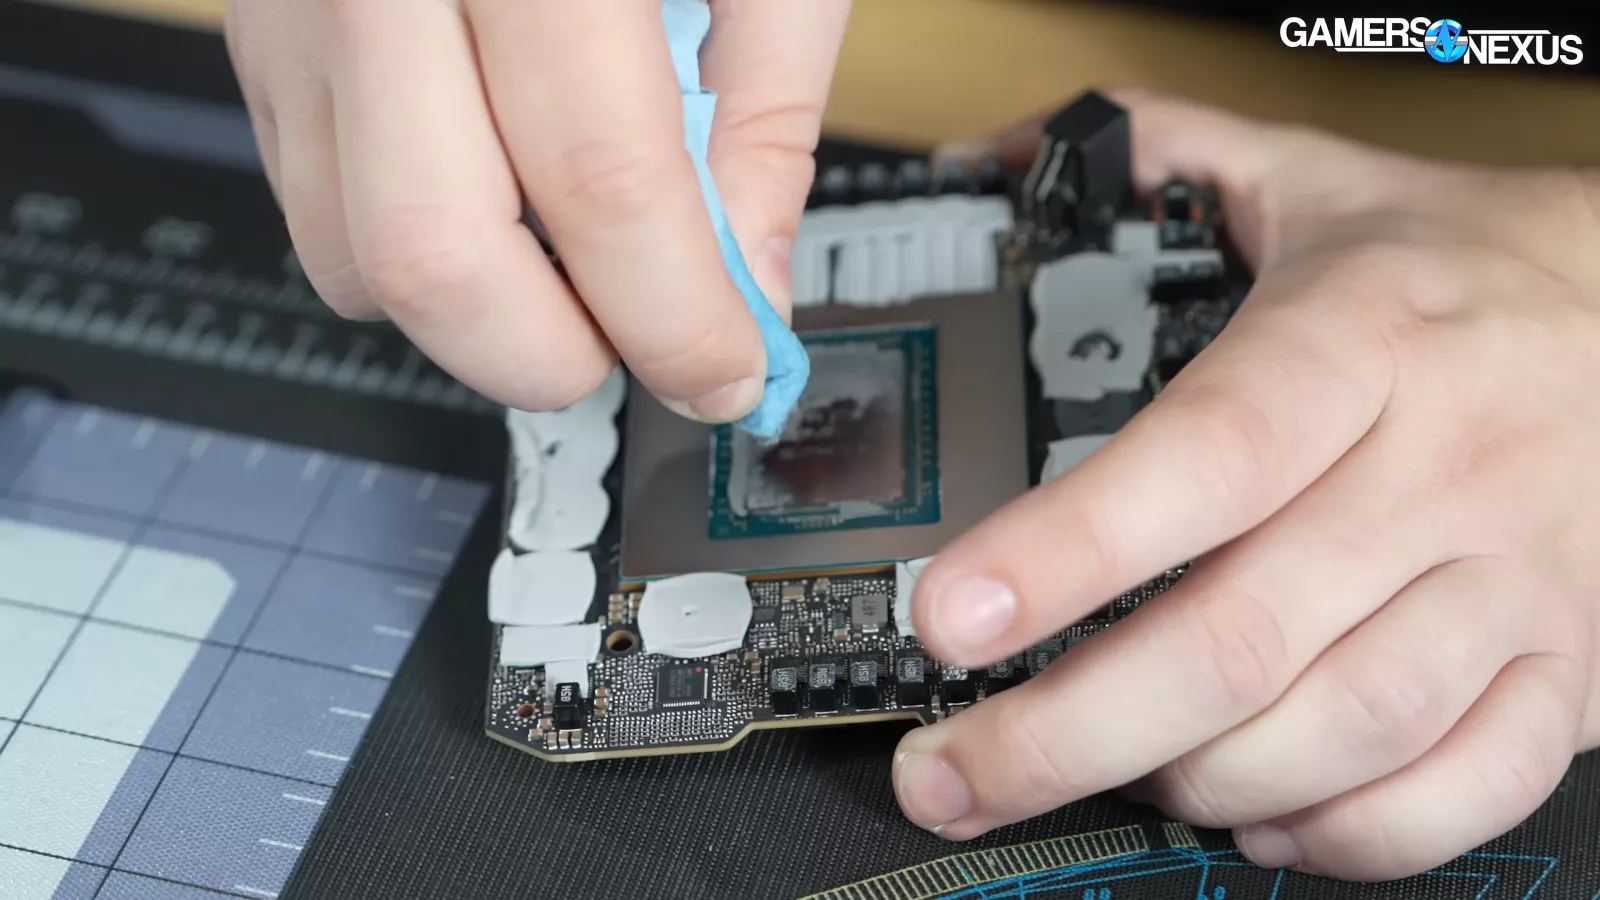
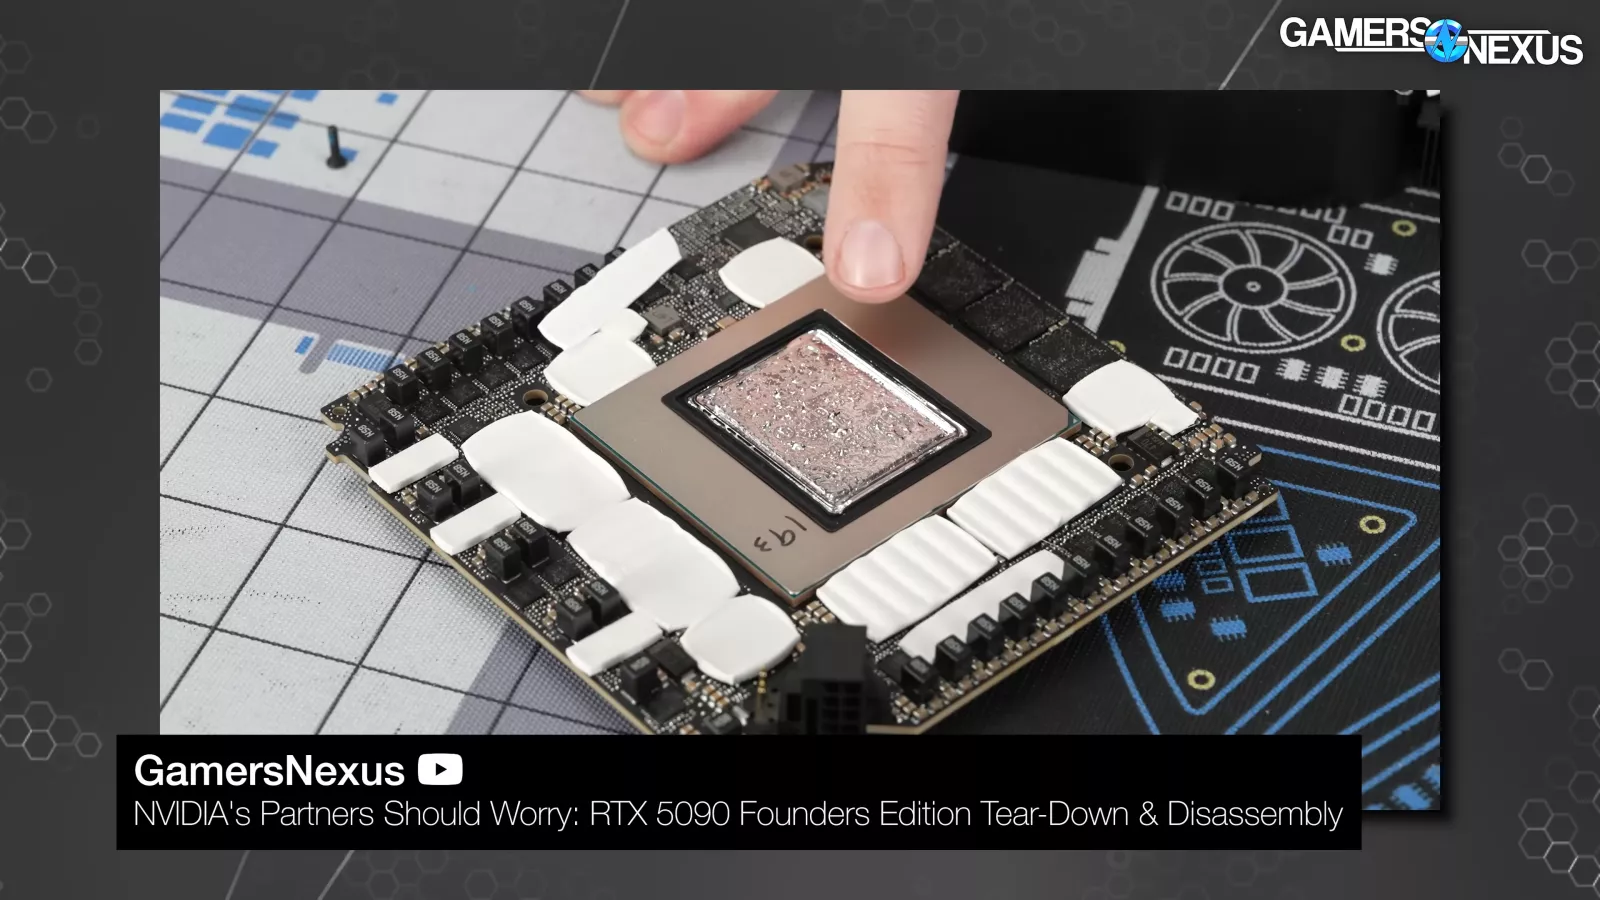
Pulling off the PCB, we were expecting to see liquid metal, but we saw thermal paste instead. We really weren’t expecting that. We also saw a massive GPU substrate.
Upon removing the PCB, we noticed that 1 pad went over the edge a bit.
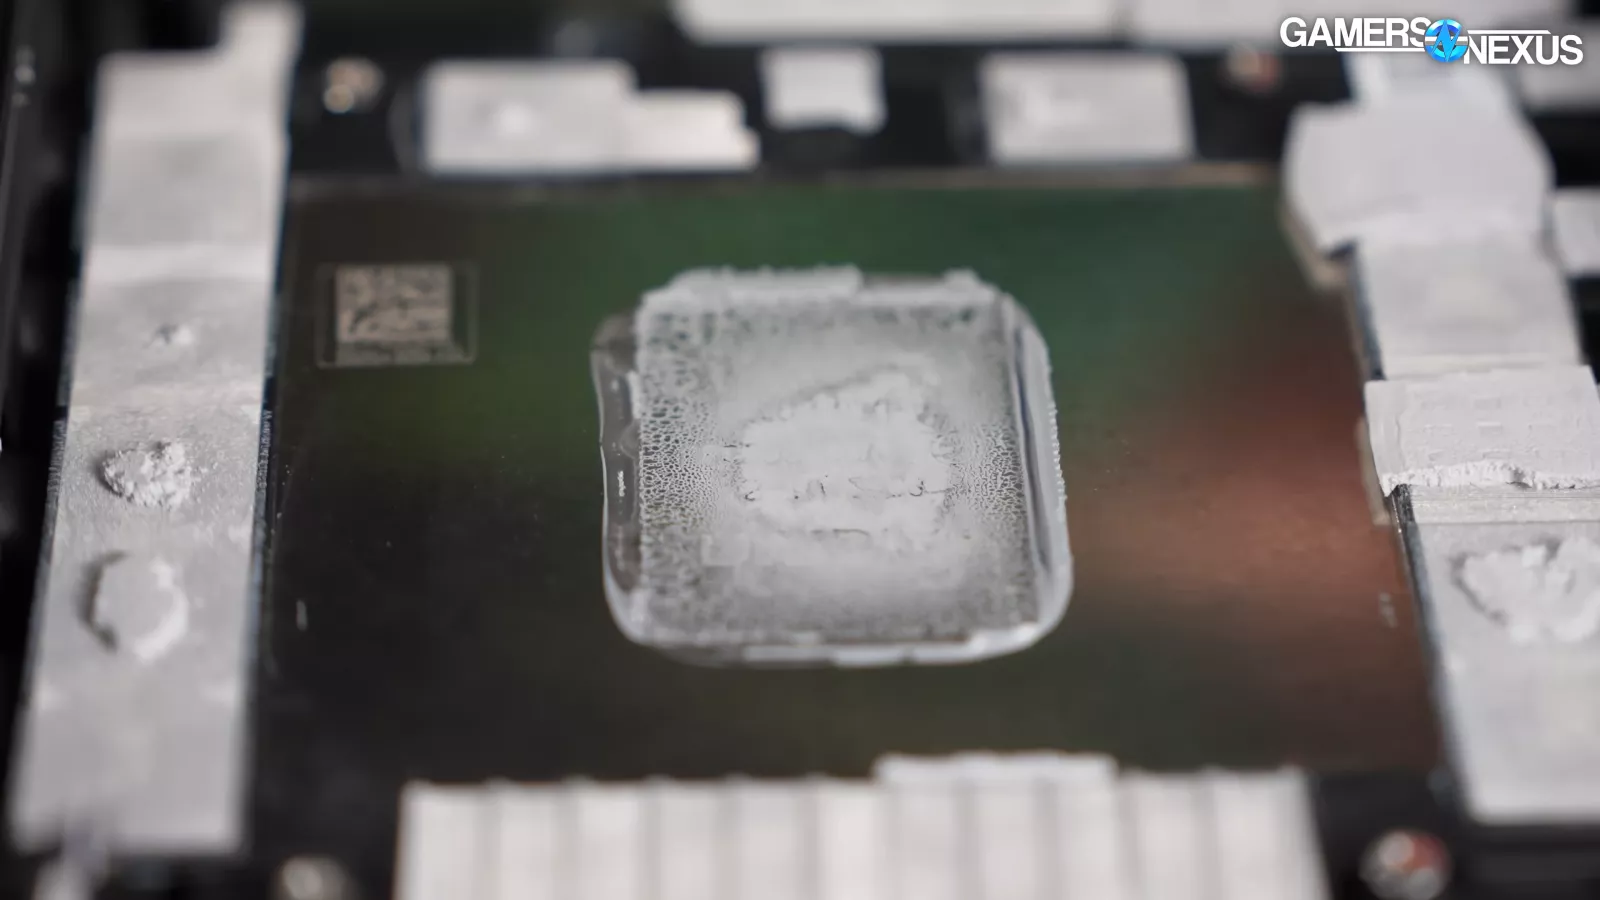
Analyzing the paste application pattern, it looked like the heaviest imprint was right in the center with lighter pressure on the outer edges, which is fine.
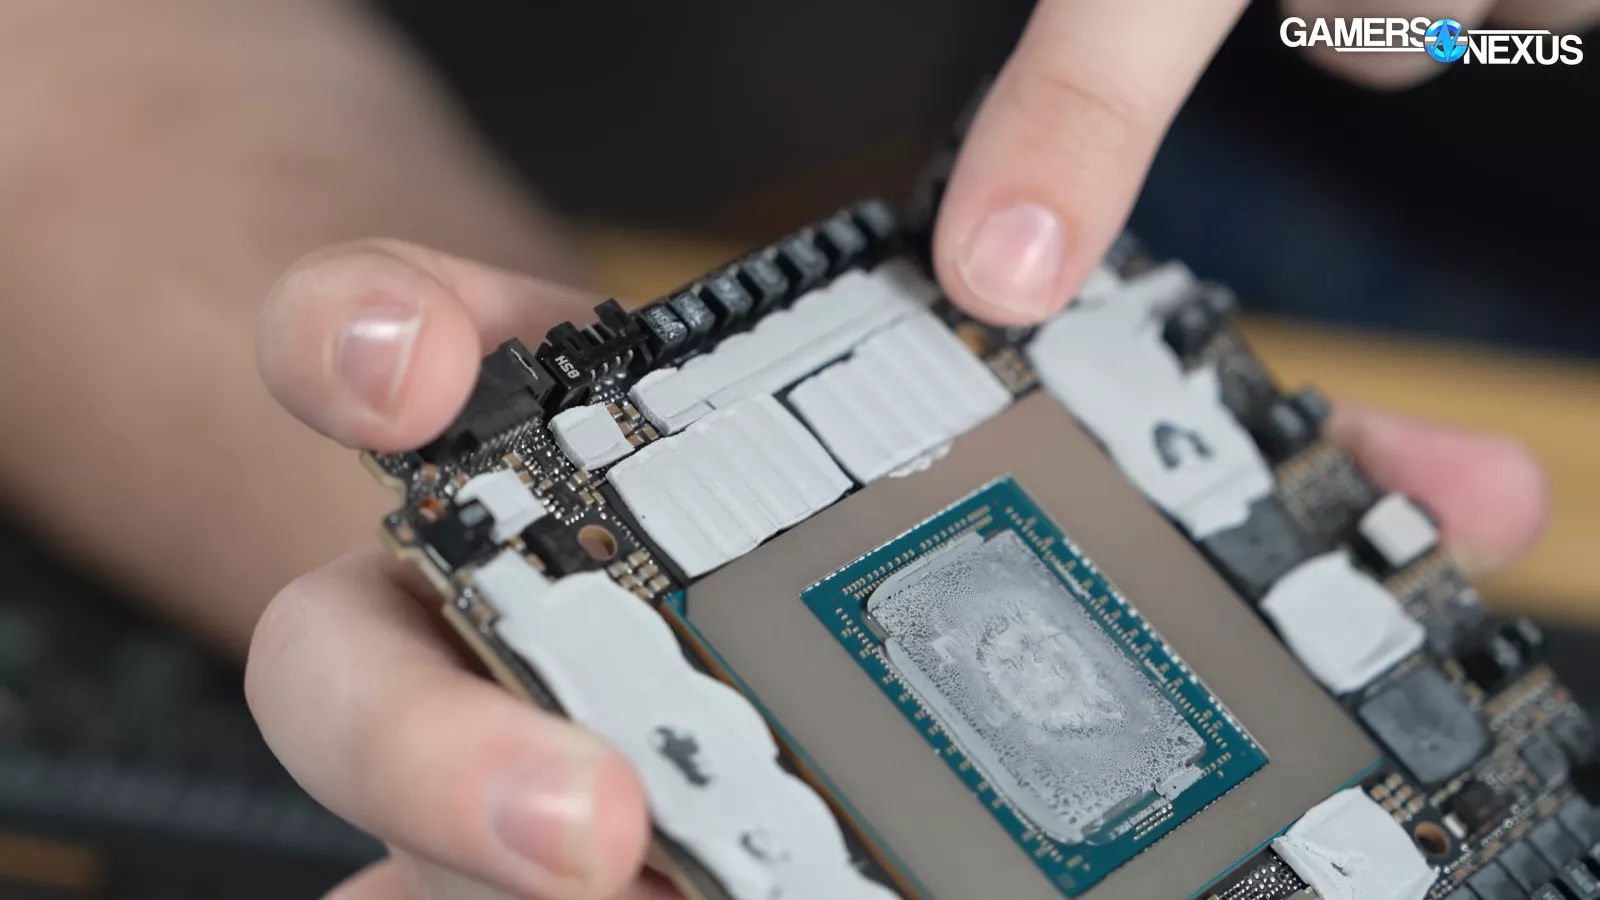
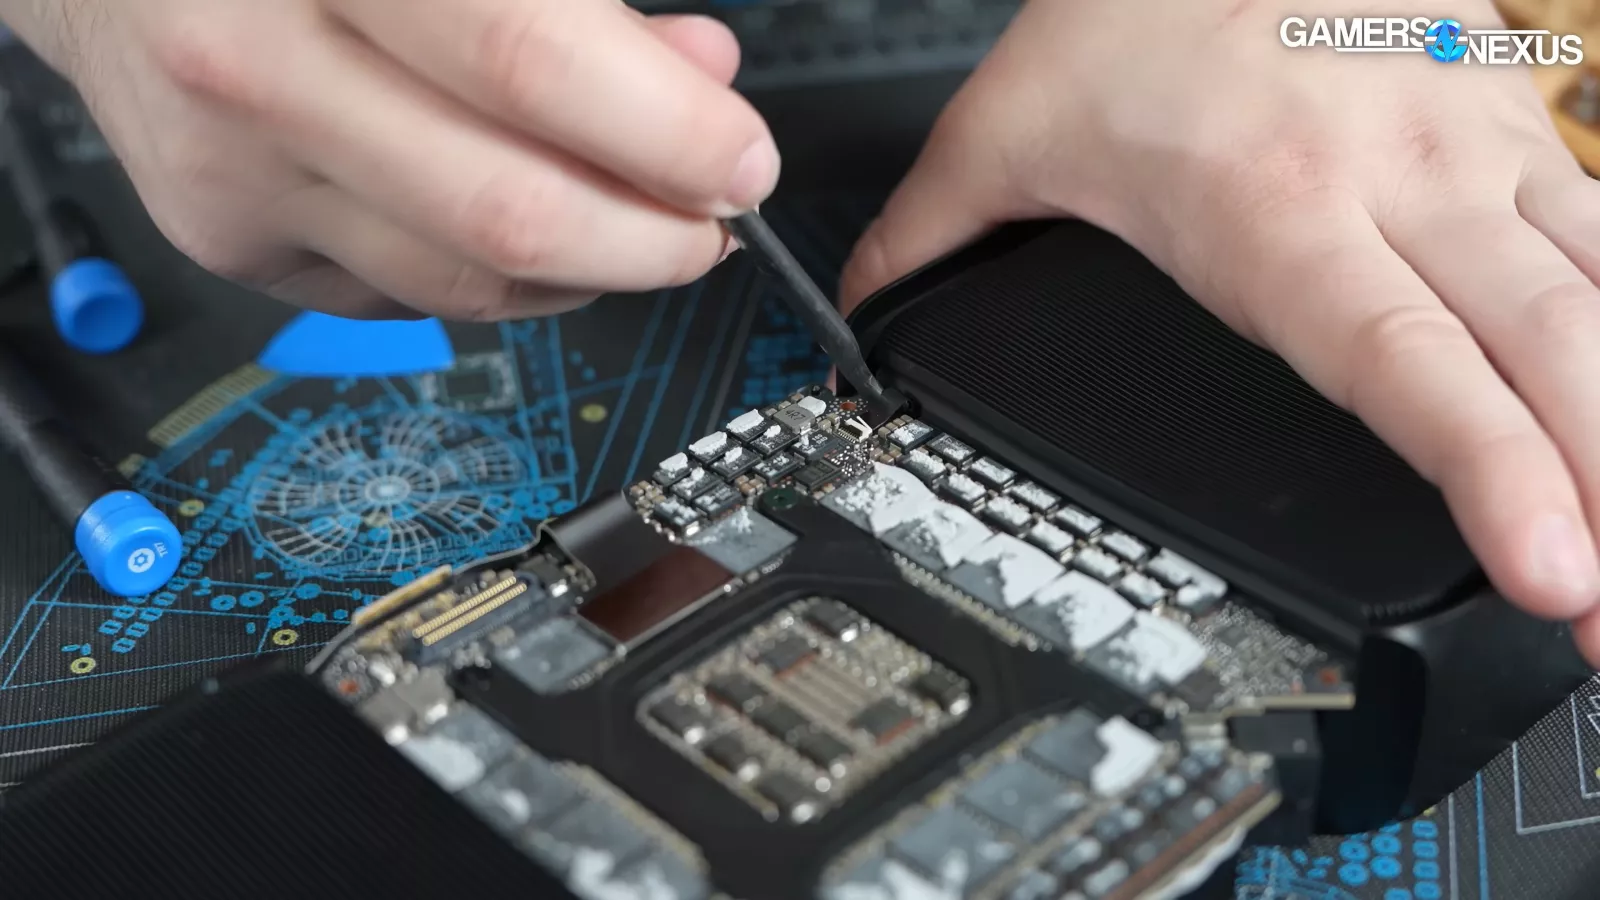
Looking at the thermal pads, they were making clear contact, though we did see some pads that were smashed over the sides a bit. This is fine, however. We counted 32 total memory locations, which means that they are 3GB memory modules as that totals 96GB, the capacity of the card.
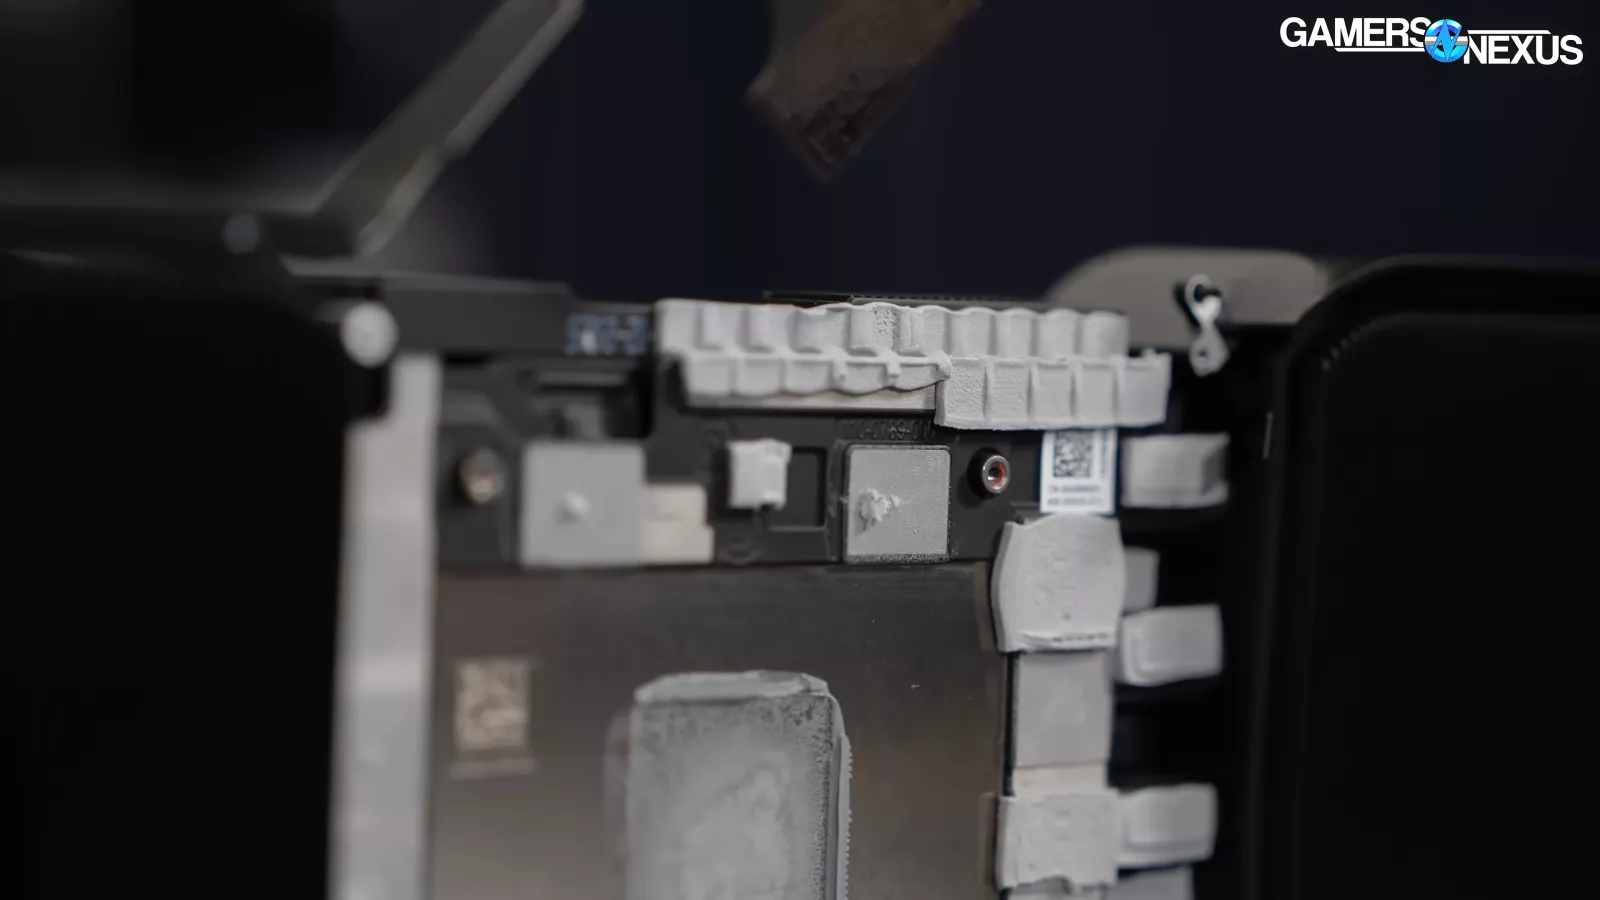
Taking a closer look, we noticed some areas of poor contact along one edge of the inductors, where we noticed that half of the inductors are actually covered by a thermal pad. One of them only had about a third of the inductor covered. That’s not good as they really need to get the pad placement correct on GPUs that cost 8-11 thousand dollars.
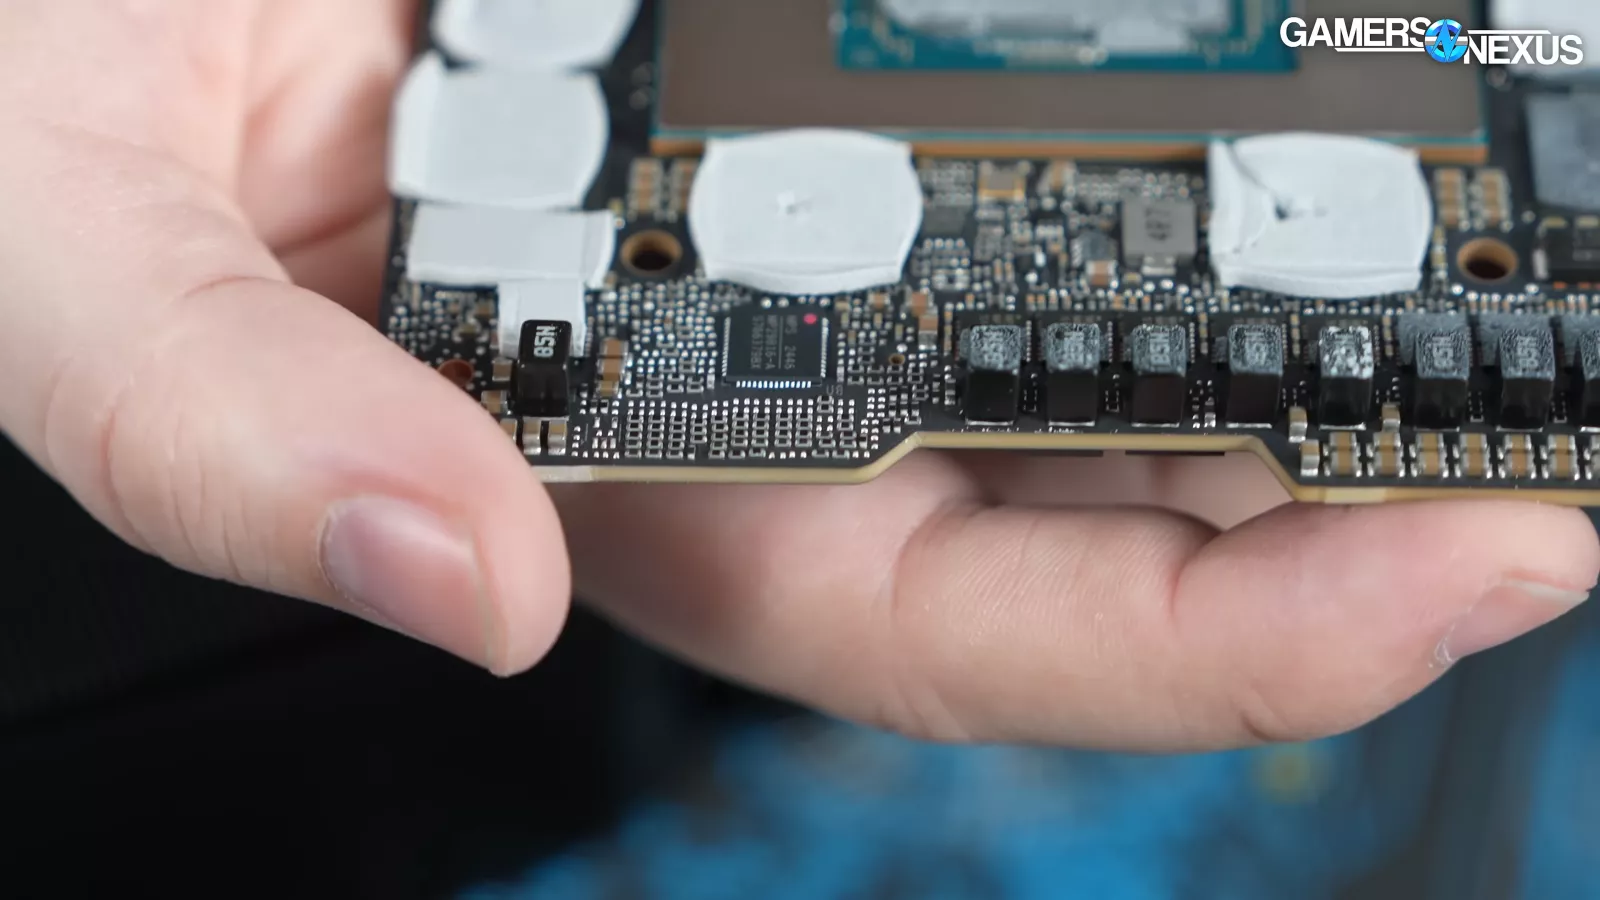
The board also has lots of little tiny components, leading to a very dense PCB.
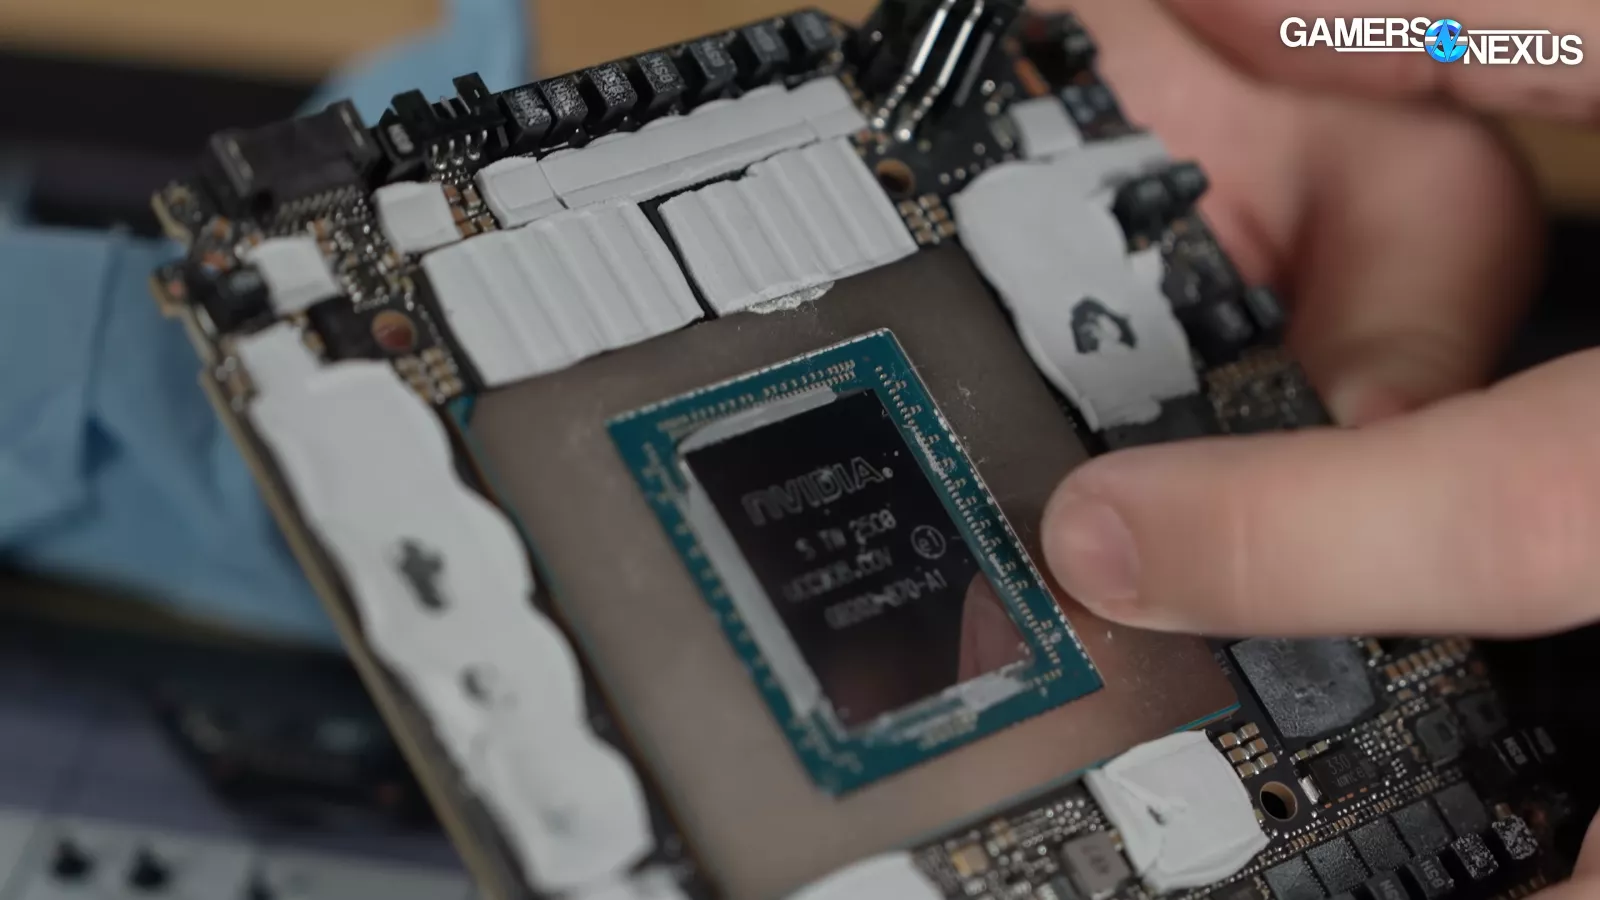
Finally, we cleaned off the thermal paste off of the GPU, exposing the GB 202-870-A1 SKU. This is a 5090 die, just a fuller version of it.
NVIDIA RTX 6000 Thermal Benchmarks
Thermal testing is up now. The RTX 5090 uses liquid metal with a 2-slot FE cooler that, genuinely, is one of the most impressive GPU coolers we’ve ever worked on. The prototype 4090 cooler we disassembled was more impressive in mechanical and cooling capabilities, but it was huge and impractical to manufacture. The 2-slot FE has done well in most cases, with the exception being memory cooling. We found that memory ran hot on our 5090 FE. That’s more of a concern with the PRO 6000 as well since it has so much memory.
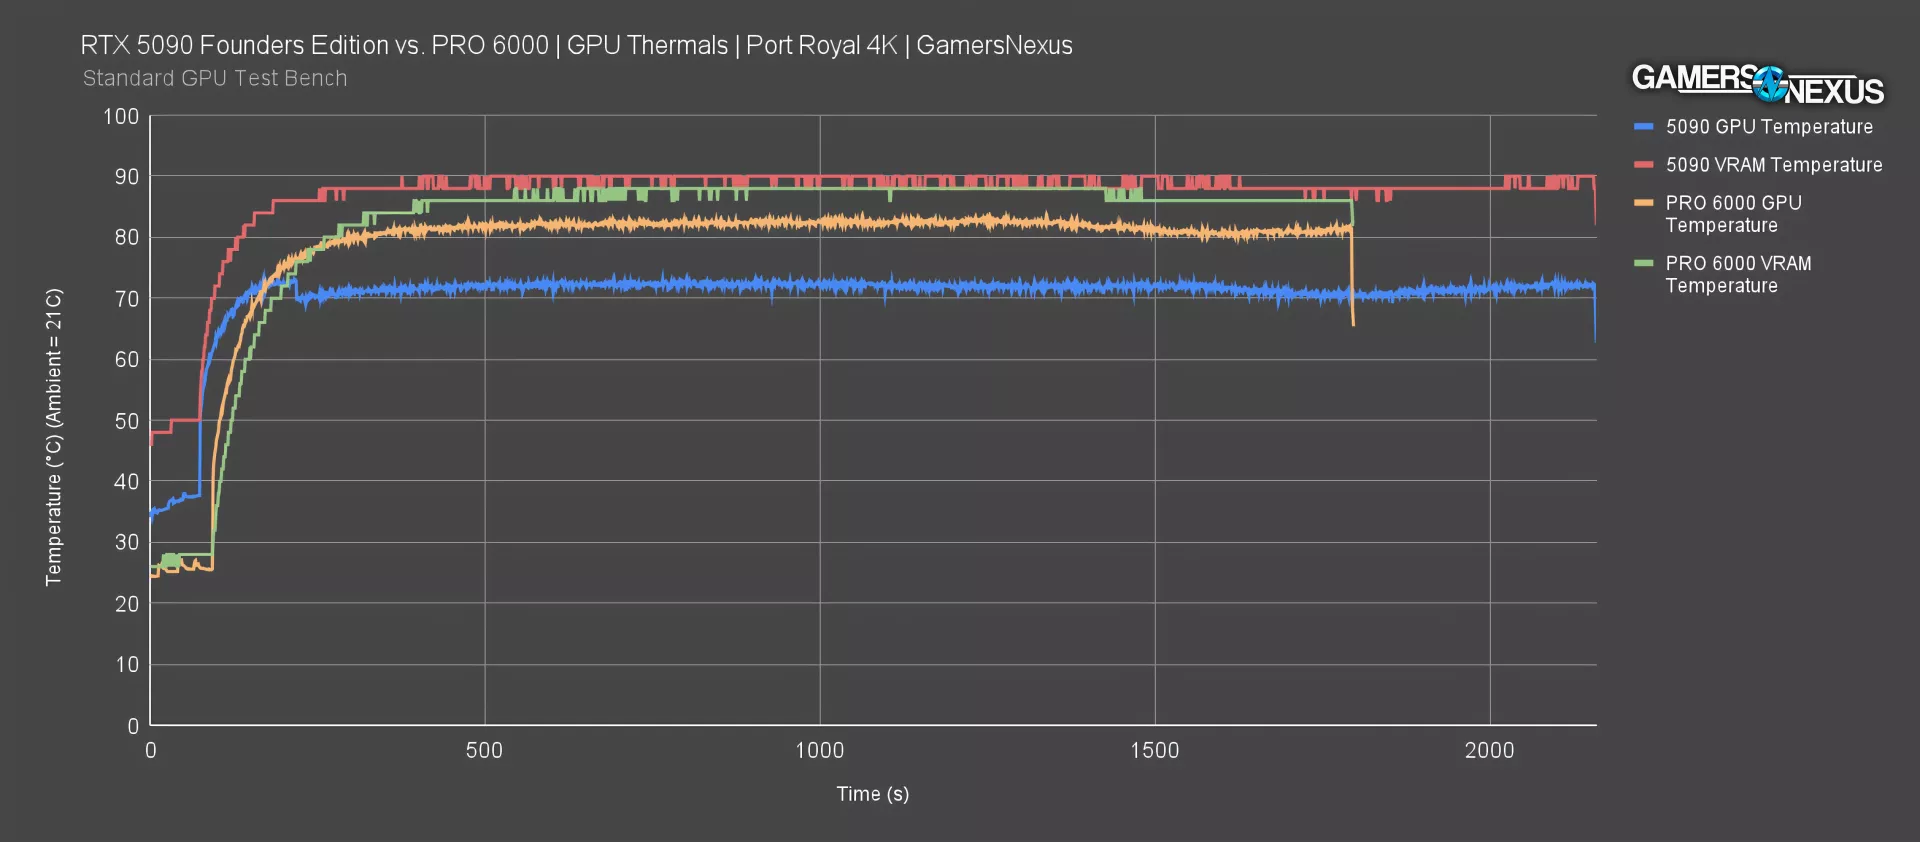
Here’s a thermal test during a fixed render workload. The 5090 ran at around 72 degrees Celsius for the GPU core temperature in this test, which is overall excellent considering its 2-slot design.
The VRAM for the 5090 ran at around 90 degrees Celsius, which was hotter than we’re comfortable with. Once accounting for installation into a case and potential long-term implications of pad dryout and dust, that’s high. The PRO 6000 ran its GPU core at a significantly hotter 82 degrees Celsius in this test, so about 10 degrees warmer than the 5090. The GPU memory was about the same, measuring 88 degrees via software.
Fan Response
None of that means anything without fan speeds.
Using only the auto settings, so following whatever VBIOS has programmed for the target GPU temperature, the RTX 5090 ran at 1550-1600 RPM for the average fan speed. The PRO 6000 ran at 1700. That’s a little faster with a much warmer core, but similar memory thermals.
Acoustics
Acoustics are next. For this testing, we’re using our hemi-anechoic chamber that we heavily invested in for improving our test quality. Our next major improvement will be upgrading the microphone, which is currently our bottleneck. We could hit a 6-8 dBA noise floor with a better mic, but we’re currently at 13.6 to 15.0 dBA for the floor. That’s still great though.
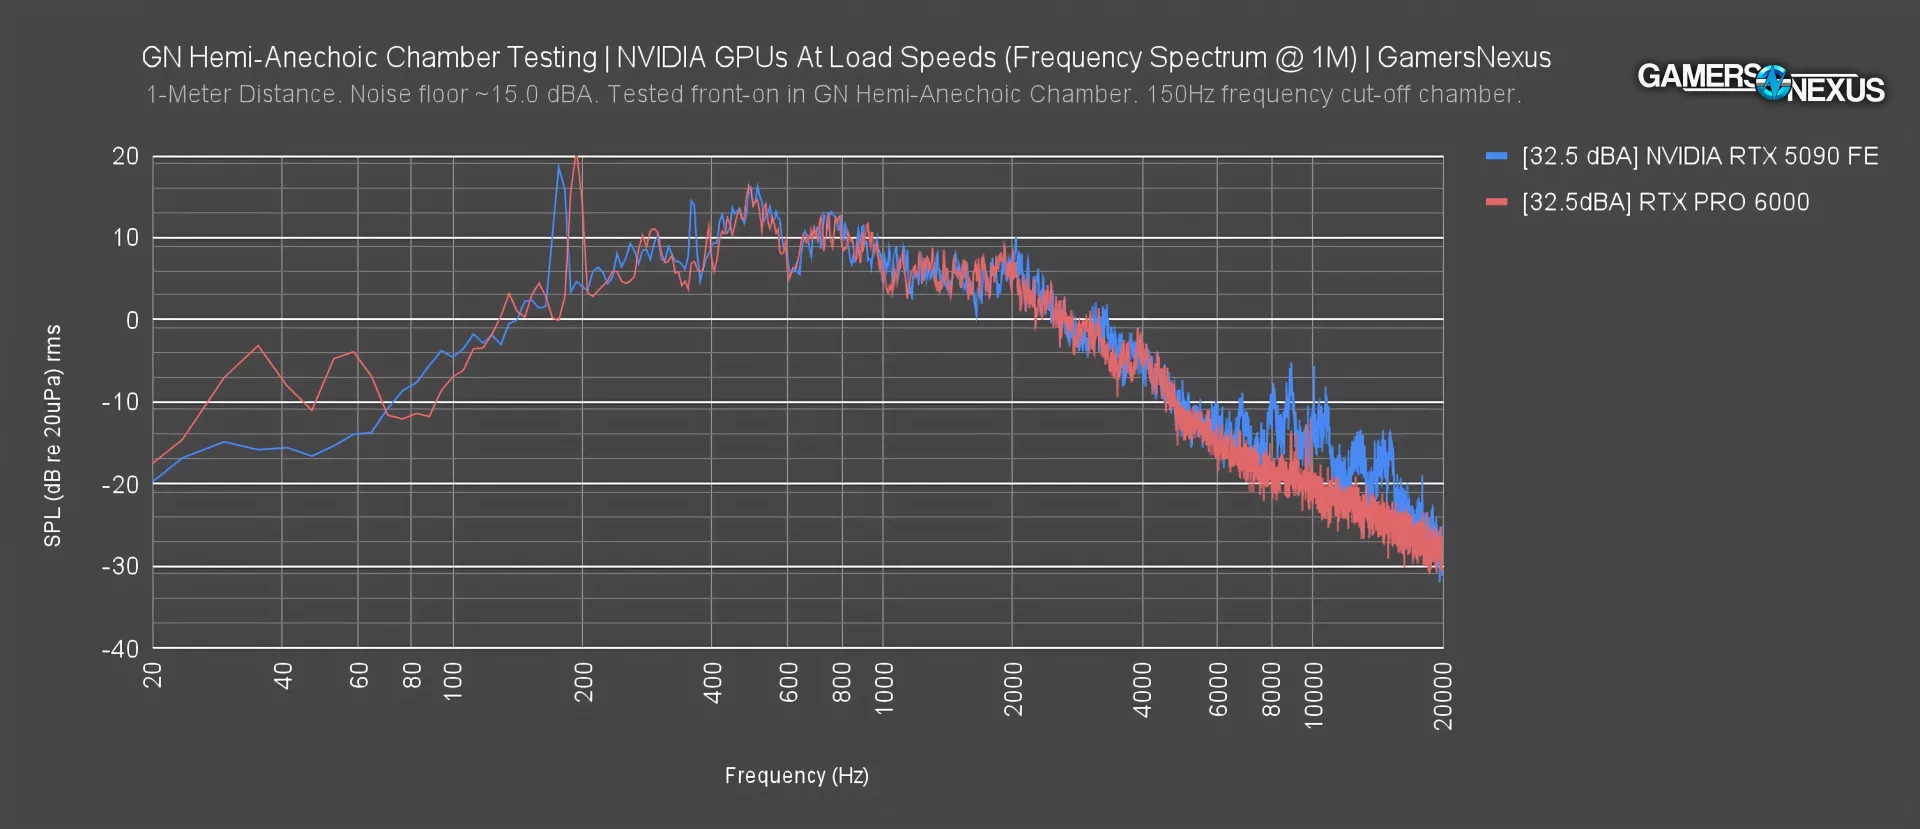
The RTX 5090 ran at about 32.5 dBA, with the PRO 6000 at the same noise level; however, the noise floor was slightly different between these two, so adjusting for that, the PRO 6000 would be about 1 dBA louder under the same conditions. This is hardly noticeable as a difference, if noticeable at all for most people.
Overall, the cooler design remains good when taking its size into consideration. The 5090 had higher noise levels in the higher frequency range, particularly 8000 to 10000 Hz. It also had a peak around 175 Hz, with the PRO peaking at 194 Hz and following a similar pattern, just adjusted right.
Generally speaking, this mostly follows the same trend. Our frequency cutoff is 150 Hz, so the higher result on the left can be ignored.
NVIDIA RTX 6000 Gaming Benchmarks
Gaming benchmarks are next.
Dragon’s Dogma 2 - 4K
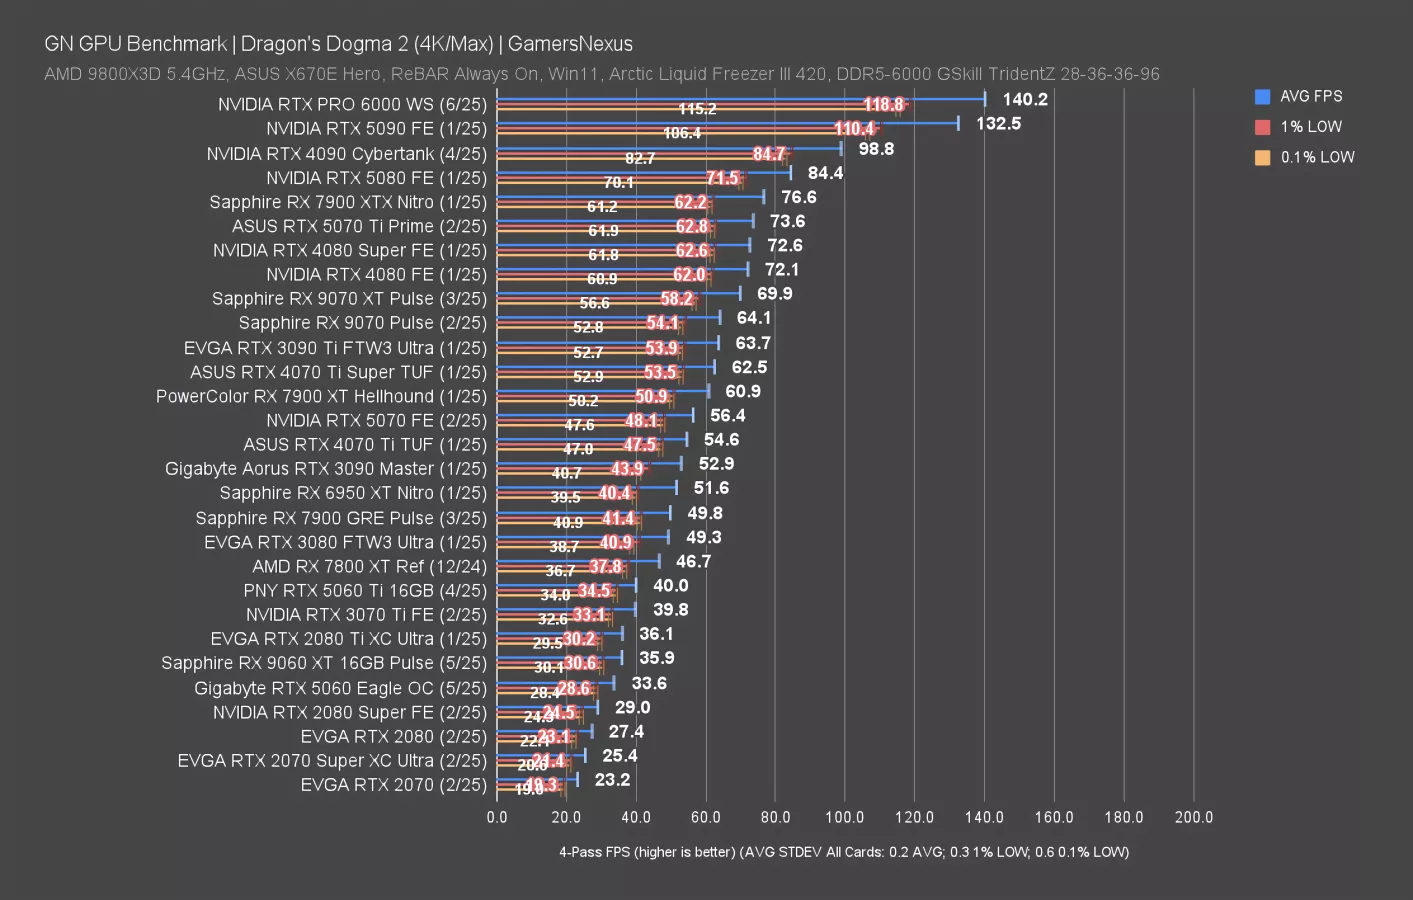
Dragon’s Dogma 2 is first.
Tested at 4K, the RTX PRO 6000 landed at 140 FPS AVG, which has it ahead of the RTX 5090 by 5.8% for average framerate. Lows are not notably different. In other words, that’s about an extra $1,000 per 1% improvement, or about $780 per 1 FPS increase over the 5090 when calculating by the difference in cost for these two.
The lead in the RTX PRO 6000 is about 42% over the 4090 (watch our review), with the 5090 already ahead of the 4090 by about 34% here.
Dragon’s Dogma 2 - 1440p
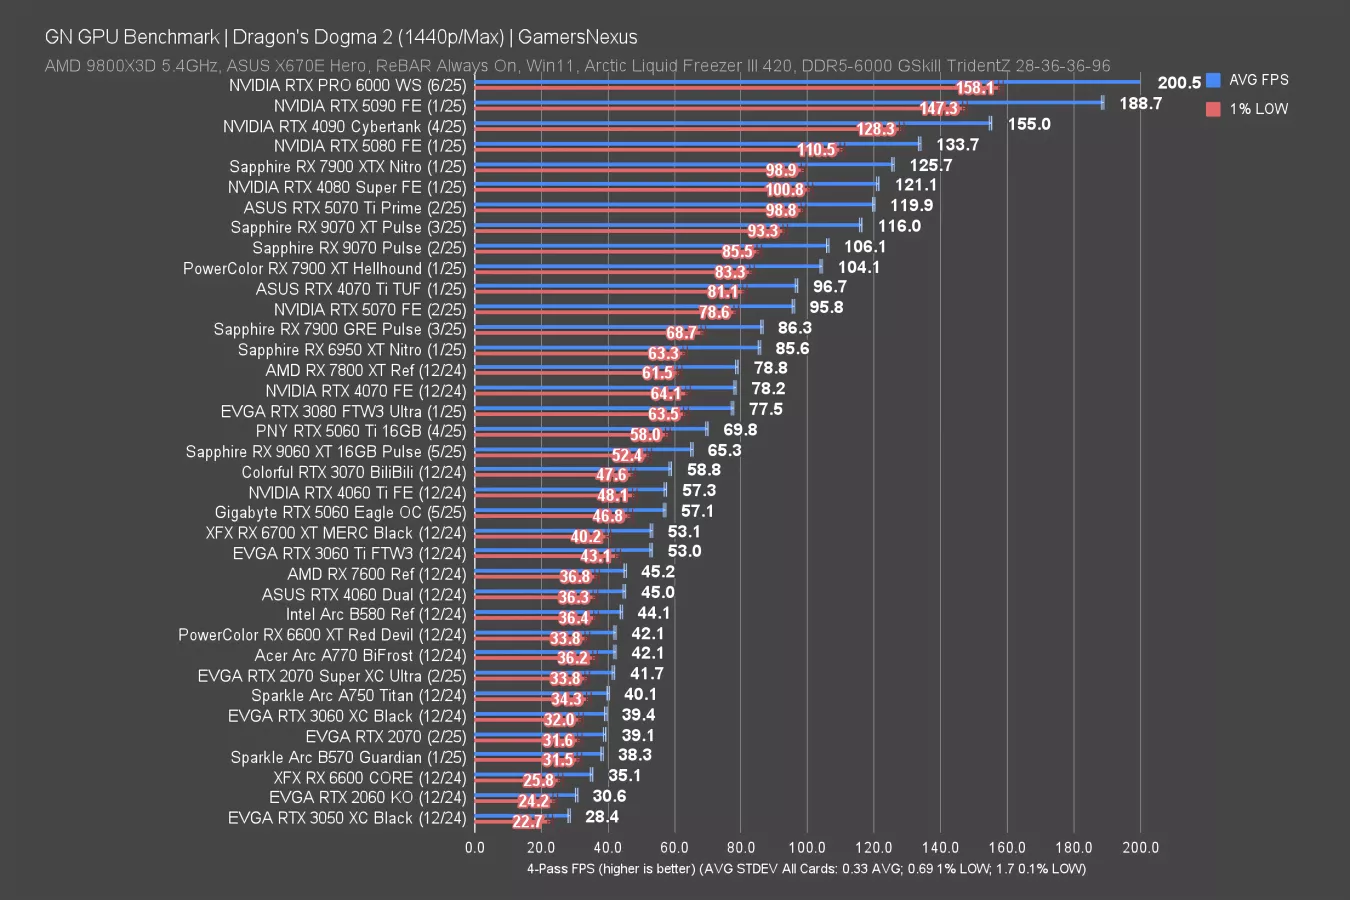
At 1440p, the lead over the 5090 is expanded to 6.3%, ensuring we get our full gaming value out of the card. Low performance is not different outside of the usual scaling along with the improvement in average frametimes.
The RTX PRO 6000 hits 201 FPS AVG here, leading the 189 FPS of the 5090 and the 155 of the 4090. NVIDIA currently holds the entire top cluster of this chart, with AMD mostly focusing on the modern mid-range and Intel focused on the modern low-end.
Dragon’s Dogma 2 - 1080p
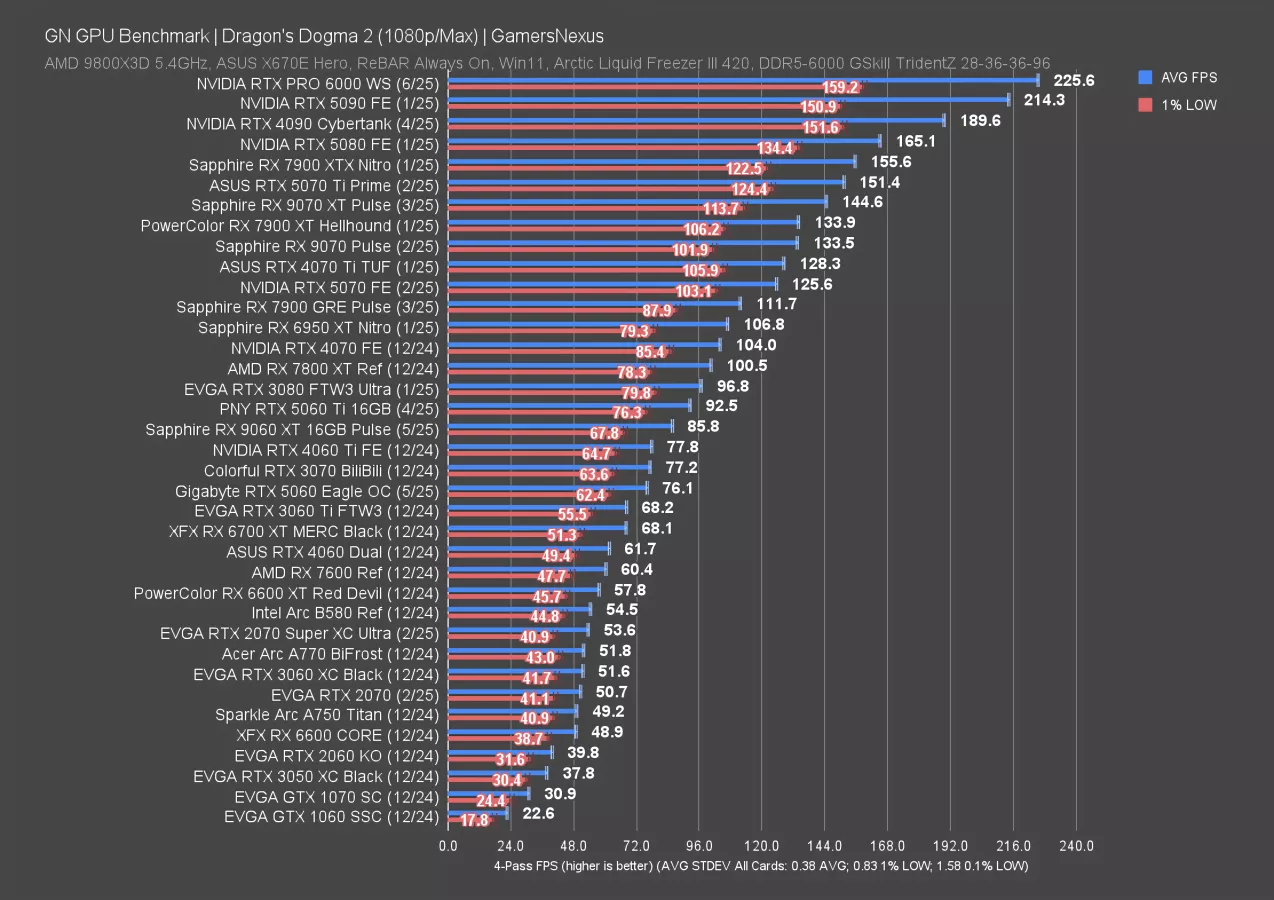
We next tested 1080p, which is what we all know buyers of this card really want to use it for. So-called AI use cases are obviously secondary compared to playing video games at 1080p.
The RTX PRO 6000 leads this extremely important and pivotal chart with a 226 FPS AVG, dropping to just a 5.3% lead. Honestly, there is something valuable that comes out of this chart: It’s marketing for AMD’s Ryzen 7 9800X3D, which is somehow keeping up with these GPUs enough that it can still produce distinguished results between the $2,000-$3,000 5090 and the $8,000 to $11,000 PRO 6000. That’s impressive. This is more amusing to us as it proves the longevity of our bench hardware more than anything else.
FFXIV 4K
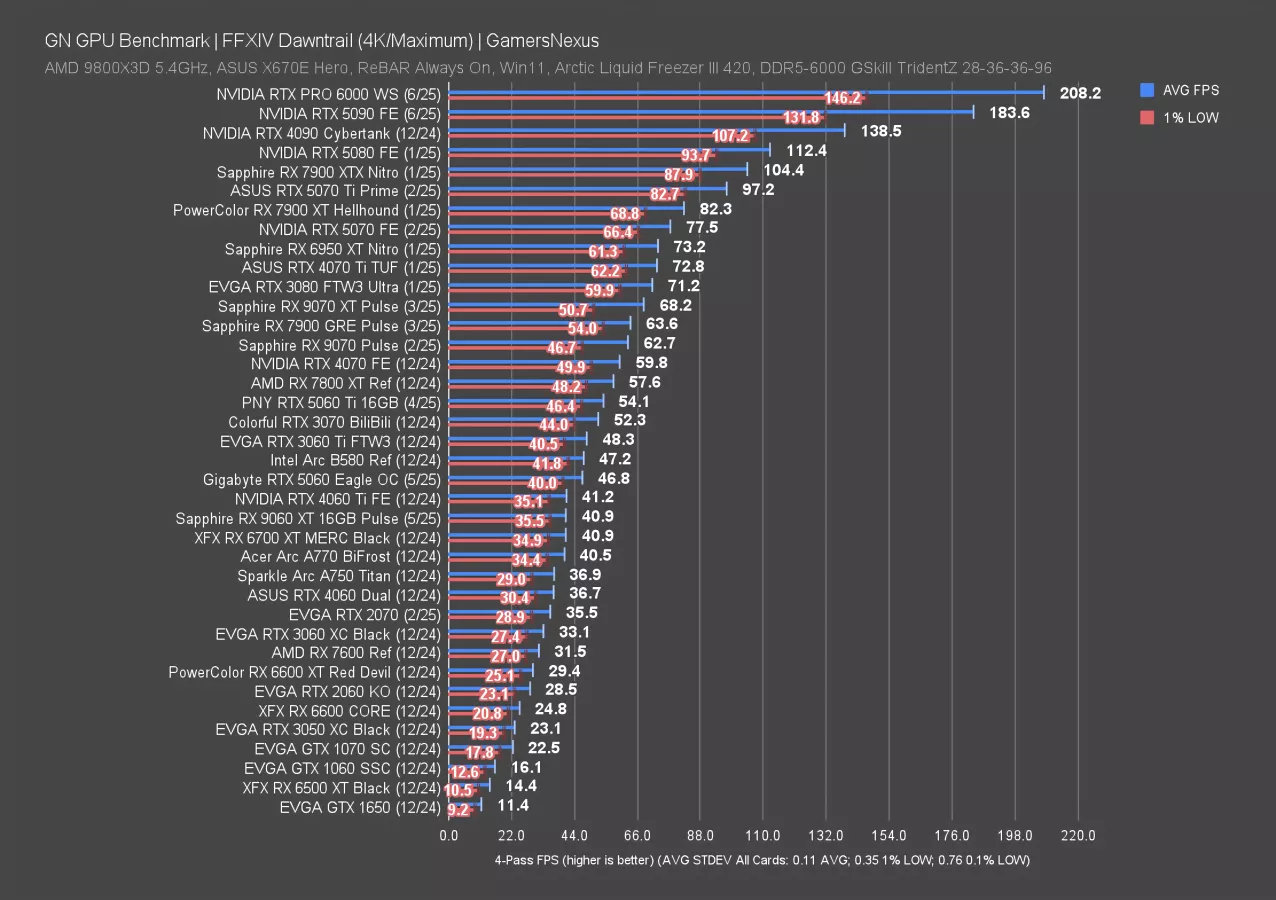
Final Fantasy 14 is up now, tested first at 4K.
The RTX Pro 6000 ran at 208 FPS AVG, leading the 5090’s 184 FPS AVG result by about 13%. That’s a larger gain than we’ve seen in some of the other games, though obviously this is still a card intended for VRAM-intensive use cases and not gaming. That there’s still some power left beyond the 5090 is what’s more interesting, alongside the fact that the 9800X3D is so capable. Lows scale with the average and are not meaningfully better with the PRO 6000.
FFXIV 1440p
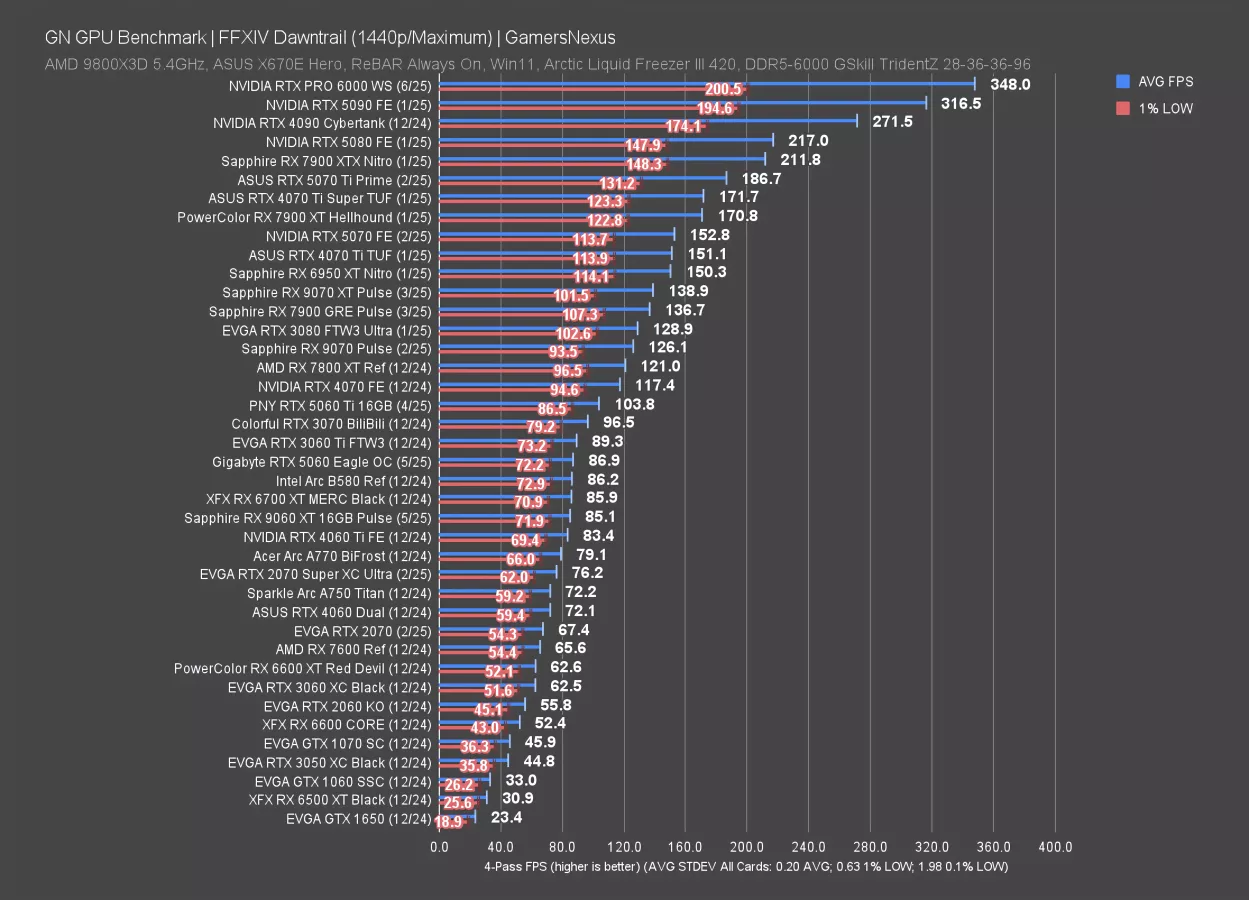
Tested at 1440p, we see a 10% improvement in framerate against the 5090, up at 348 FPS AVG for the 6000. Again, we’re mostly excited to see the 9800X3D continuing to scale and illustrating that there’s room left for another generation of testing on these benches. Lows remain in-step with the average.
FFXIV 1080p
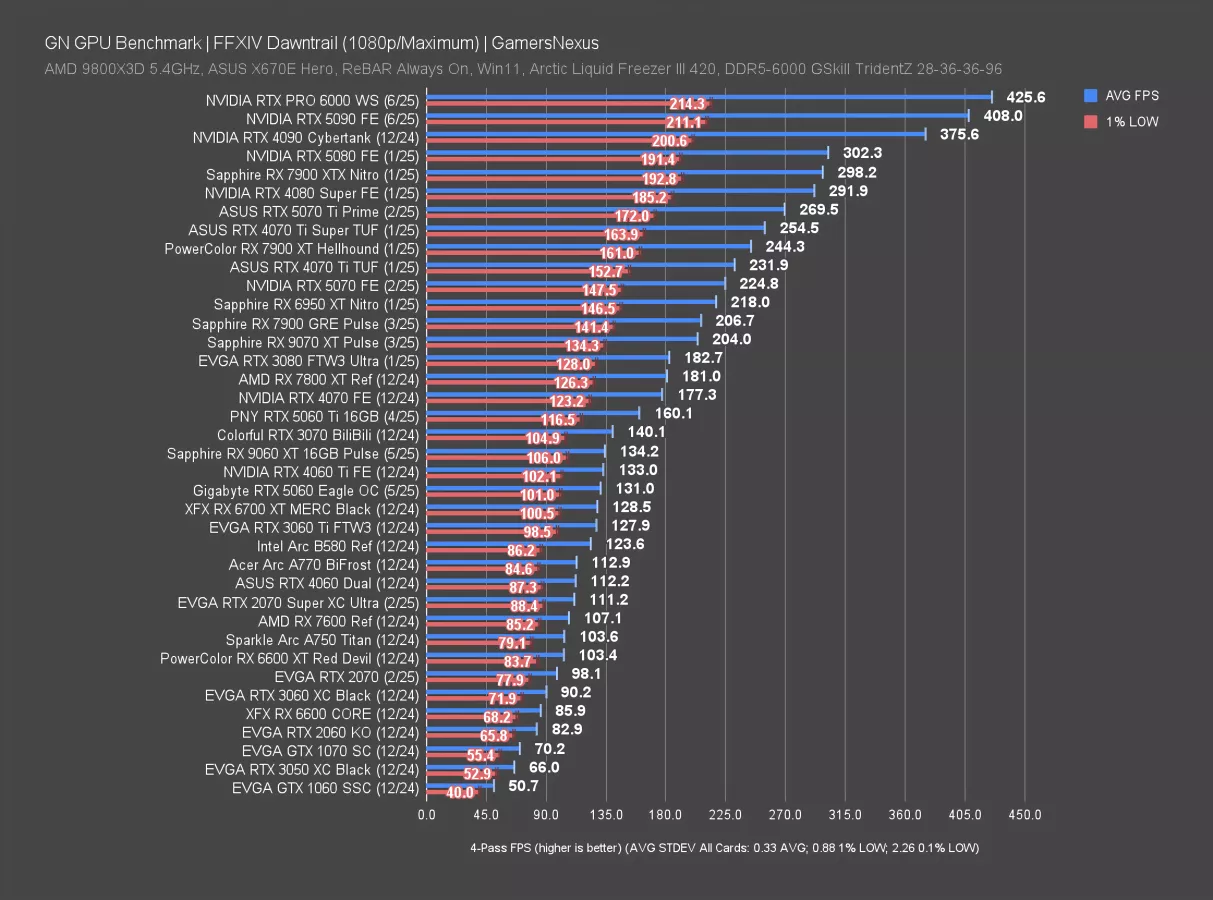
At 1080p, the PRO 6000 again outperforms the 5090. This time, it’s reduced to about 4.3%. Let’s move on.
Starfield - 4K
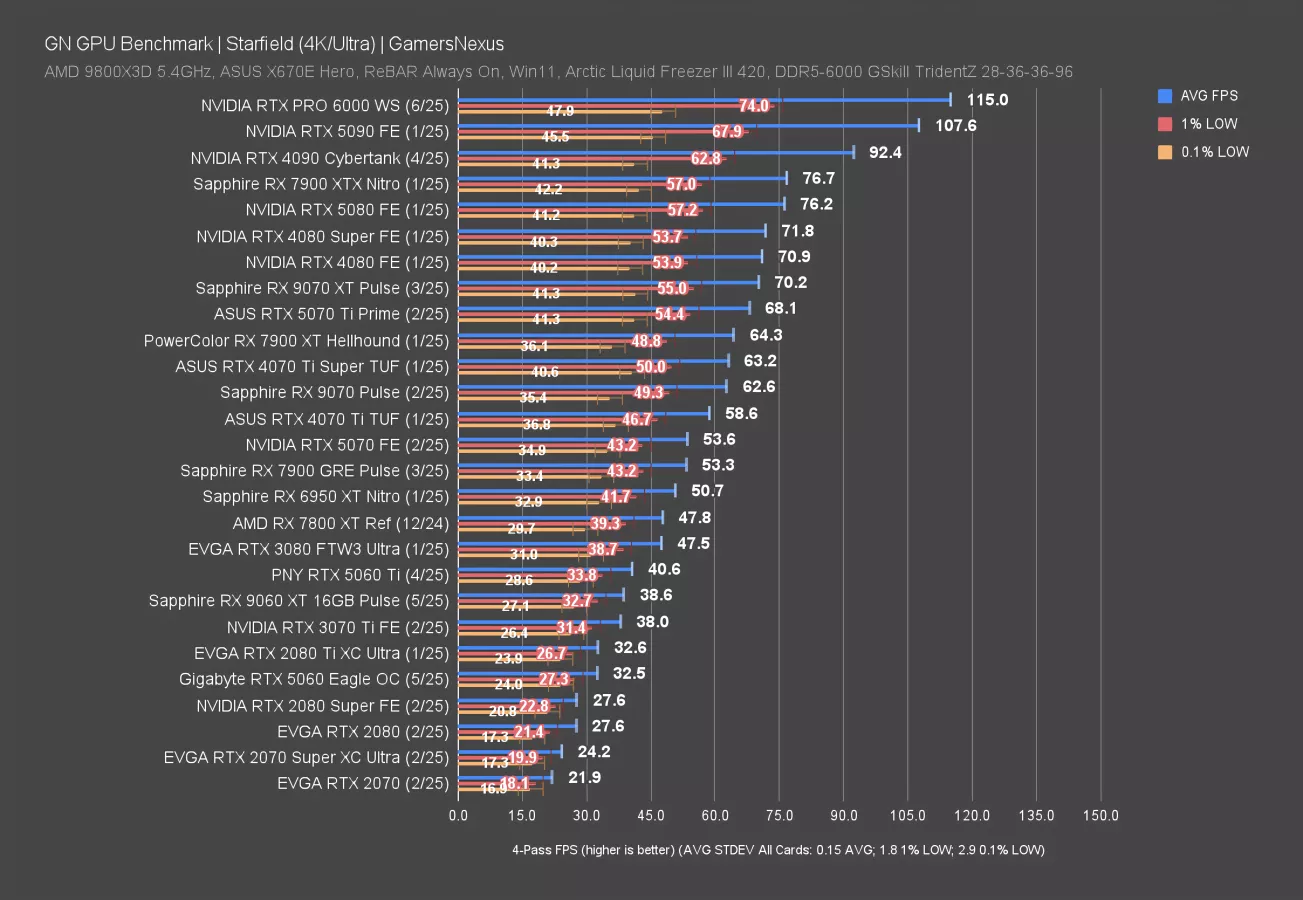
Up next, we’re testing a card no one buys for gaming with a game no one plays. In Starfield at 4K, the PRO 6000 ran at 115 FPS AVG, leading the 5090 by about 7%. Lows are mostly within error. The value here is somewhere in the range of $700 to $1,000 per 1% improvement, depending on the price of the 5090.
Starfield - 1440p
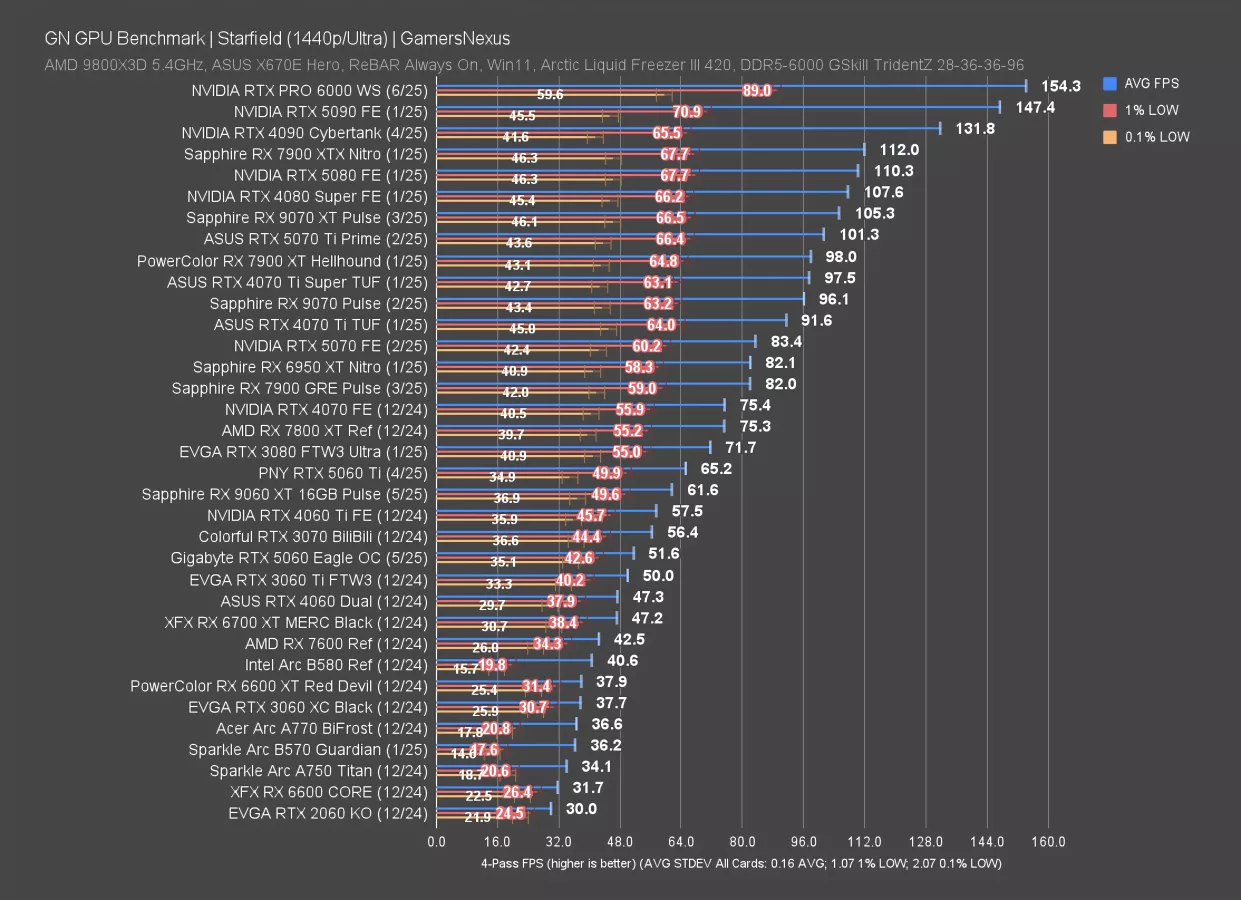
At 1440p, the RTX PRO 6000 ran at 154 FPS AVG, leading the 147-148 FPS result of the 5090 marginally. The improvement over the 4090 is 17%, with the 5090 having previously led the 4090 by 12% in this test, as we’re becoming bound elsewhere.
The 1% lows for the 6000 are noteworthy here: At 89 FPS for the averaged 1% low, the PRO 6000 outperforms the average framerate of the 5070 and nearly matches the 4070 Ti with just the PRO’s 1% numbers alone.
Resident Evil 4 - 4K
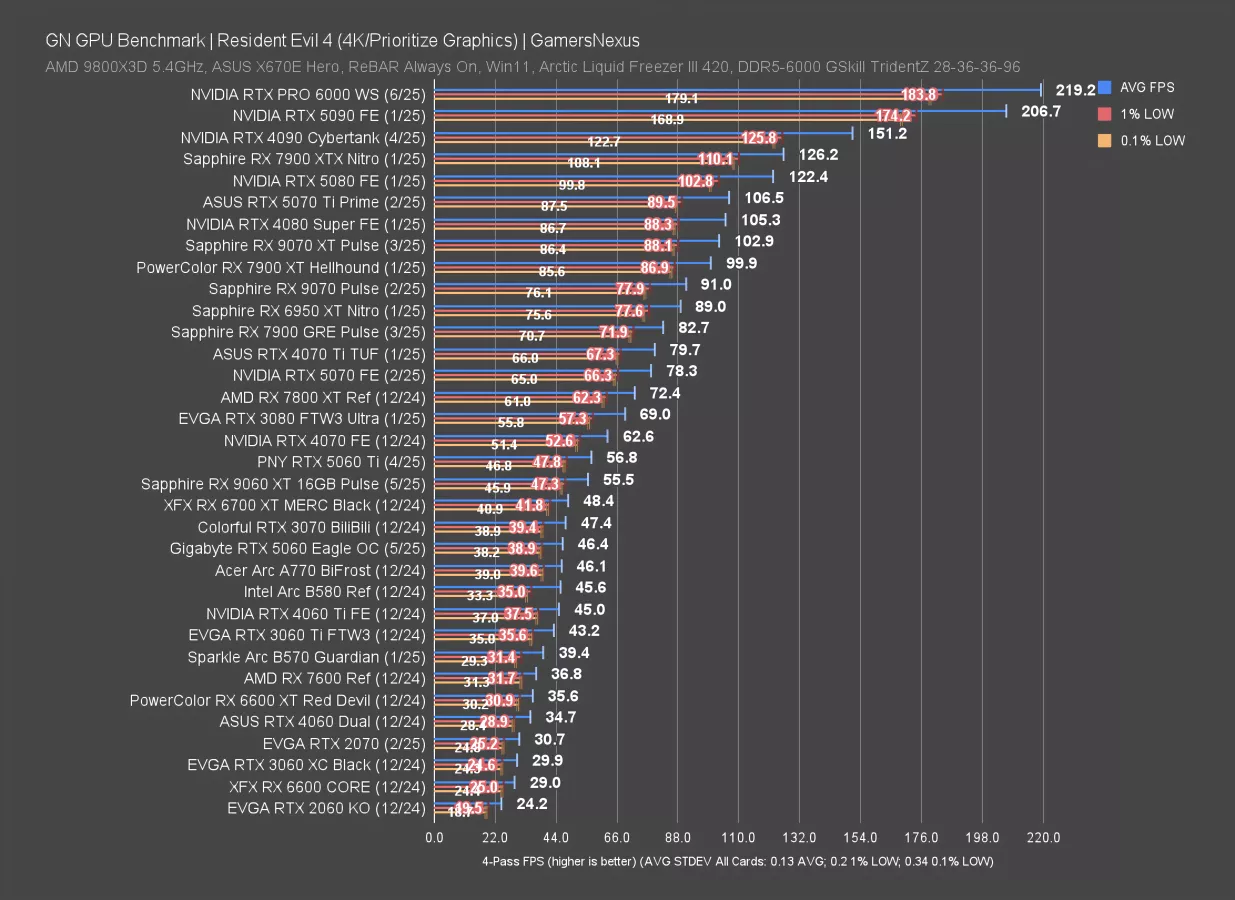
Resident Evil at 4K is up next. In this one, the RTX PRO 6000 ran at 219 FPS AVG, leading the 207 FPS AVG result of the 5090 by 6%. That’s consistent with most of the other tests so far. The lows, again, are not meaningfully different. The 4090’s 151 FPS AVG allows the 6000 a lead of 45%, or the 5090 a lead of 36.7%.
Resident Evil 4 - 1440p
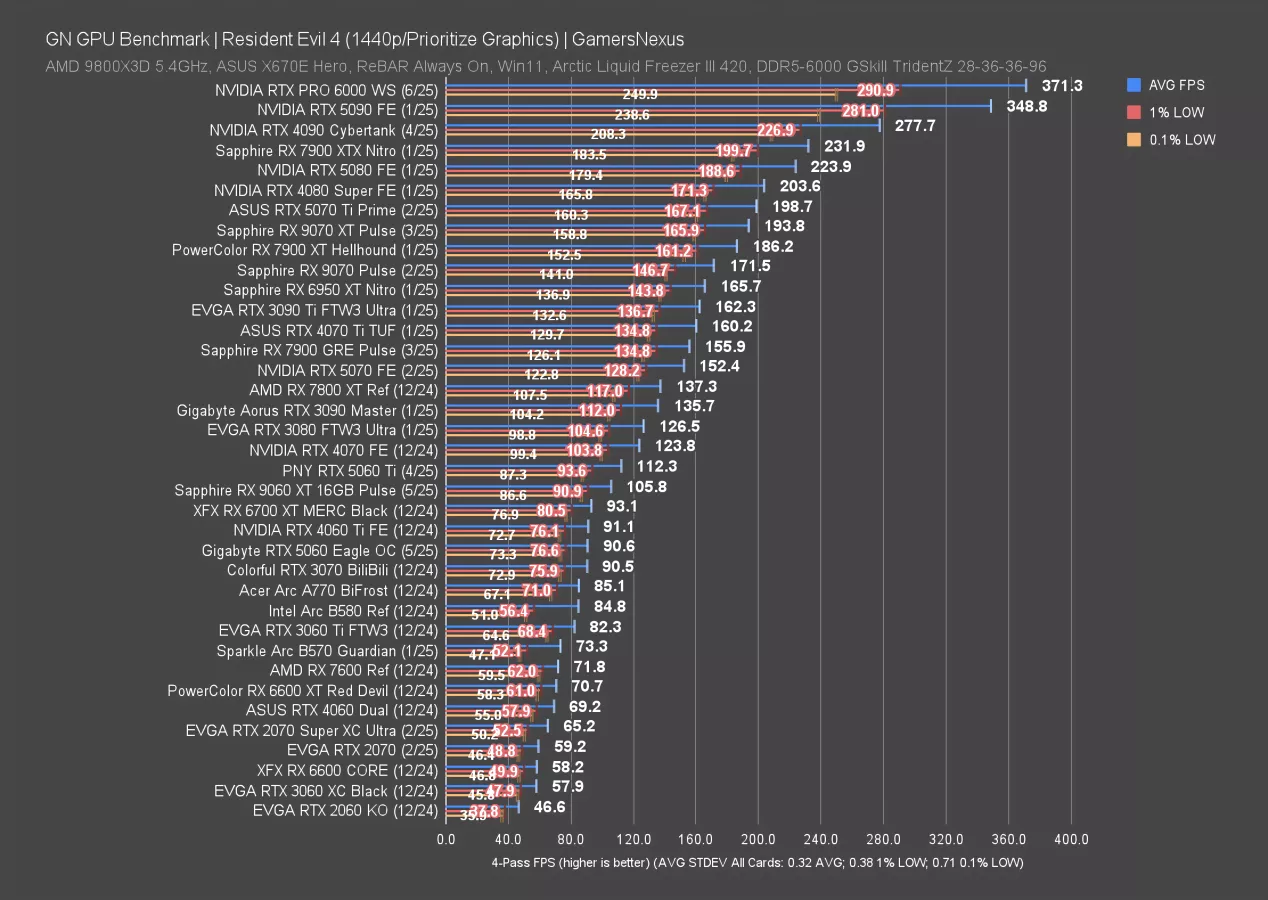
At 1440p, the Blackwell workstation card ran at 371 FPS AVG, pushing the framerate measurably higher than the roughly 350 FPS AVG of the 5090 previously. We’re looking at about a 6.5% improvement, aligning with prior results again, and yet again showing just how good the 9800X3D is.
Black Myth: Wukong - 4K
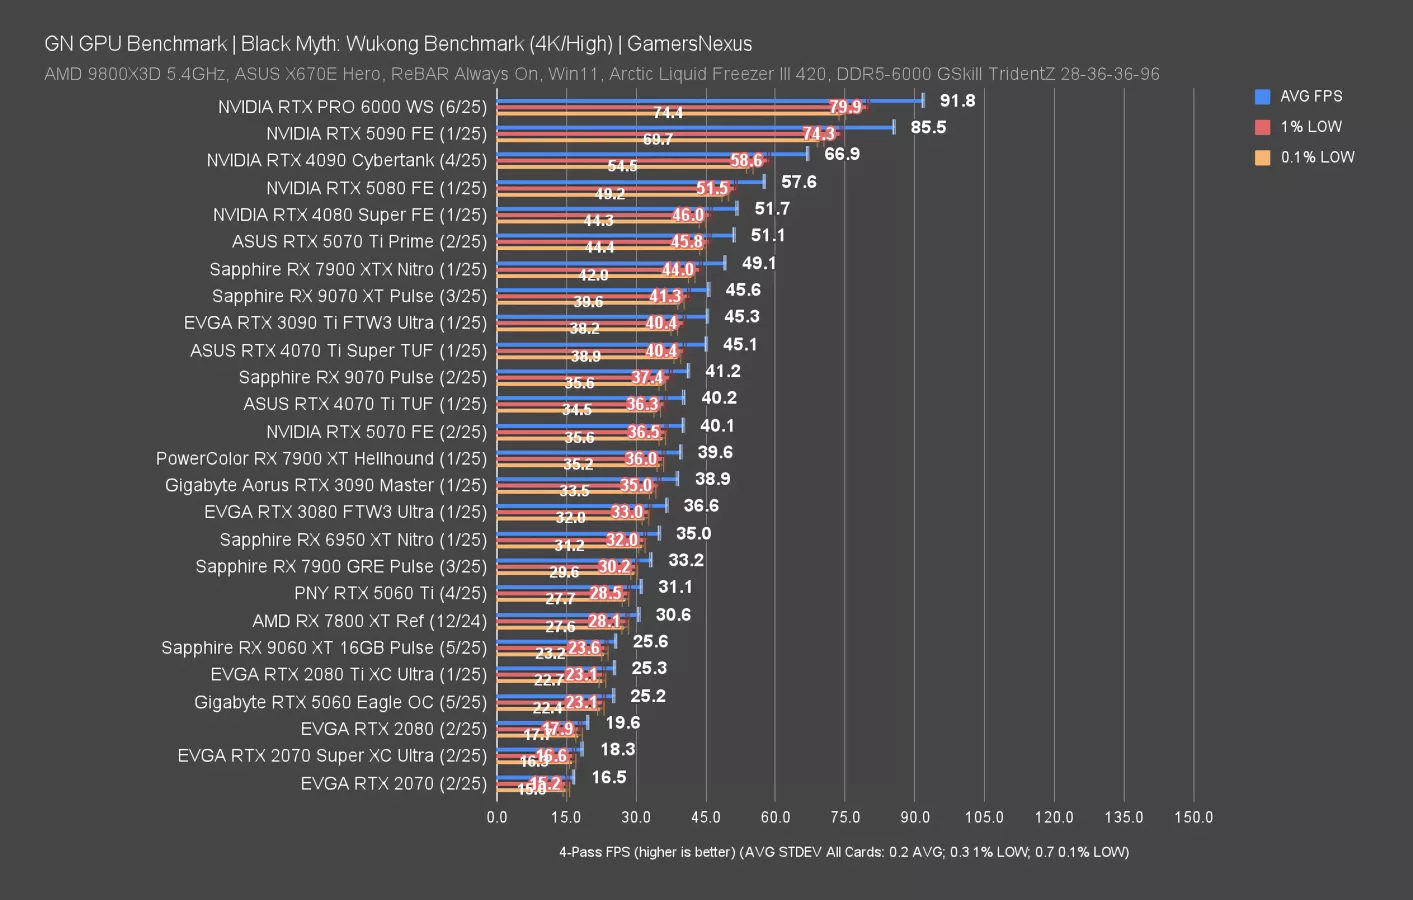
Black Myth: Wukong is up now, tested first at 4K and representing one of our heaviest non-RT workloads. The RTX PRO 6000 didn’t break the 100 FPS barrier, but it was the first card to exceed 90 -- not that this particularly matters to anyone when the 5090 was already in the mid 80s. The 6000 outperforms our 5090 FE result by 7.4%, above what we’ve seen on average thus far by about 1 percentage point. 92 FPS AVG is a good showing in this benchmark when at 4K. The next card in the stack is the 4090 at 67 FPS AVG, then the 5080 at 58 FPS AVG.
Black Myth: Wukong - 1440p
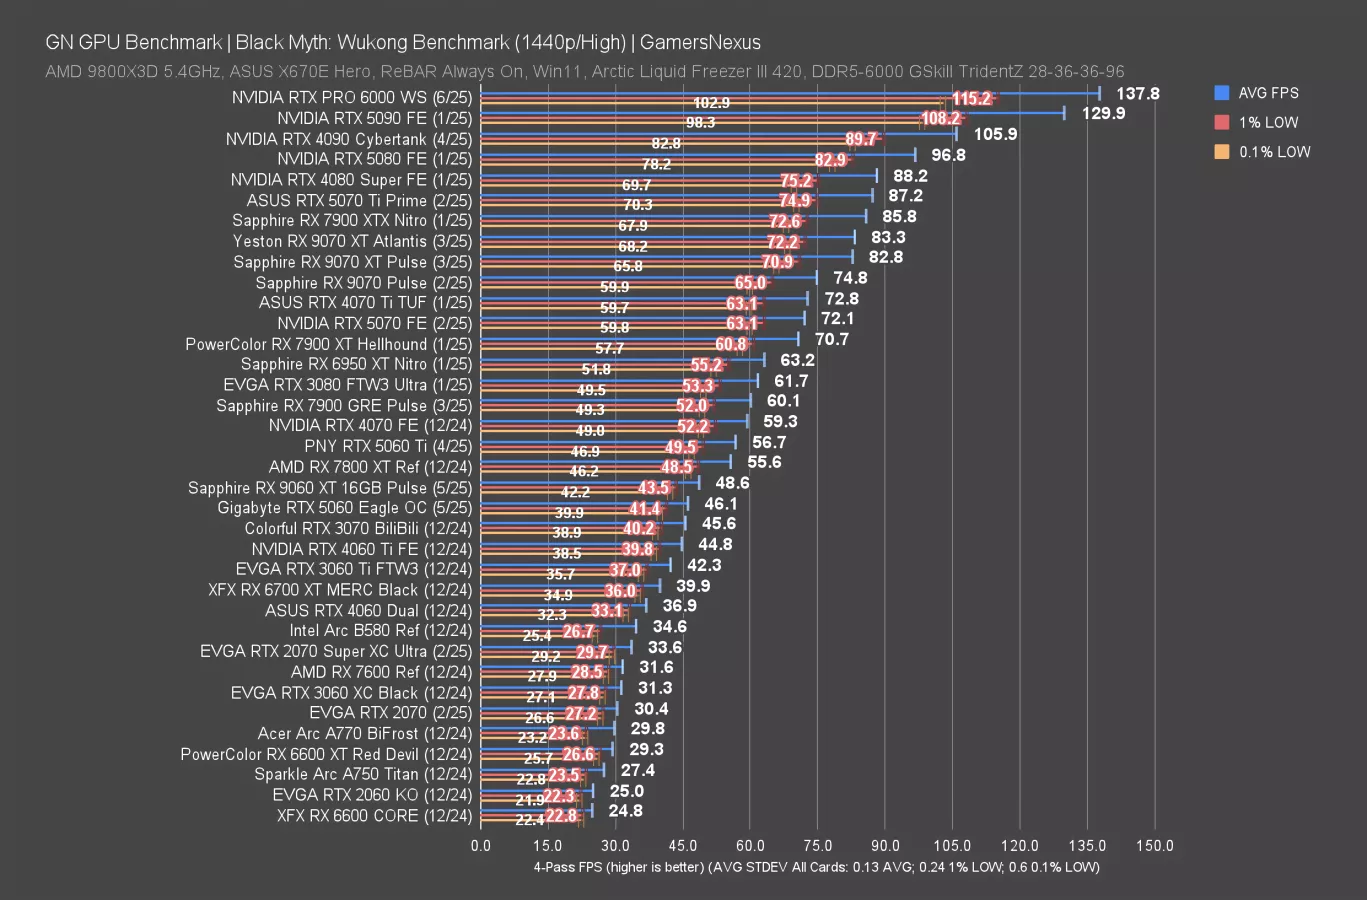
At 1440p, the PRO 6000 ran at 138 FPS AVG and led the 5090 marginally, but it was technically still a measurable improvement. Total uplift is 6.1%, aligning with Resident Evil 4 previously. Once again, the next card is the 4090. After this is the 5080, which isn’t that different from the 4080 Super (read our review), which isn’t that different from the 4080 (watch our review), which isn’t that different from the 5070 Ti.
Black Myth: Wukong - 1080p
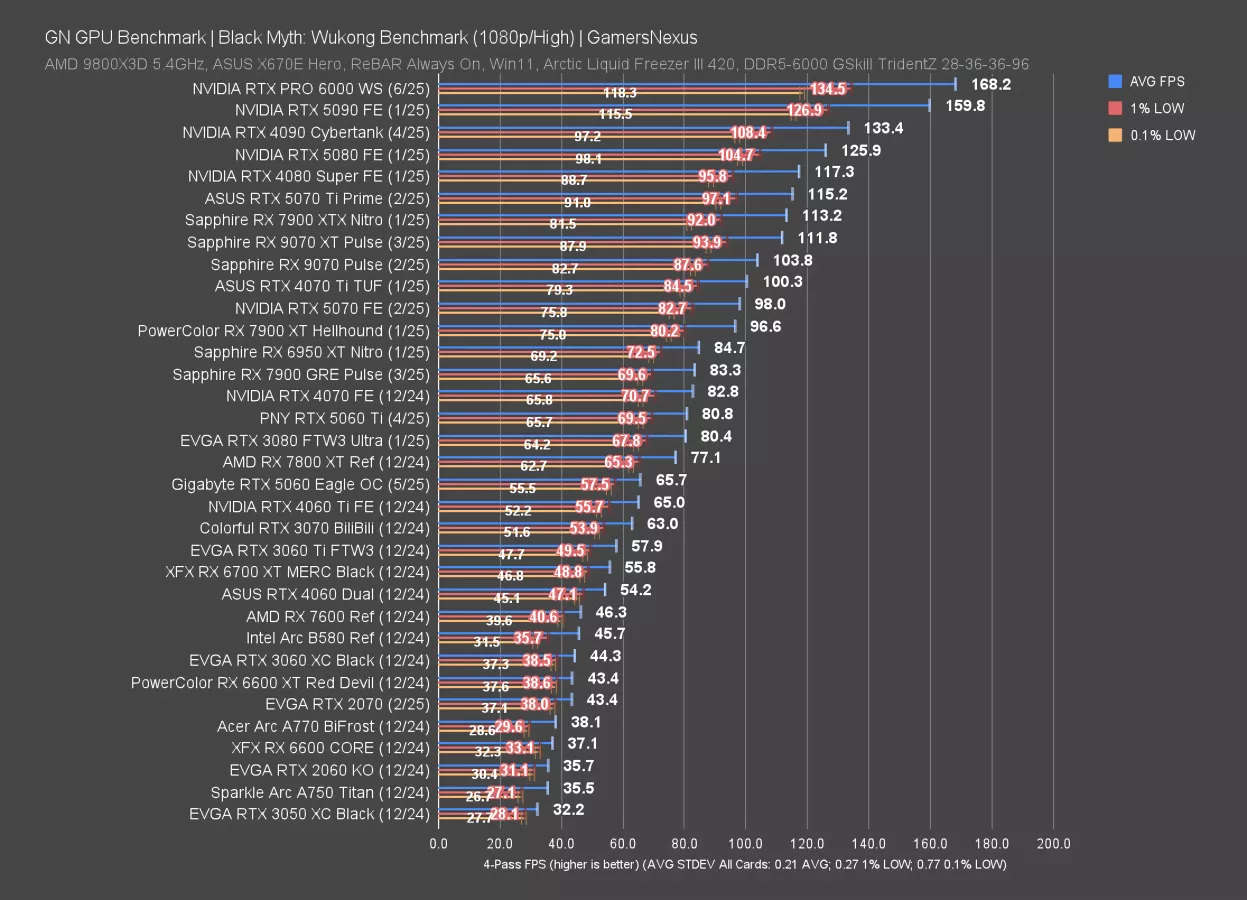
Black Myth: Wukong at 1080p is next. Selfishly, 1080p is interesting once again for probing at if there’s room in the CPU for more GPU. Turns out, there is: With the 9800X3D, the RTX PRO 6000 ran at 168 FPS AVG, improving on the 5090 by about 5%. That’s less than we saw at 1440p, which was less than we saw at 4K, so the card is gaining ground as resolution increases.
Dying Light 2 - 4K
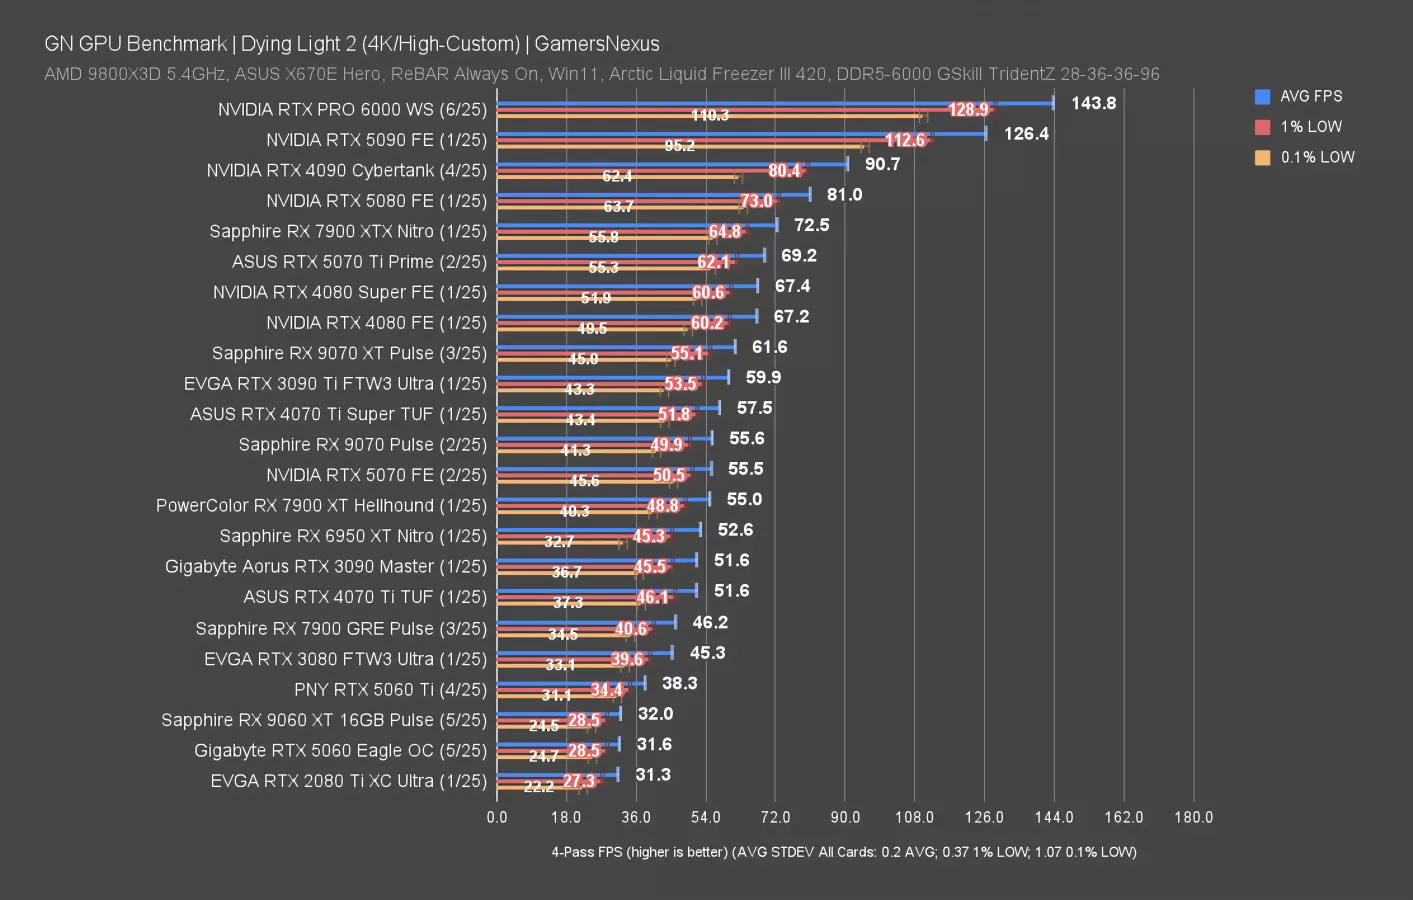
Dying Light 2 is up next. At 4K, the PRO 6000 ran at 144 FPS AVG, which is a noteworthy improvement on the 126 FPS AVG of the 5090 FE. That’s a surprising 13.8%, which so far matches only one other game we’ve tested -- and that was Final Fantasy. Most of the other games are closer to 5-7%.
The 4090 is next at 91 FPS AVG, meaning the PRO 6000 is 59% ahead of the 4090.
Dying Light 2 - 1440p
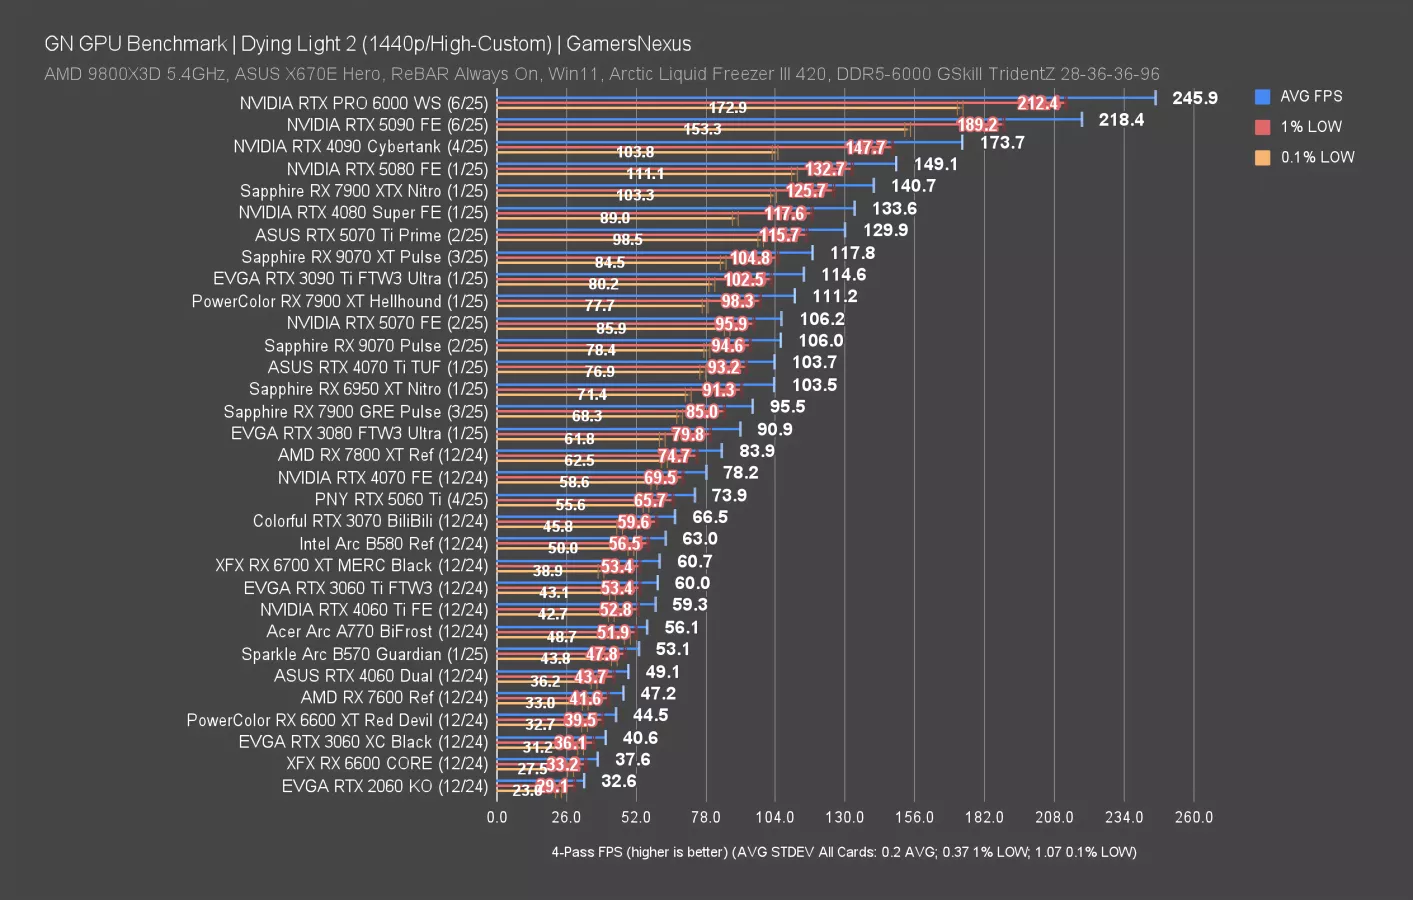
At 1440p, there’s still scaling: The PRO 6000 is now at 246 FPS AVG, leading the 5090 by almost 13%. That’s a drop from what we saw at 4K, but still more than most other games.
Cyberpunk 2077: Phantom Liberty - 4K
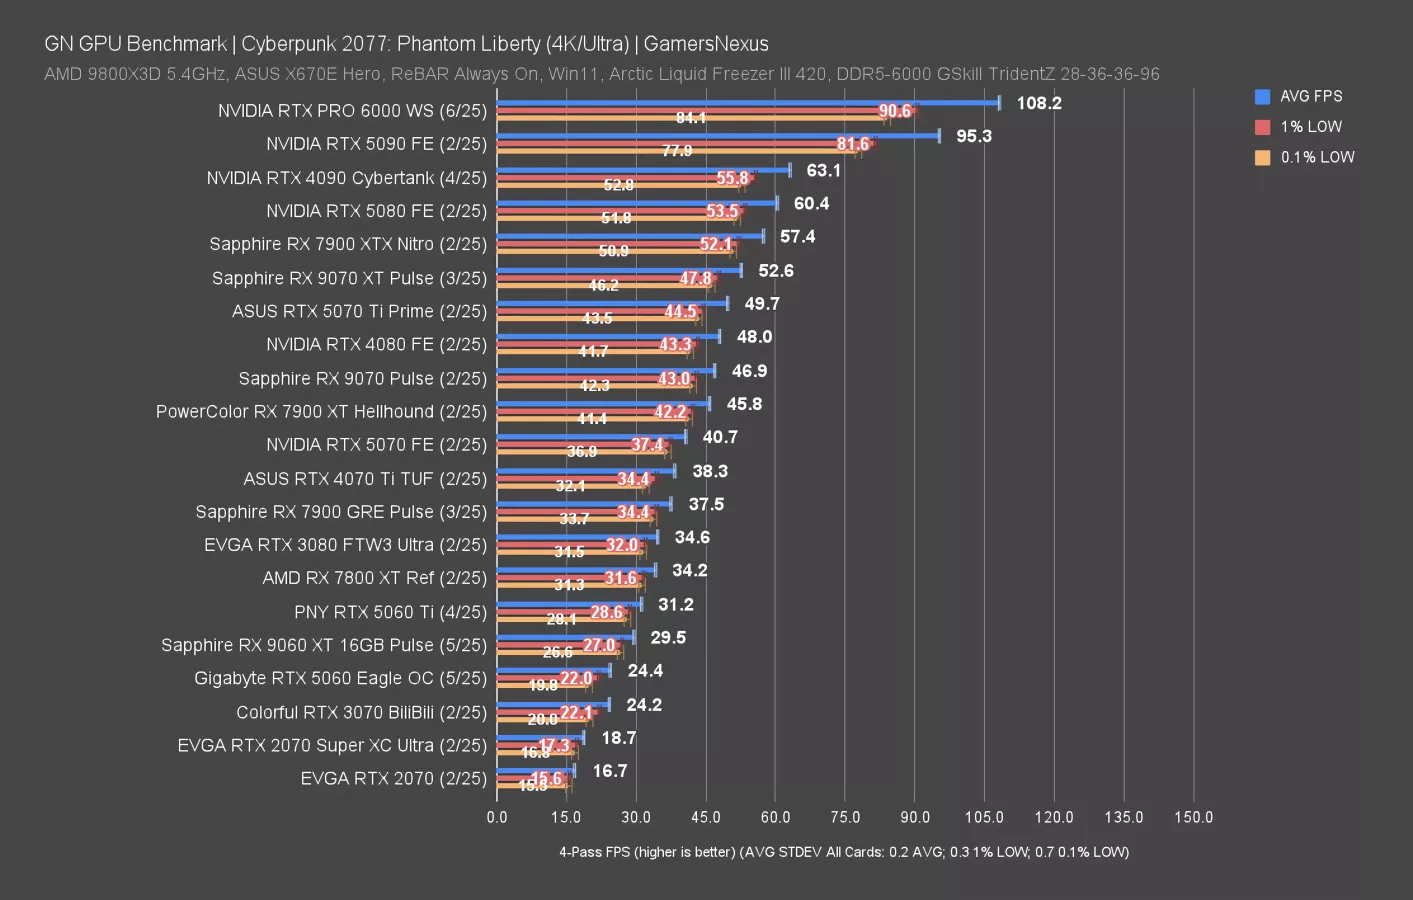
Cyberpunk 2077: Phantom Liberty is one of our next most intensive games after Black Myth: Wukong. At 4K, the RTX PRO 6000 breaks through 100 FPS and hits 108, leading the 5090 by 13.5%. This is actually a pretty big lead and is another one of the games that has a larger average improvement. That’s still not worth $8,000 or $11,000 or whatever it is they’re selling these for, but it’s interesting to see any difference at all given the focus on so-called AI workloads.
Cyberpunk 2077: Phantom Liberty - 1440p
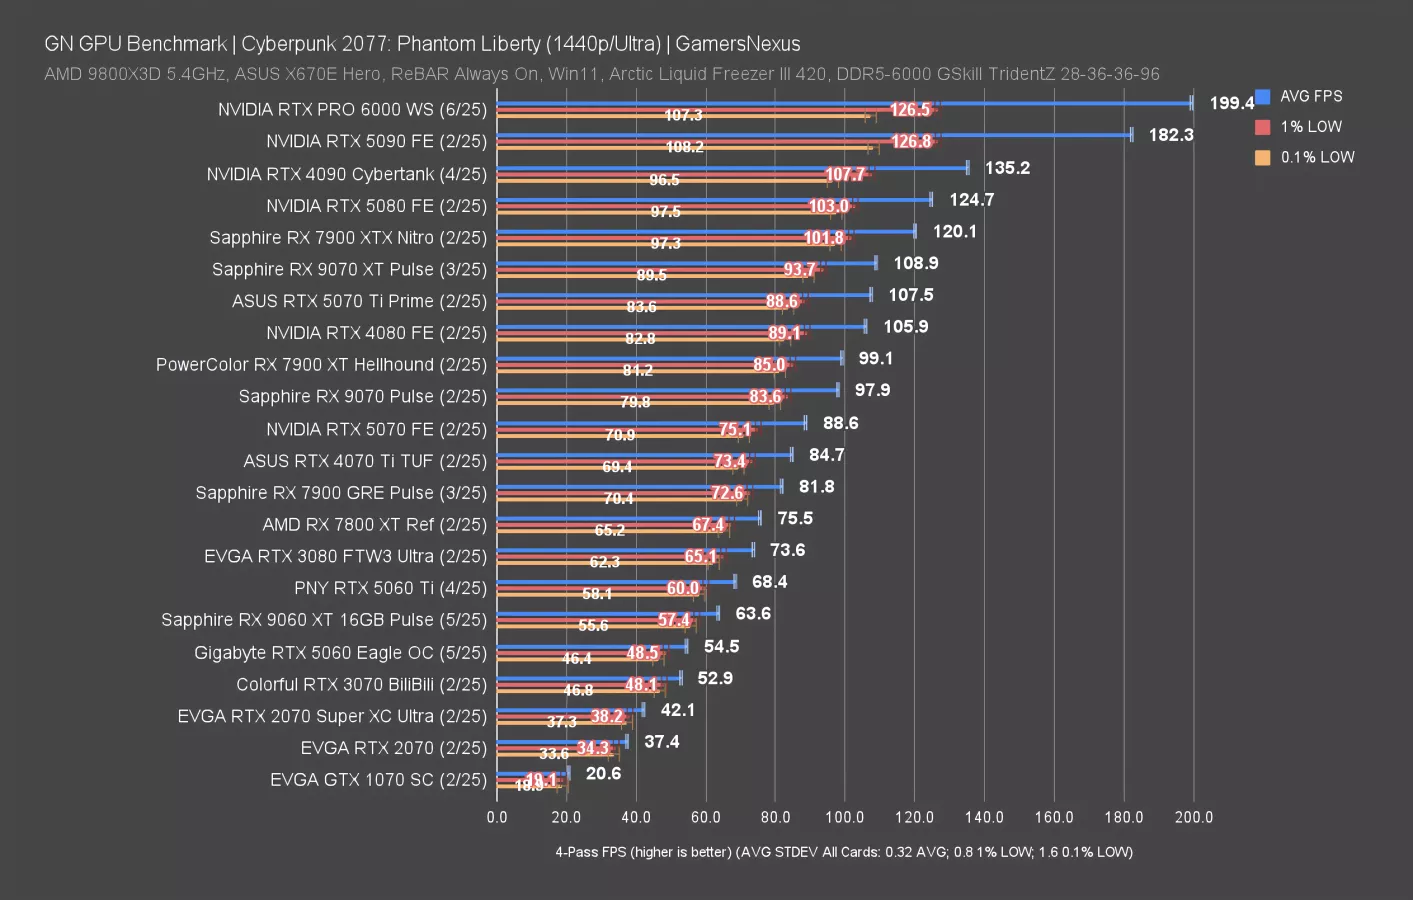
At 1440p, the PRO 6000 ran at nearly 200 FPS AVG, about 9.4% ahead of the 5090. This remains one of the larger gaps for 1440p, although again, it’s obviously not something anyone should remotely consider primarily for gaming. The 4090 is down at 135 FPS AVG, meaning the PRO 6000 leads it by 48%.
Cyberpunk 2077: Phantom Liberty - 1080p
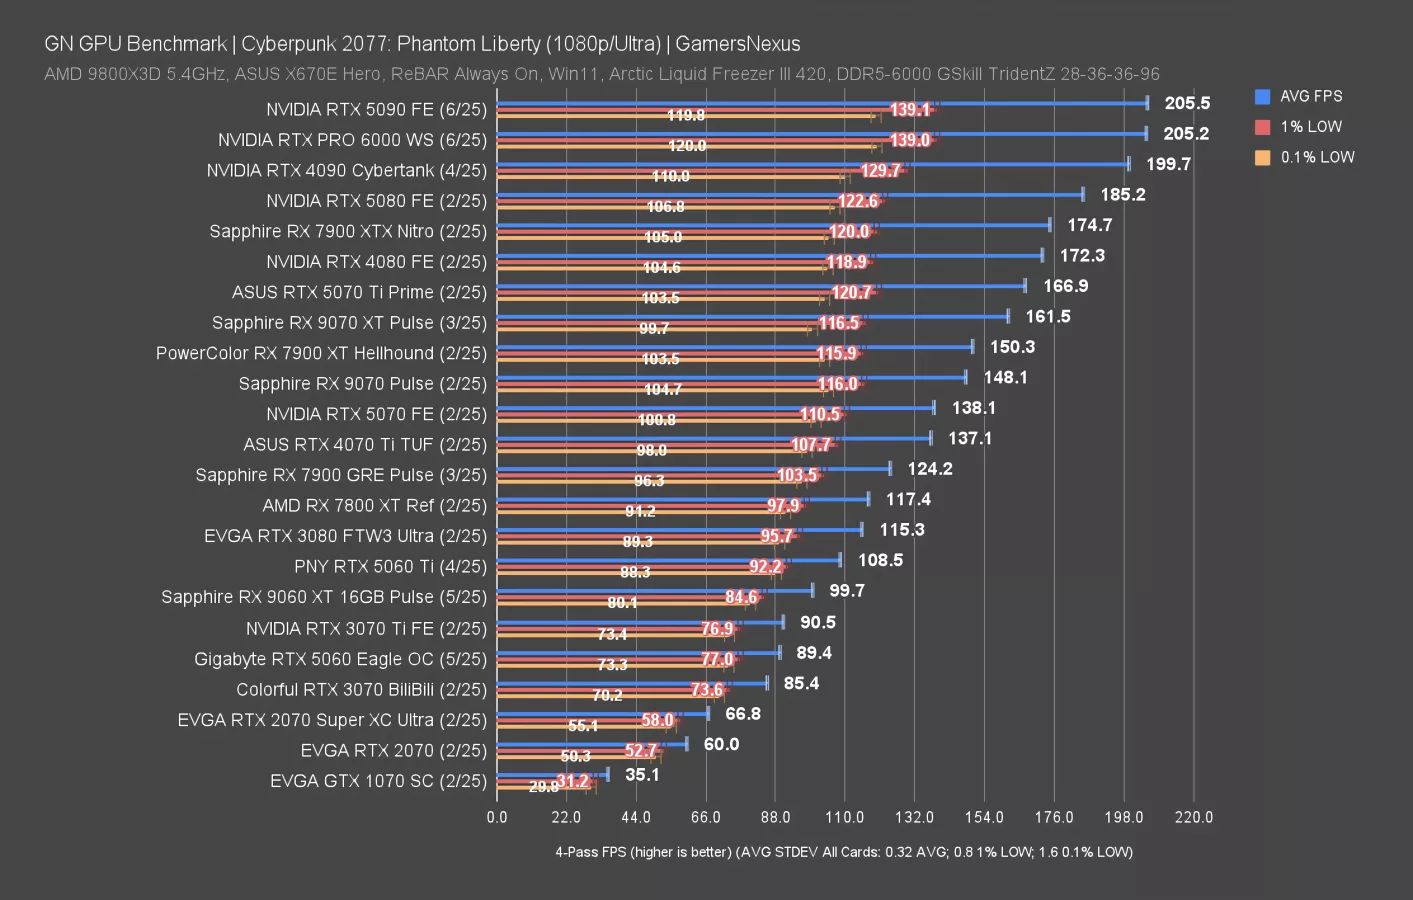
We’re leaving 1080p in because it’s the only place we see a bottleneck. Finally, we run into what seems like a CPU limit. The PRO 6000 and 5090 are at about the same level of performance, as is the 4090. Everything here is limited. That means our 1440p results were at least somewhat limited as well, with minimally the upper bound bouncing off of limits.
NVIDIA RTX 6000 Ray Tracing Benchmarks
Ray tracing benchmarks are next.
Ray Tracing - Black Myth: Wukong 4K
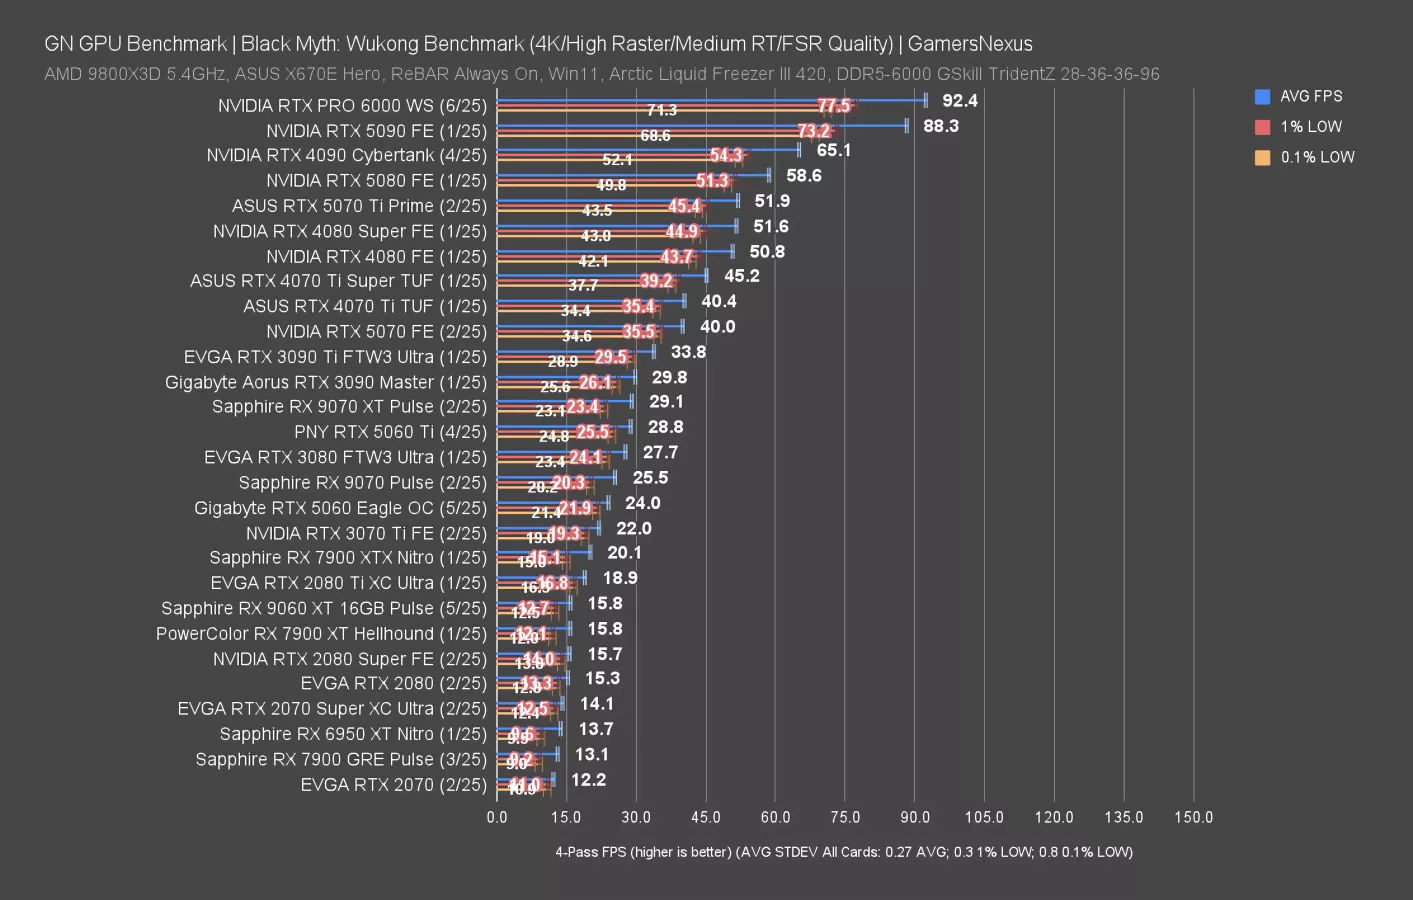
We’ll start with the heaviest one, which is Black Myth: Wukong at 4K with upscaling.
In this test, the RTX PRO 6000 ran at 92 FPS AVG, which was barely any different from the 88 FPS observed on the 5090. We’re under 5% of uplift here. It’ll be interesting to see if RT workloads don’t produce as much change as rasterization.
Ray Tracing - Black Myth: Wukong 1440p
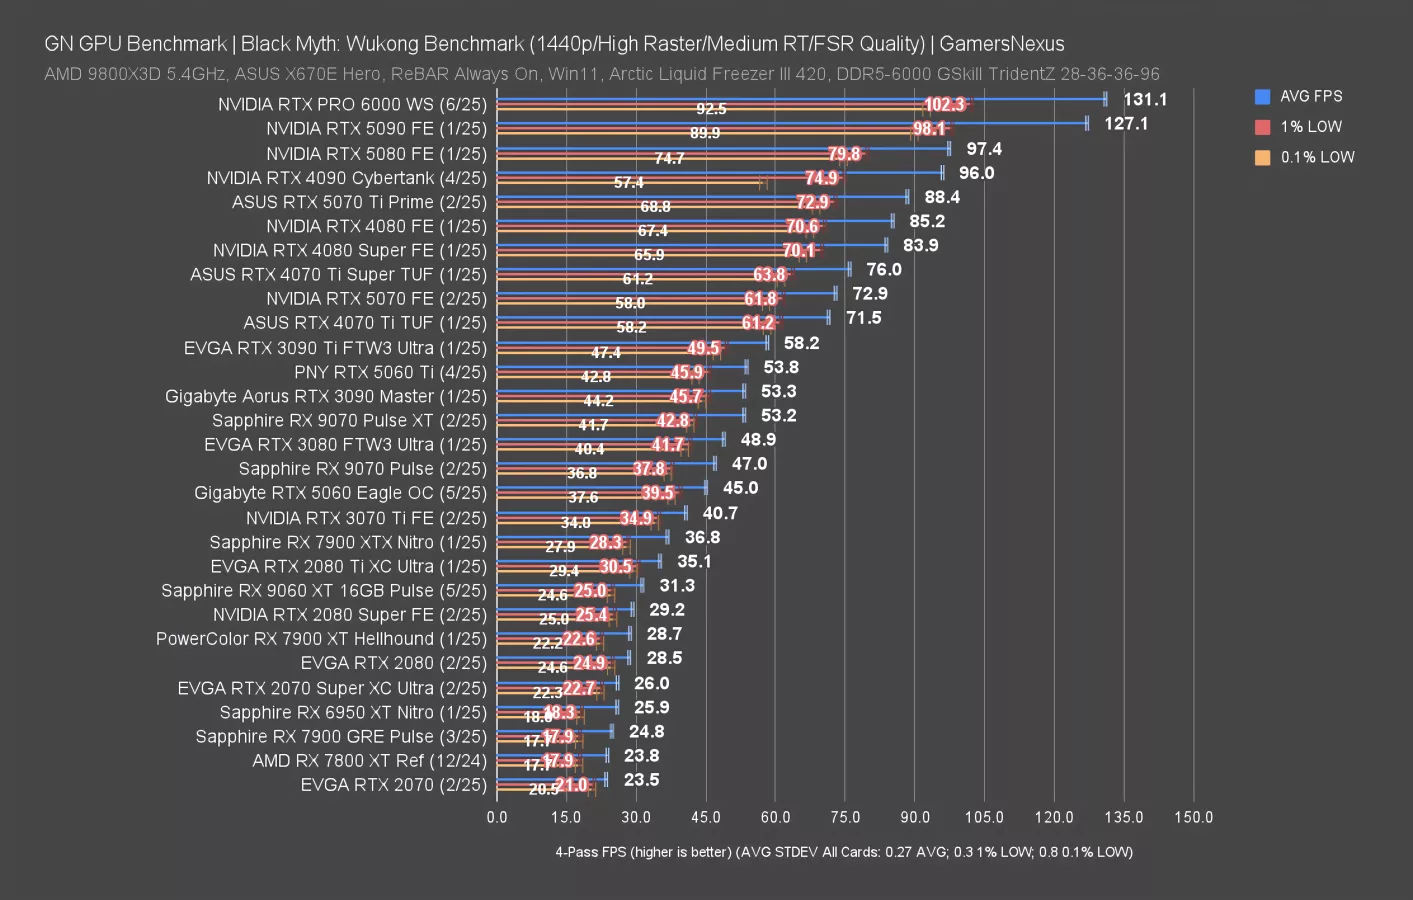
At 1440p upscaled, the RTX PRO 6000 ran at 131 FPS AVG, leading the 5090 by just 3%. There’s just not much change in this test in general.
We’ll skip 1080p given the lack of improvement.
Ray Tracing - Cyberpunk 2077 (4K, RT Medium)
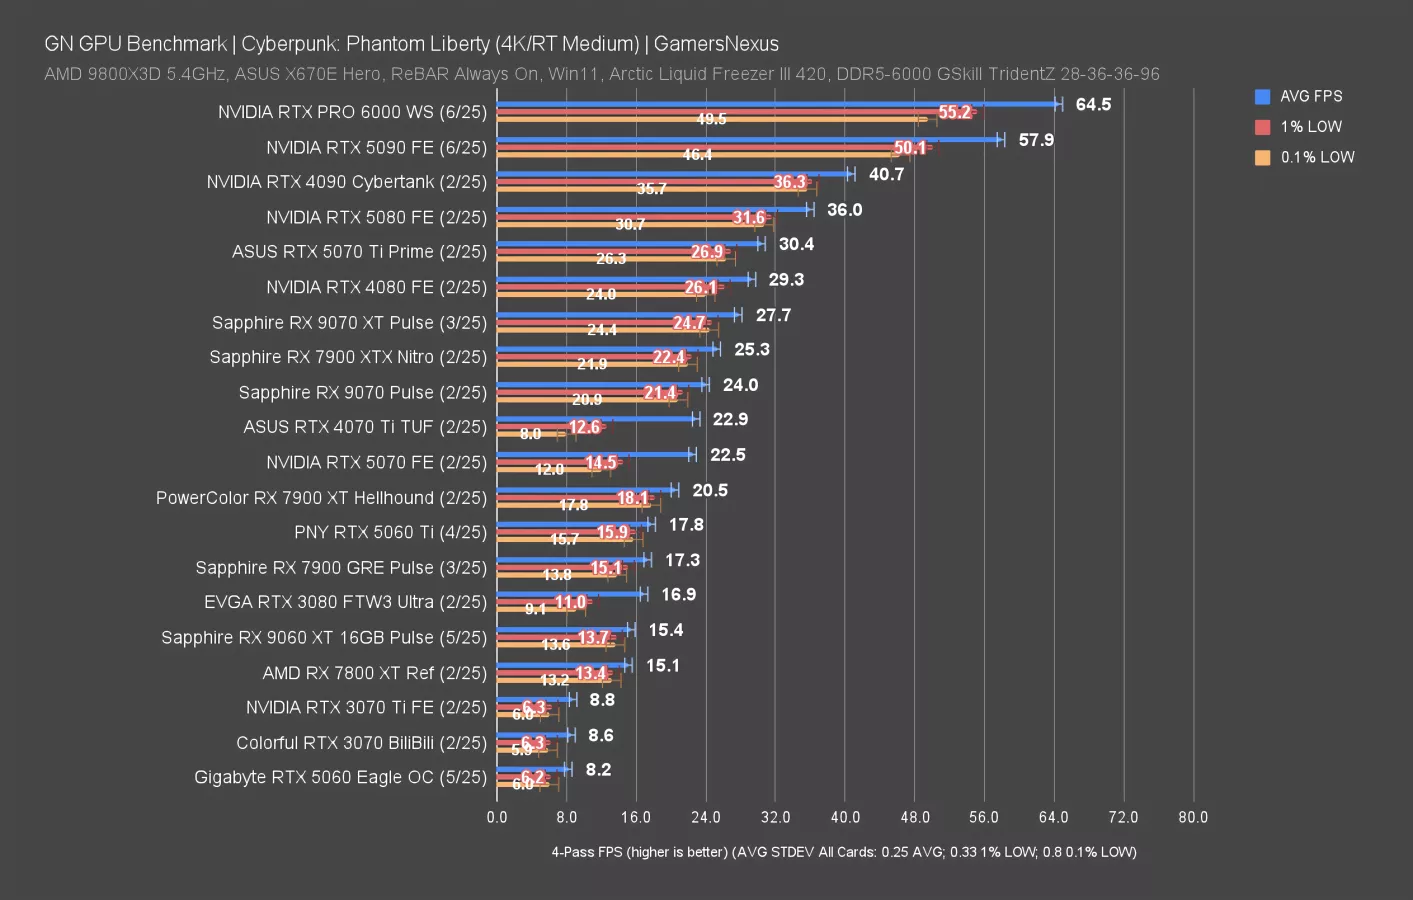
Cyberpunk at 4K with RT Medium is next. In this test, the RTX PRO 6000 ran at 65 FPS AVG, leading the 5090 by 11%. That’s roughly in-line with what we saw in Cyberpunk rasterized. This is without any upscaling, which may be helping the PRO card’s relative gain.
And finally, unlike what we saw in the 5060 and 5070 class cards with significant VRAM limitations harming low performance, the PRO doesn’t have any VRAM issues. This is clearly the solution. The solution is to buy $8K-$11K video cards.
As before, note that some cards with low VRAM, like the 5070 and 4070 Ti, have averages that look better than the reality (even though the averages are also not great).
Ray Tracing - Cyberpunk 2077 (4K, RT Ultra)
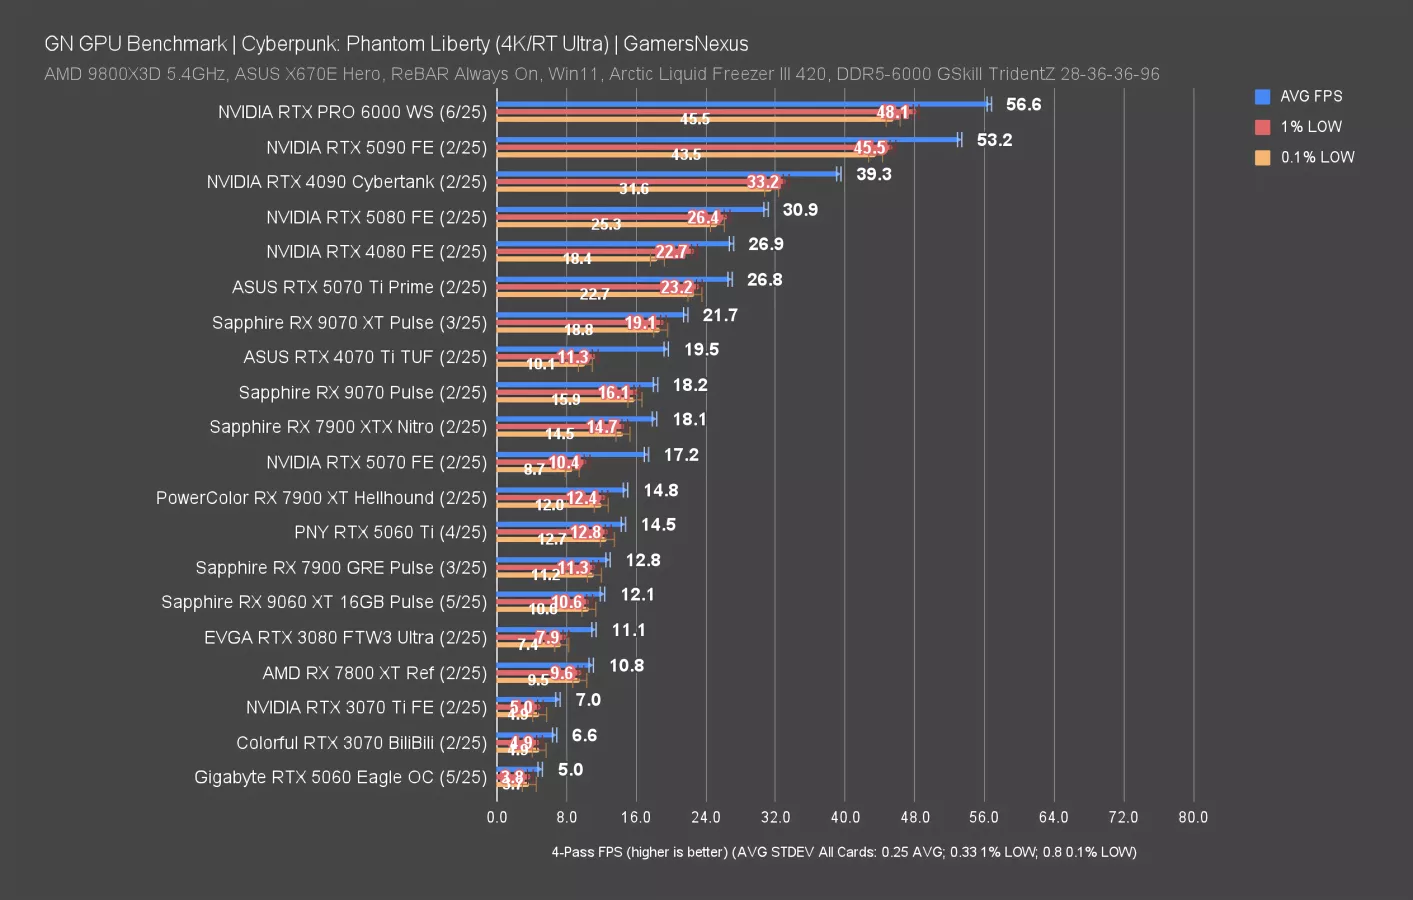
4K with RT Ultra is next. We almost never publish this test since it’s so intensive that it becomes somewhat useless, but it’s interesting here.
The RTX PRO 6000 ran at 56.6 FPS AVG, leading the 5090 by 6.4%. That’s a significant drop from what we saw at RT Medium, indicating that the increase in intensity for the RT workload is minimizing the benefit of other aspects of the PRO 6000’s improvements. It is getting overrun by the RT workload intensity. The lead over the 4090 is about 44% here for the 6000, with the 5090 leading the 4090 by 35%.
Note that the lower portion of this chart is unreliable for average framerate since the cards are all unplayable and stuttering. This can sometimes be due to exceeding VRAM limitations, such as on the RTX 5070. The average looks far better than the reality, even though the average is also unplayable.
Ray Tracing - Cyberpunk 2077 (1080p, RT Medium)
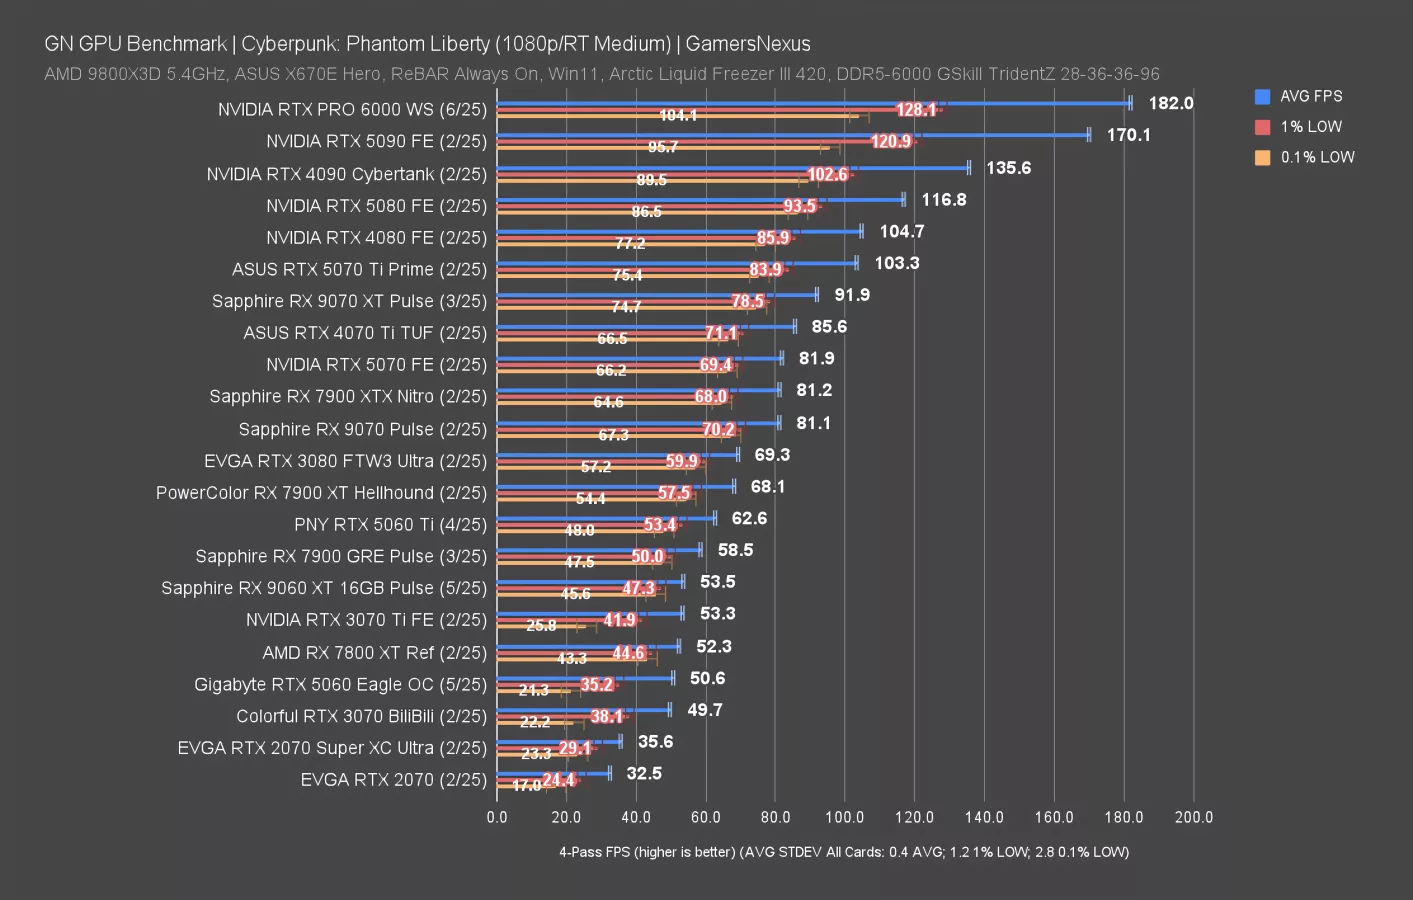
At 1080p with RT Medium, the PRO 6000 ran at 182 FPS AVG with lows paced proportionally. That has it ahead of the 5090 by about 12 FPS AVG, or about 7%.
Ray Tracing - Dragon’s Dogma 2 4K
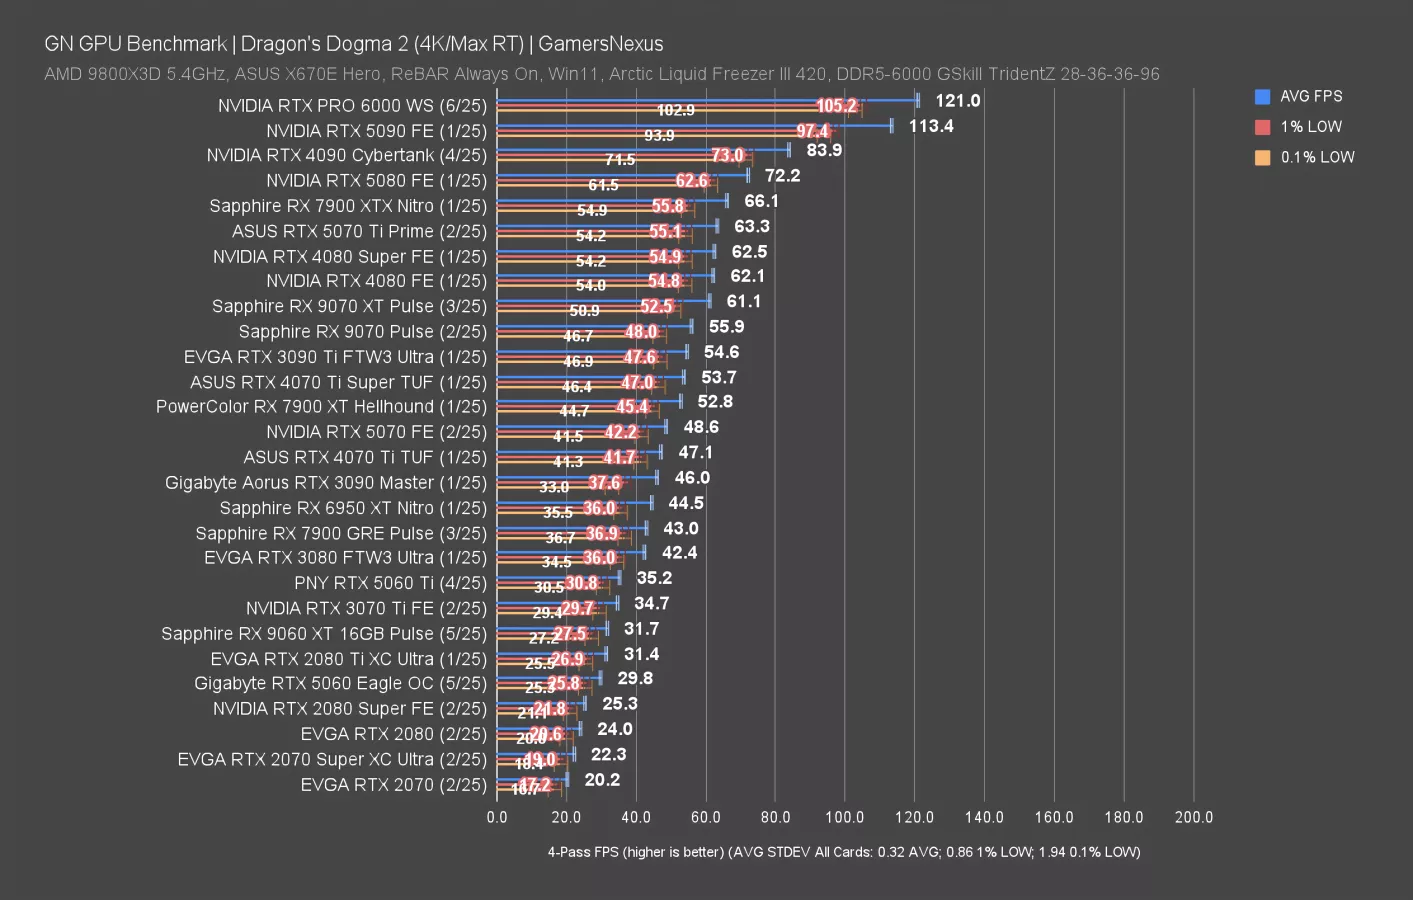
Dragon’s Dogma 2 with ray tracing and without upscaling is next. Tested at 4K native, the RTX PRO 6000 at 121 FPS AVG leads the 5090 FE by about 7% in average framerate. This is starting to match a pattern, so we’ll let this be our last game test. Let’s move on to something else.
RTX 6000 AI Benchmark Charts:
Now, we'll get into some of our first ever LLM and machine learning benchmarks. As a disclaimer, we know enough to get some charts together to run some benchmarks where we feel like the controls of the test environment are good, but we do not yet know enough to have a full picture of capabilities outside of the test suite that we're using currently.
We've tested with LM Studio, 3DMark testing, and ML Perf. We kind of settled on one set just to experiment for now. And this is our disclosure that we are experimenting with new testing, which means that the charts get the experimental chart label on top of them. And that's just so everyone's aware that these are not up to our full confidence standards of our normal benchmarks that we do all the time because we're still learning here.
LM Studio Testing
For our LM Studio testing, we recorded the response speeds from 8 different models that incrementally increase in size.
We’ll get to larger models in a second.
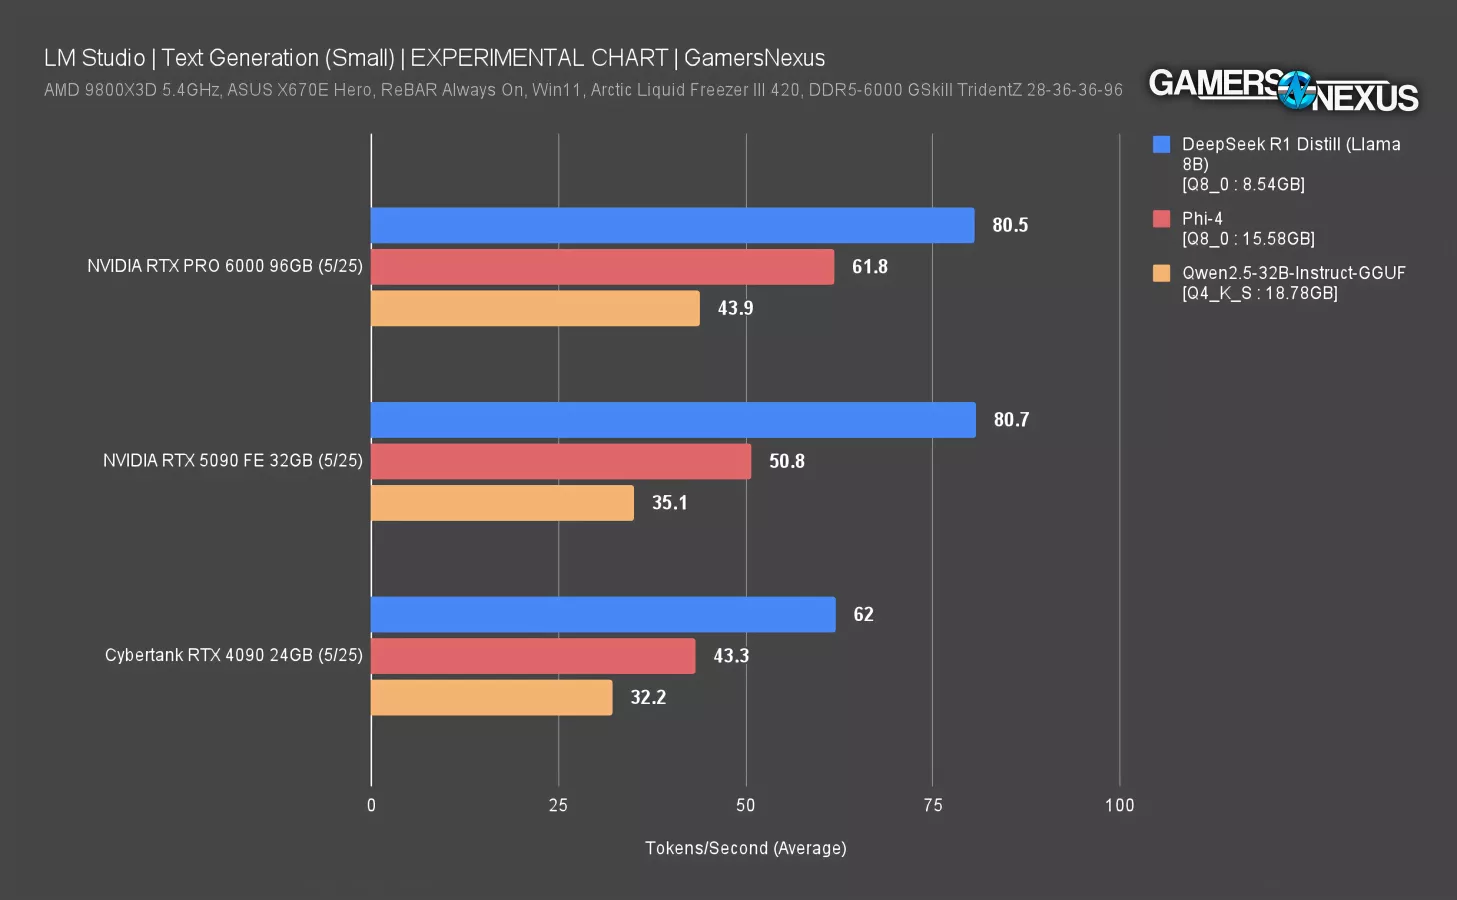
Our first chart illustrates the AVG tokens/second results from the three smaller models – ranging from 8.5GB to around 19GB in size. We think these first three are more representative of like-for-like tests compared to some other models we’ll be going over today – because any of the GPUs on our chart can load these models without being limited by VRAM capacity.
In DeepSeek Llama 8B Distil, the RTX PRO 6000 is functionally tied for first place with the RTX 5090 FE – both with response speeds of roughly 81 tokens/second, improving on the 4090’s 62 tokens/second AVG by about 30%.
In 8-bit Phi-4, the PRO 6000 puts some distance between its own tokens/second AVG of 62 and the 5090's 51 tokens/second AVG, showing a 22% improvement. Compared to the 4090, the RTX PRO improves by about 43%.
In Qwen 2.5, the PRO 6000's 44 tokens/second AVG sees improvements of 25% over the 5090 and 37% over the 4090.
Text Generation
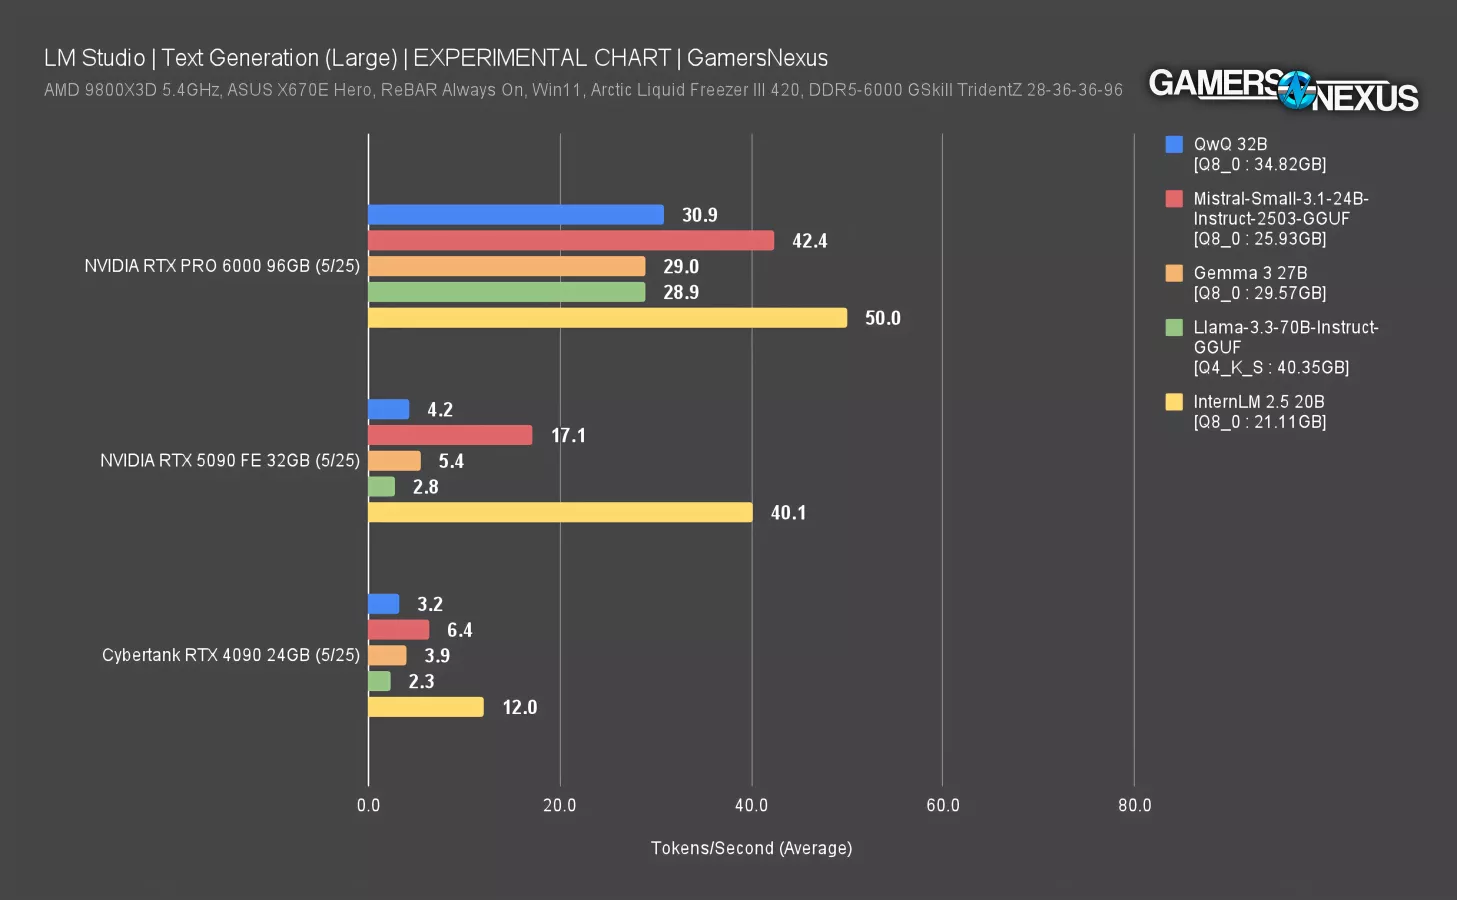
Moving to our next chart, we’ll really start to see performance gaps begin to widen as VRAM limitations take effect.
The RTX 6000 tops the chart in all five models.
In InternLM, the RTX PRO 6000's 50 tokens/second AVG improves upon the 5090's 40 by 25% and upon the standard 24GB 4090 by 319%.
In Mistral Small 26GB, the 4090 and 5090 see much sharper performance decreases than the PRO 6000. The workstation GPU achieves 42.4 tokens/second AVG, or 147% improved from the 5090’s 17 and 560% greater than the 4090’s AVG of 6.4.
Once we reach Gemma 3 27B, the workstation card really starts to separate itself from the lowly $2,000 gaming cards. In this model, the RTX PRO 6000 achieves a 29 tokens/second AVG, with the 5090 only reaching 5 and the 4090 only seeing 4 tokens/second, give or take some change. The comparisons remain largely the same in QwQ 32B.
In the final Llama 3.3 70b Q4_K_S model we tested, the RTX PRO 6000 achieved its greatest lead yet. The workstation card sees improvements of 928% over the 5090 and 1141% over the standard 4090.
A more simplistic way to interpret this data is: At a certain point, the other cards run out of VRAM, while the workstation GPU doesn’t even use half of its VRAM in the largest Llama model we tested. You could expand beyond this as well, of course, but that’s the extent of our experimentation for now.
NVIDIA RTX 6000 Conclusion

That's it for the RTX Pro 6000 test. It's a review in a way but at the same time, we'd want to do a lot more tests in the ML category to really have a fully-fledged review. This piece has been an exciting experiment for us.
The biggest discovery for us was seeing no liquid metal while we were doing the tear-down. That was probably known, but it’s not something that we had looked into. So that was interesting. We could see why NVIDIA did that for reliability reasons. We could also see it for liability reasons if the company is worried about liquid metal leaking out onto expensive servers. We kind of doubt this was done to save on costs, though maybe it was done for liability costs, but it just doesn't seem like NVIDIA is going to try and save a buck on this kind of card.
We spoke to Wendell from Level1Techs and he noted that there's some apparent buggy behavior with Blackwell right now and so that's still getting updated and perhaps there's performance optimizations that could be done. On the side that we're familiar with, which is the gaming aspect, seeing 5 to 14% improvement is mostly useful not because you should ever in any way consider this card for gaming, because that would be an insane waste of money if that's all you would do with it, but more because it shows us that there's room left in the 9800X3D for scaling, which is pretty cool.