We test the 9950X against the R9 7950X, R7 7800X3D, R7 9700X, 14900K, 14700K, and more
The Highlights
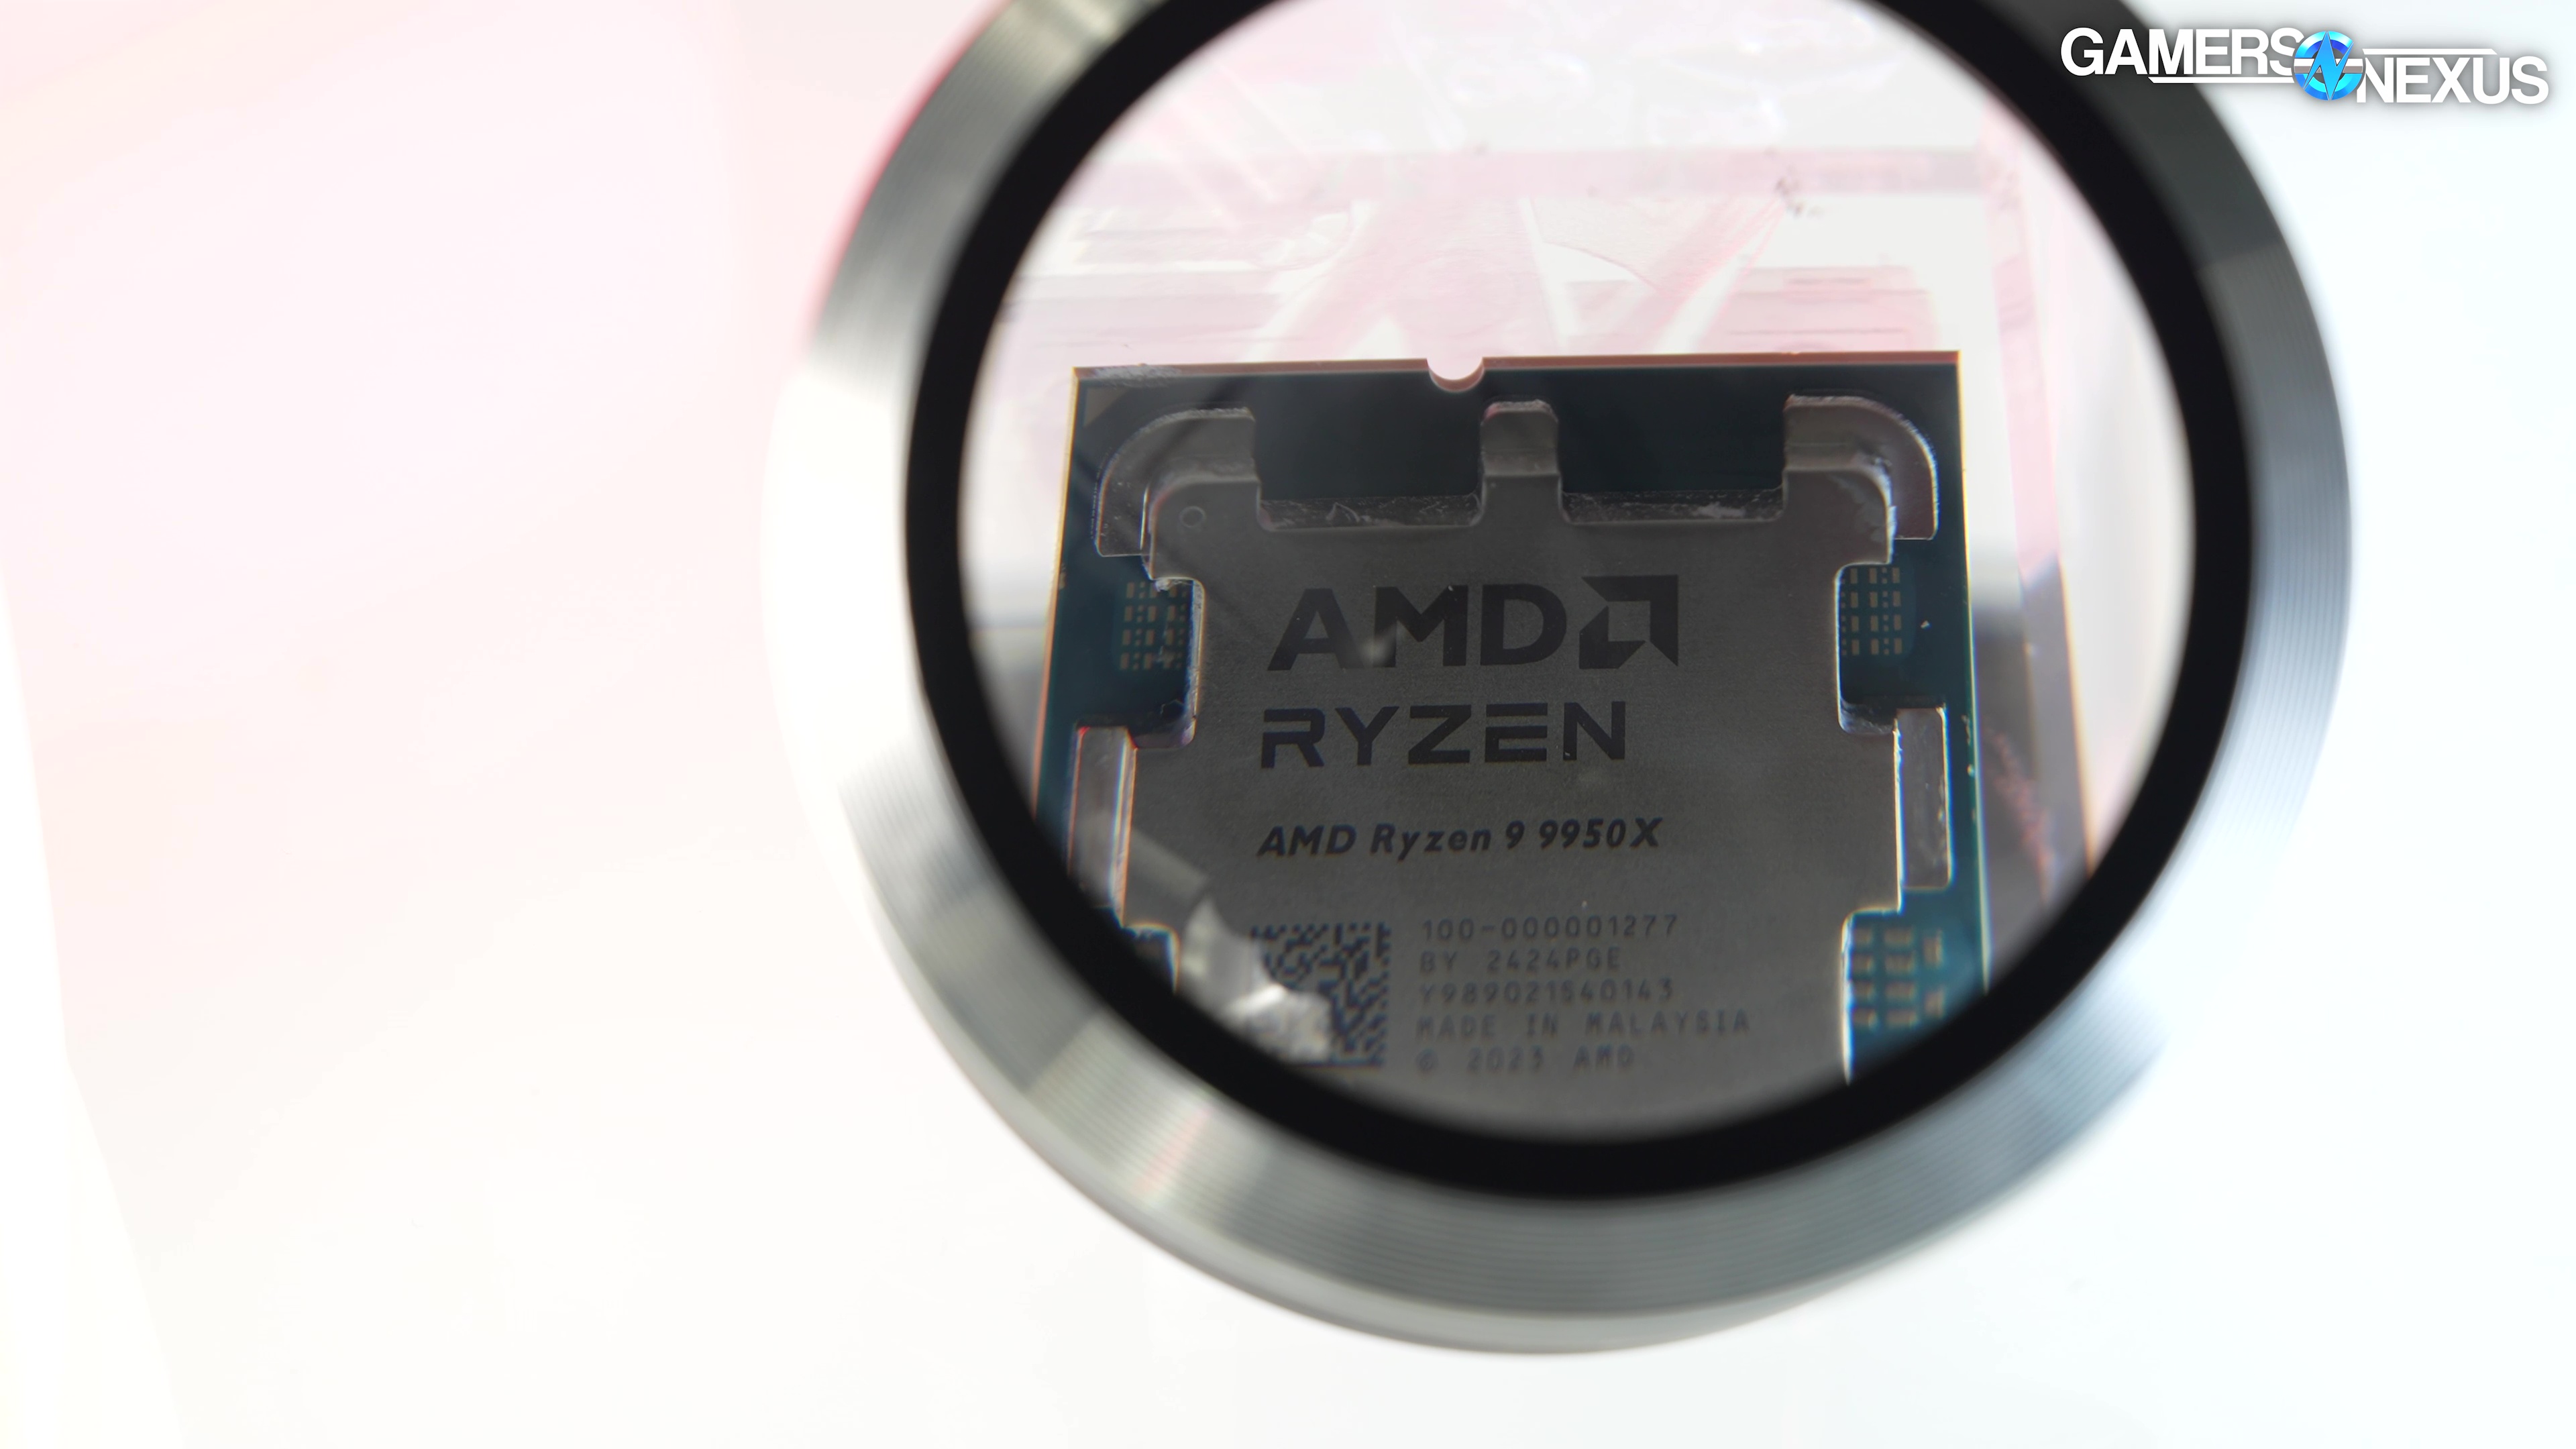
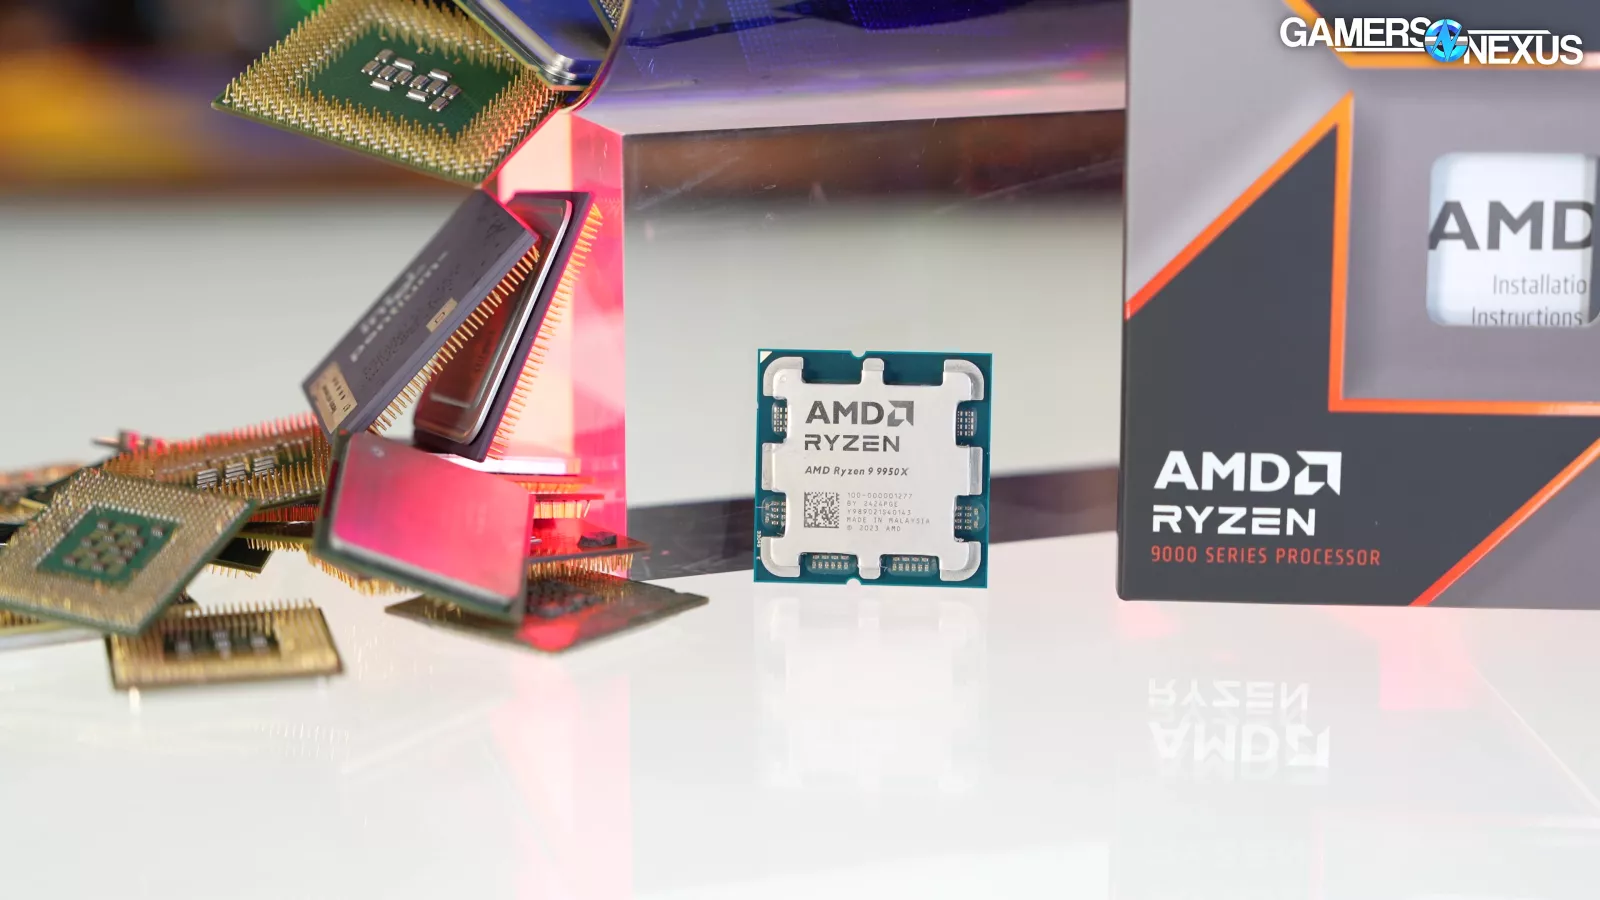
- The Ryzen 9 9950X is a 16-core/32-thread Zen 5-based CPU
- For production workloads, the 7950X is generally a far better value than the 9950X
- Although the 9950X is one of the best CPUs for workstation applications, the 7800X3D remains the best overall gaming CPU
- Original MSRP: $650
- Release Date: August 15, 2024
Table of Contents
- AutoTOC

Intro
We’re back with the 9950X, following a hell of a long day working on a massive CPU efficiency investigation with AMD Zen 5. You should check that out if you haven’t -- it has a lot of unique data in it.
But the 9950X is up for review now. Here’s a quick pricing update:
The 9950X is a $650 CPU. Direct alternatives might include the AMD R9 7950X at $520, the Threadripper 7960X as a “cheap” HEDT part at $1400, or possibly the upcoming 9900X at $500. The existing 7900X is $360 though, making it possibly a better contender. Finally, Intel’s 14900K is $546 -- but again, we have currently paused Intel recommendations until we can evaluate the new microcode fully.
Editor's note: This was originally published on August 14, 2024 as a video. This content has been adapted to written format for this article and is unchanged from the original publication.
Credits
Test Lead, Host, Writing
Steve Burke
Testing
Patrick Lathan
Mike Gaglione
Jeremy Clayton
Video Editing
Vitalii Makhnovets
Writing, Web Editing
Jimmy Thang
Following the missed timelines for review units and later recall of the parts, AMD’s newest round of communication mishaps include not telling the media that the 9950X and 9900X (watch our review) require a specialized Windows setup for core parking similar to the 7950X3D and 7900X3D. Those CPUs have always needed it, but the non-3D 7900X and 7950X did not. This is a change for the 9950X and 9900X, which meant that most reviewers had the CPUs for about 5 days before AMD communicated this requirement, causing everyone doing it right to throw out their data and re-test.
For this review, we’ll be focused on production applications and power, since gaming is really only needed to make sure it’s functioning properly. Let’s get started.
The 9950X is a 16C/32T part on the Zen 5 architecture, which means it sockets into AM5 motherboards with chipsets in the 600-series, such as X670E, and the upcoming 800-series. For reviews, we’re using an X670E motherboard as the X870E boards are not available yet.
This is a list of CPUs that require the setup we are about to describe. The ONLY processors that require special care are the 7950X3D, 7900X3D, 9900X, and 9950X. The non-3D 7950X (watch our review here) and 7900X (watch our review)do not get this treatment.
Core parking is the behavior wherein half of the CPU’s cores are “parked,” or are specifically unused and avoided, when running applications that would benefit from instead running on a single CCD.
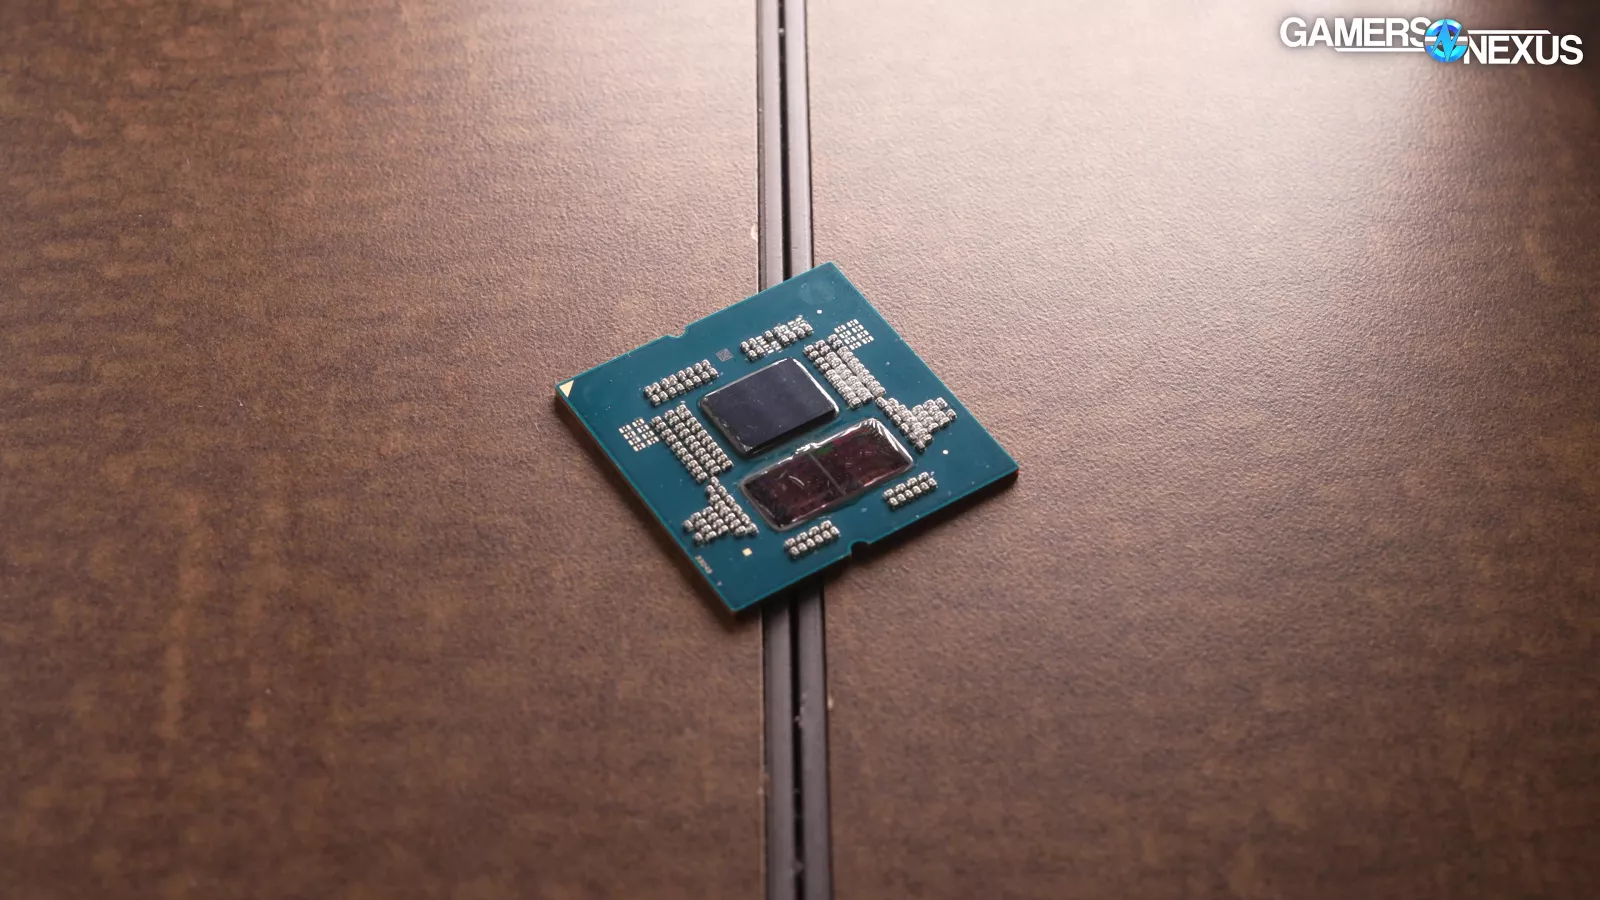
The affected AMD CPUs have two CCDs, or two chiplets in addition to the I/O die chiplet. CPUs like the 7800X3D only have a single chiplet which also has the extra cache.
With the 7950X3D (watch our review) and 7900X3D (watch our review), the reason you’d park cores is because the extra cache is on one CCD. BIOS can be set to favor the CCD with higher frequency or with more cache, but you should be using the chipset drivers for all of this. If a game is bouncing load indiscriminately between cores spread across two very different chiplets, it is possible that performance is worse. Core parking is supposed to fix this, and typically, it does a pretty good job.
If you were to force core parking on a CPU that doesn’t require it, it is very likely that you hurt the performance significantly. This could cut it by double-digit percentages. Likewise, not enabling it on CPUs that require it could hurt performance by double-digit percentages.
We’ll talk about how to configure it first, then get into some downsides now that it’s required on the 9950X and 9900X.
Core Parking
There are a few steps required in order to set this up.
- First, install AMD's latest chipset driver with all features.
- Update Windows and enable Microsoft's Game Mode.
- Enable Game Bar, open the Microsoft Store library, and click on Game Bar to check that it's fully updated.
- Go to the Control Panel (the real one, not the Settings app), Power Options, and select the Balanced power plan. Balanced is required. We normally use Performance for our benchmarks, but not for chips that require this. If you want to, AMD notes that afterwards you can go into the Settings app (not the Control Panel), System, Power, and change Power Mode to Best Performance.
- The system should handle itself after this, but to be sure, reboot, then run this command: "start /wait Rundll32.exe advapi32.dll,ProcessIdleTasks".
- Leave the mouse and keyboard alone and let the command finish running. It can take several minutes, so you may want to disable sleeping and screen deactivation beforehand.
- To verify that all of this is working, you can run the command powercfg.exe /queryprofile scheme_current profile_gamemode CPMinCores in an elevated command prompt. This will either say that no profile is found, in which case core parking is off, or it will tell you about the core parking configuration. Save this video and this command for the future, as if you ever upgrade in-socket to a CPU that requires it, you’ll want to know that things are working
Game Bar is the app that's responsible for deciding whether applications are games or not, which then activates Game Mode, which then parks cores. To test it, you can open Resource Monitor, open Game Bar (Win+G), and check the "Remember this is a game" box. Relaunch Resource Monitor, then go to the CPU tab, and half the cores should say Parked.
Keep in mind that Microsoft's Game Bar is still a huge piece of crap, and we've seen the "Remember this is a game" box randomly checked and unable to be deactivated, so play with this option at your own risk.
These steps apply only when moving TO one of these four CPUs. If you boot with one of these four CPUs and then later move to a CPU that doesn't require core parking, AMD's official advice is to reinstall Windows, or "you can try uninstalling then re-installing the AMD Chipset Driver as a workaround."
That’s the setup basics. Some BIOS and CPU combinations may also have an option for core parking behavior. You should set that to let the Driver do what it does: Drive.
As for other information that you may want for this review, you can check out our testing methodology notes (found in the 9700X review), basics of Zen 5 architecture, product details, and the efficiency deep-dive. For now, let’s get into the data for the 9950X.
Frequency
Frequency - All-Core
We’ll look at frequency first to make sure things are performing as expected.
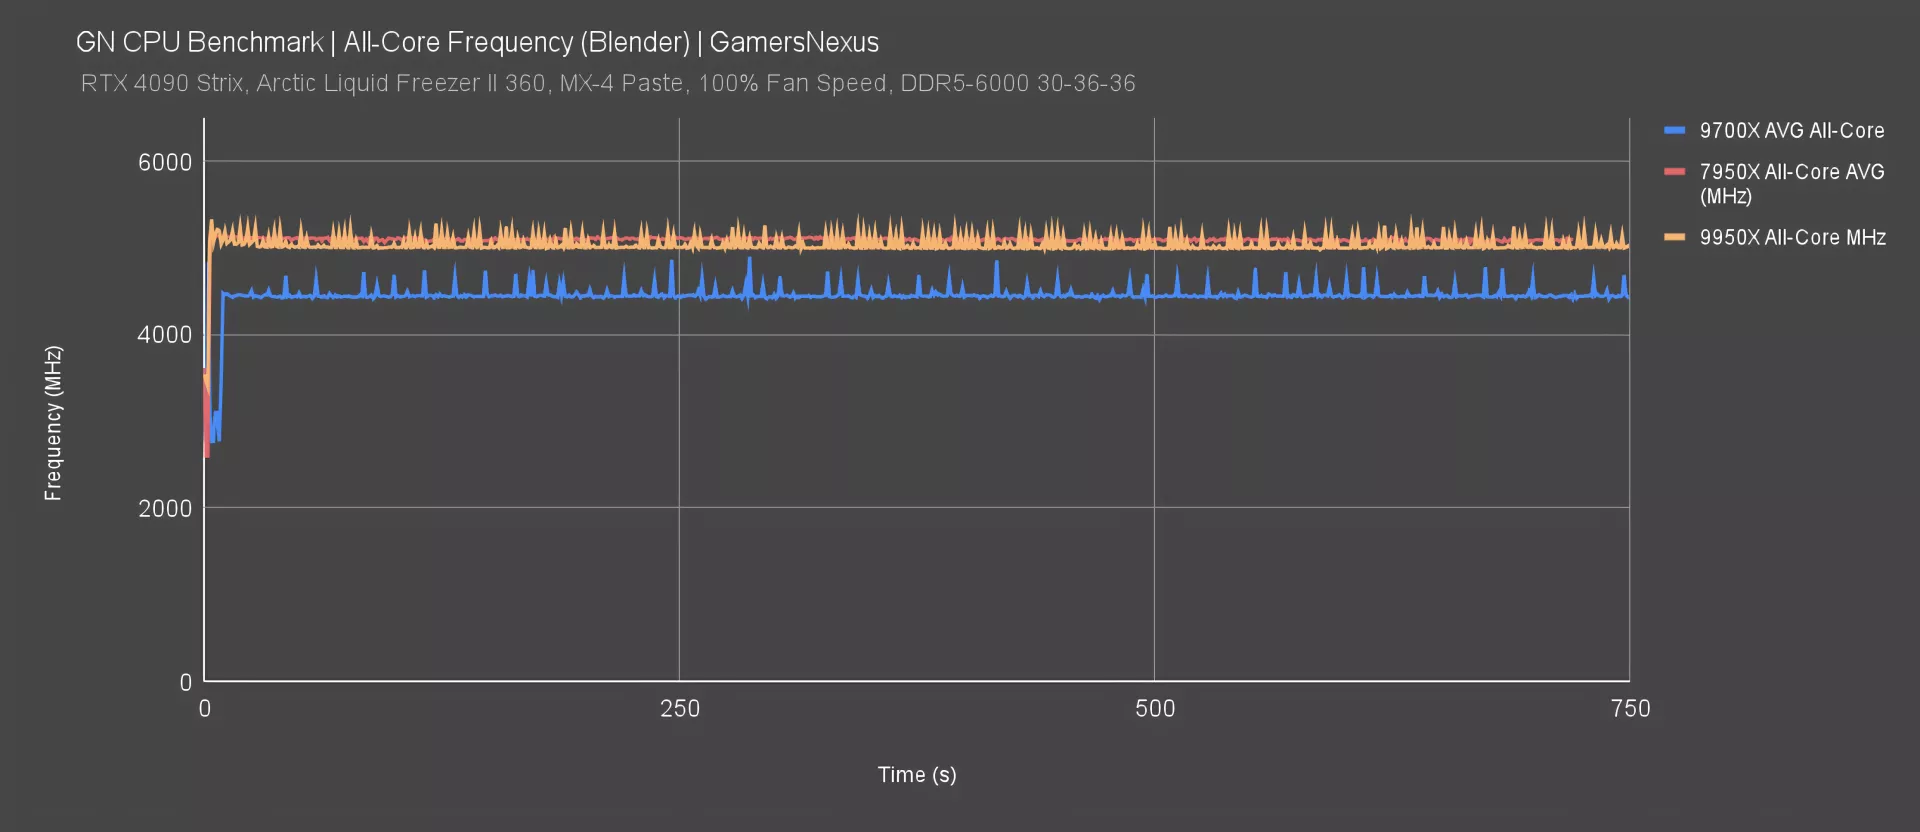
Here’s the all-core frequency when the CPU is fully engaged on every thread in Blender. The 9700X was around 4500MHz here, +/- 20MHz. The 7950X plotted around 5100MHz all-core previously.
As for the new 9950X, its higher power budget allows it to boost substantially higher than the 9700X. The 9950X ends up around the range of 5000MHz. It’s spiky, but generally speaking, doesn’t have any major dips. It is a little bit lower than the 7950X, though.
We’d expect that our 9950X should generally outperform our 9700X in gaming scenarios based on this, as it’s theoretically able to boost higher. The only reason this wouldn’t be the case is if something is going wrong with the core parking behavior.
Frequency - Single-Core
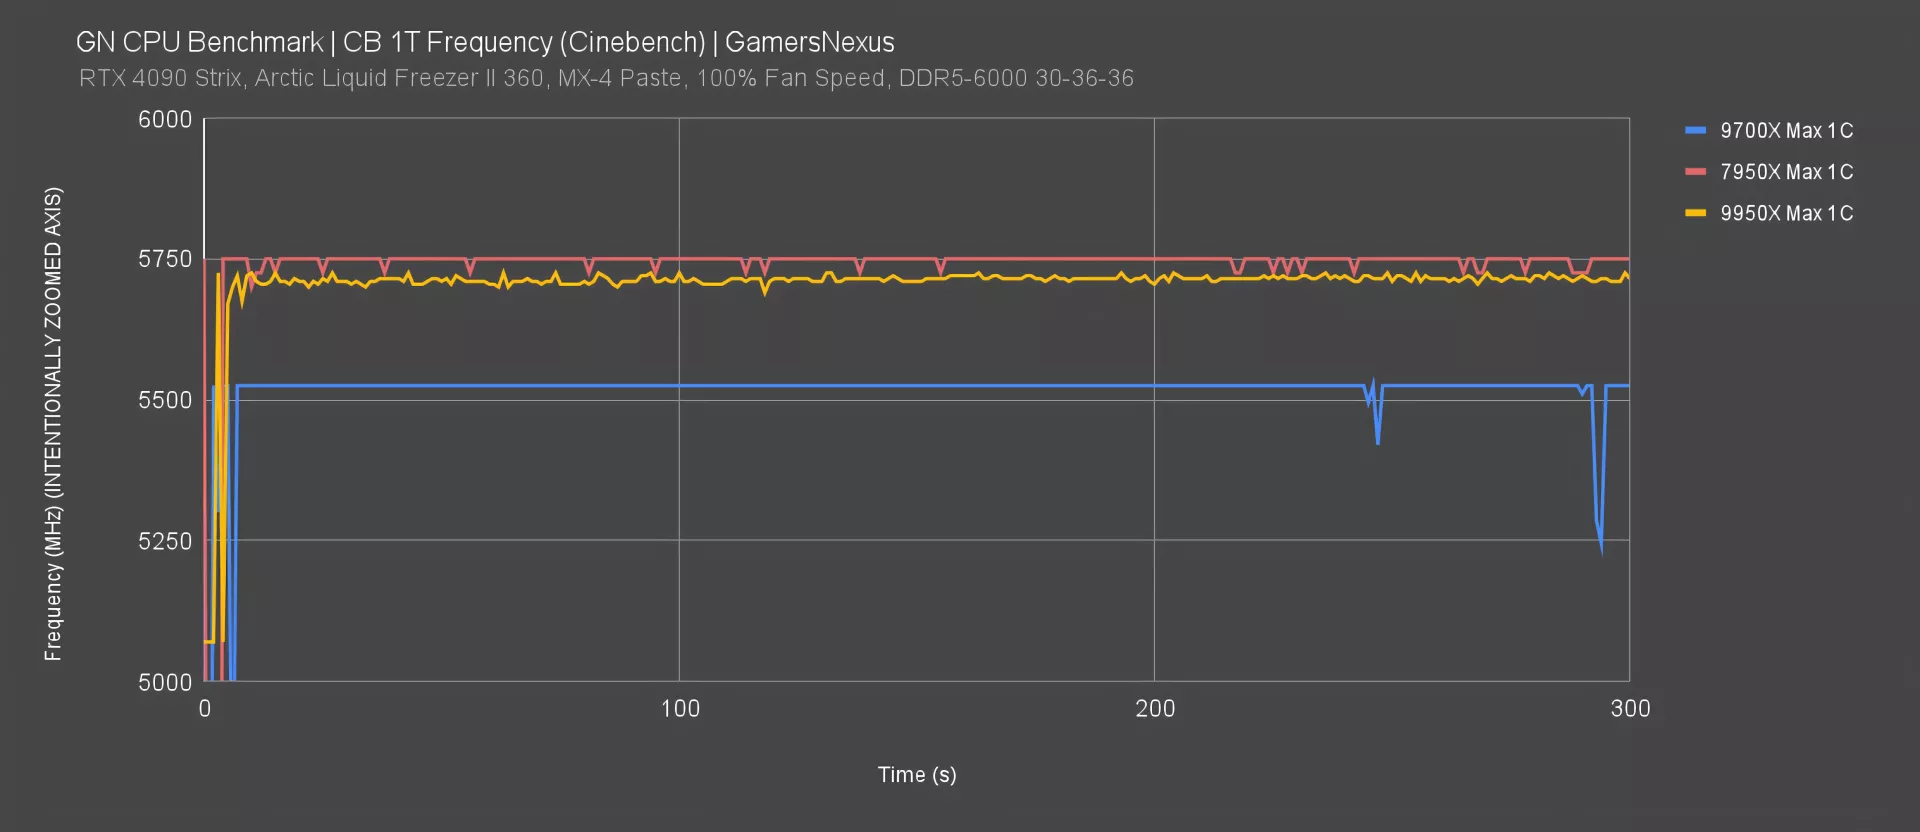
In single-core testing with Cinebench 1T, the 9700X maxed-out at 5525MHz in most scenarios. The 7950X ran at 5750MHz in the same testing, pushing relatively high.
The new 9950X is also in this area, with ours plotting at around 5710-5725MHz for a single-threaded load. As long as there’s architectural uplift, this should enable the 9950X to also outperform the 7950X in lightly threaded scenarios.
Power
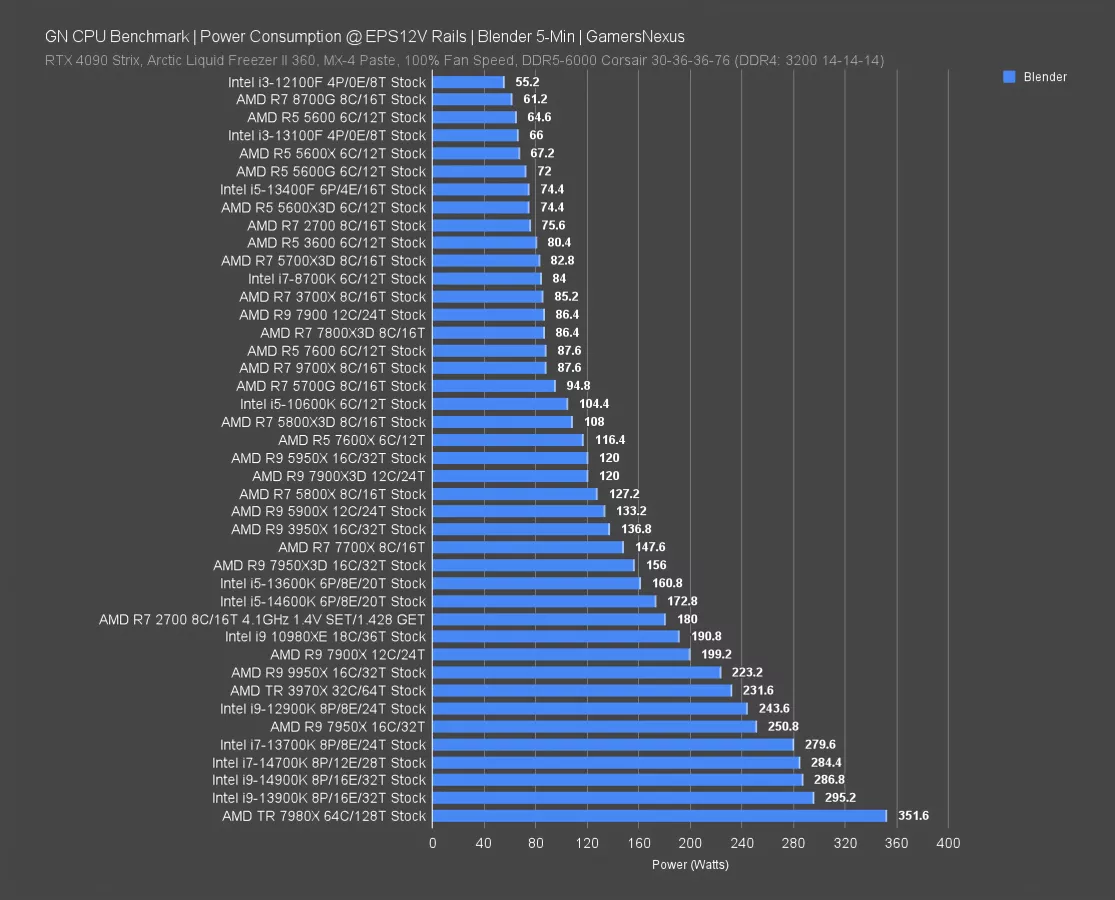
Power consumption at the EPS12V rails in just Blender is up now. This isn’t an efficiency chart, just the peak power consumption in a worst-case scenario. You’d use this to help buffer PSU requirements.
The 9950X pulled 223W in this benchmark, which is down from the 7950X’s 251W that we measured. The 9950X is about 70W below the 13900K here. Against the R7 family, the 9950X is pulling about 136W more than the 9700X and its 87.6W entry.
So far, the 9950X is down from what we measured on the 7950X. Compared to older generations, power remains up overall: The 3950X (watch our review) pulled 137W in this test with all cores loaded, with the 5950X at an impressive 120W. That’s why you’ll see the 5950X perform the same as the 3950X in some benchmarks, but with huge power reductions due to the quality of the voltage bin.
Efficiency - Blender
We’re starting with our efficiency benchmarks now. If you haven’t seen our efficiency deep-dive, definitely go check that out -- it’s extremely interesting and reveals a lot of CPU behaviors, but it also plotted the course for what we’re getting into in this review. We’ll run a limited set of additional efficiency benchmarks in this review.
All-core workloads are where the 9950X belongs, so we’ll start with production applications.
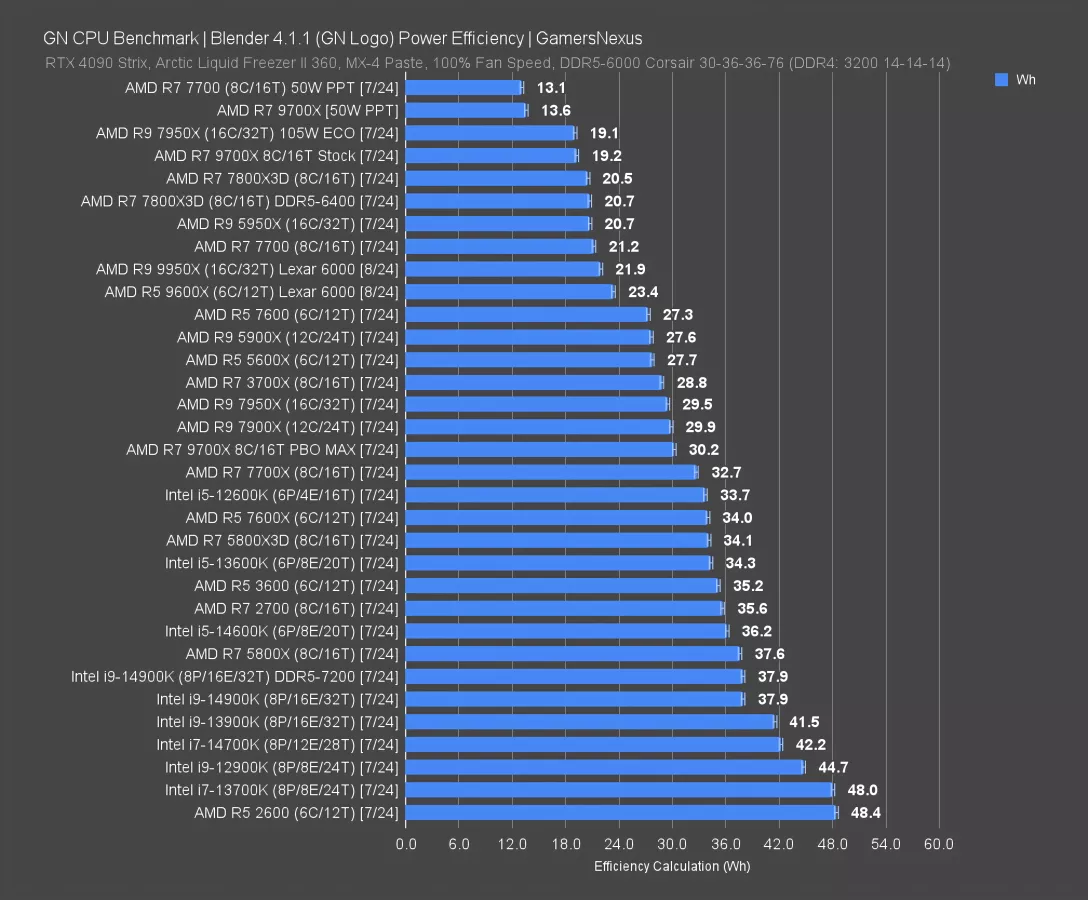
In Blender, the 9950X ends up neighbors with the 7700 and is less efficient than the old 5950X (watch our review), which was a remarkable chip for its era. The 7950X ranks at 29.5Wh here, so in the very least, the 9950X improves massively on that: Its improvement is a 26% reduction in Wh measurement for this specific test.
The 7950X with ECO Mode does phenomenally here, as it always has. With 105W ECO, which we found to be the ideal configuration rather than dropping down to 65W, the 19.1 result has it as the chart leader and just ahead of the 9700X and behind the PPT-limited entries.
AMD continues to improve in efficiency in this specific test, but as we saw in yesterday’s content, we need more than this.
Efficiency - 7-Zip
7-Zip is up now, then games.
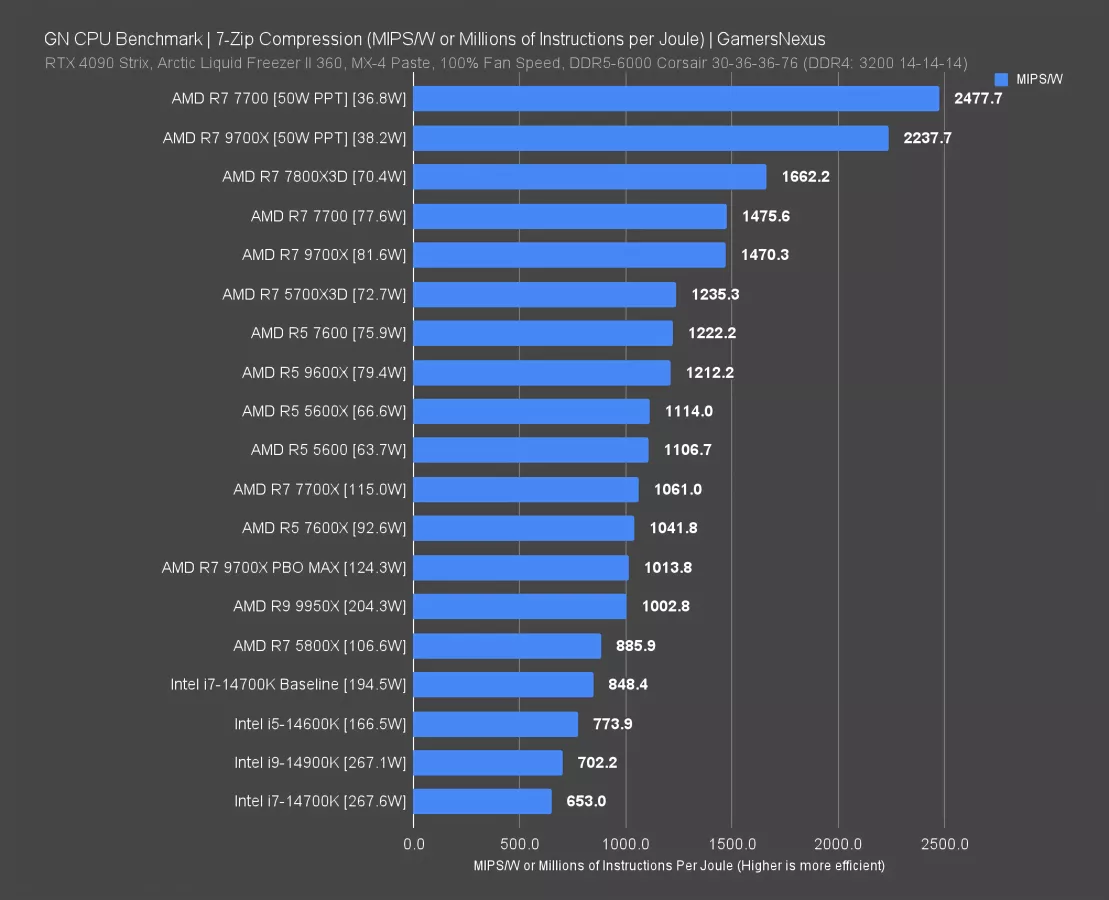
In 7-Zip compression, the 9950X ranked at 1003 MIPS/W, or millions of instructions per Joule. That has it as one of the least efficient on this chart. We haven’t run the 7950X through for these tests yet, so we don’t have comparative data. This is a brand new data set.
For things we can compare against: The 9950X ends up in about the same place as the 9700X with PBO blasted and behind the 7600X. Part of this may be explainable by hitting other non-core bottlenecks and limiting its total performance.
Efficiency - Games (FFXIV)
Now for games.
Final Fantasy is one of the ones that had more interesting behavior, especially on some of the 7000-series CPUs. That’s explained in yesterday’s video.
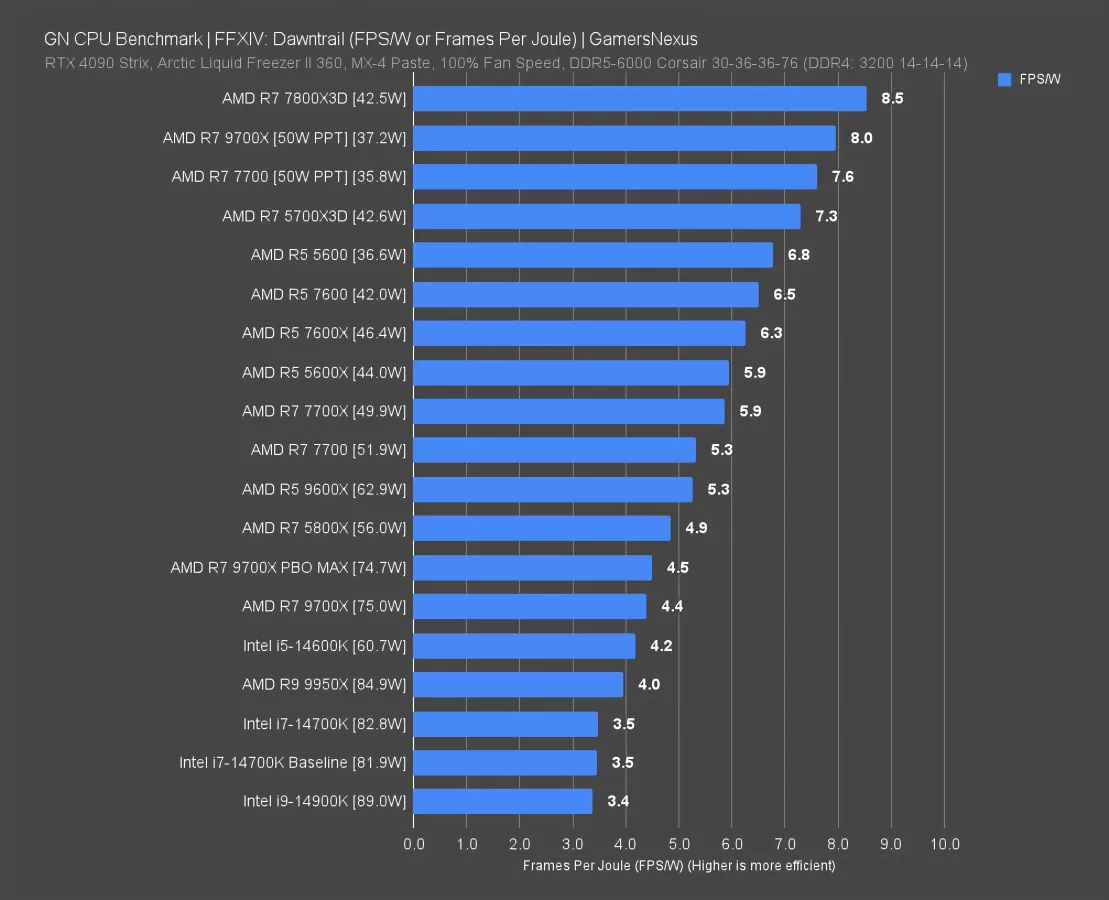
For the 9950X, the CPU ended up pulling about 85W, or 10W more than the 9700X, but obviously far less than what we’d see in all-core work. That extra TDP gives it extra power budget, even though half the CPU is parked. The end result is overall good performance in an absolute sense, but less efficient operation. The 9950X outdoes the 14700K and 14900K, but underperforms against everything else.
Efficiency - Games (Phantom Liberty)
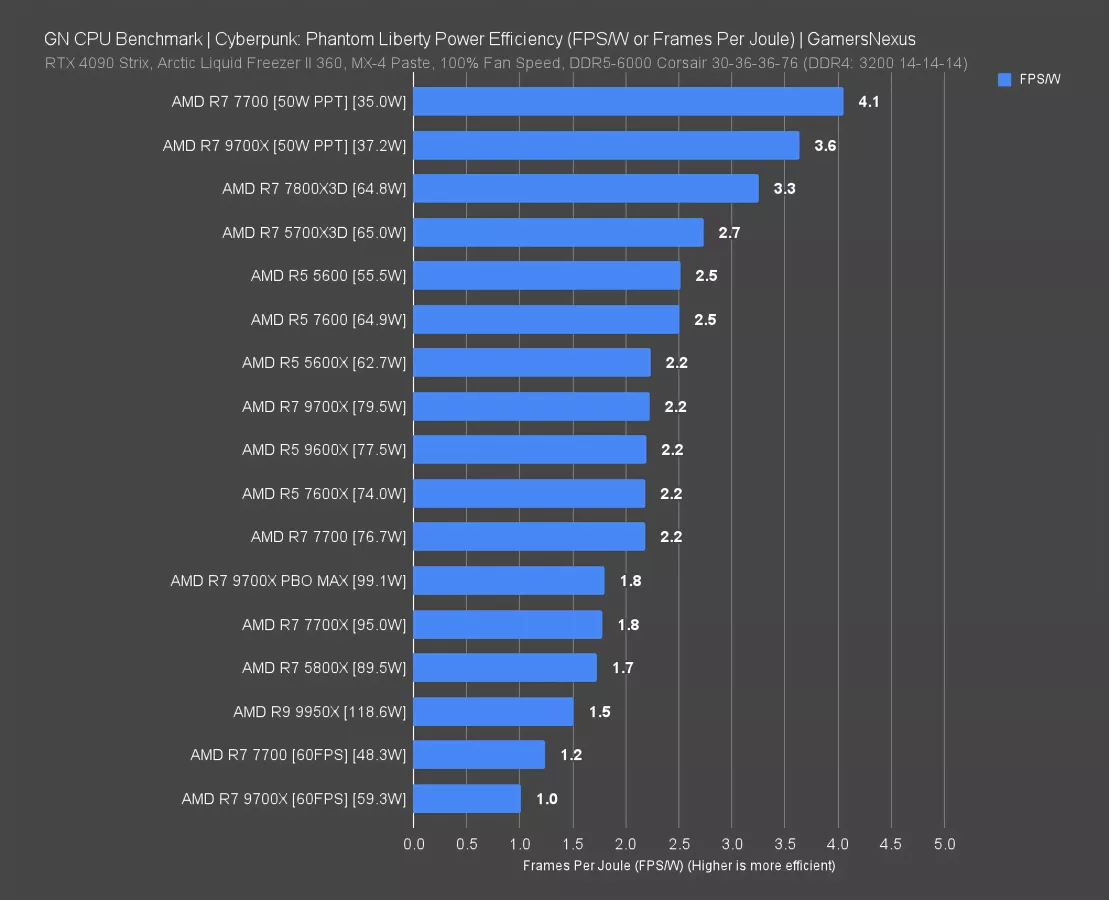
In Phantom Liberty, the 9950X pulled about 119W while producing a framerate similar to the 9700X. As a result, its efficiency is through the floor. This CPU is just off the far end of the bathtub curve in these kinds of games: The baseline power consumption to keep this CPU operational is higher and it has a ton of cores sitting there doing next to nothing. This CPU needs to be fully leveraged to have a better result, and games just don’t really do that when you need core parking.
Efficiency - Games (Stellaris)
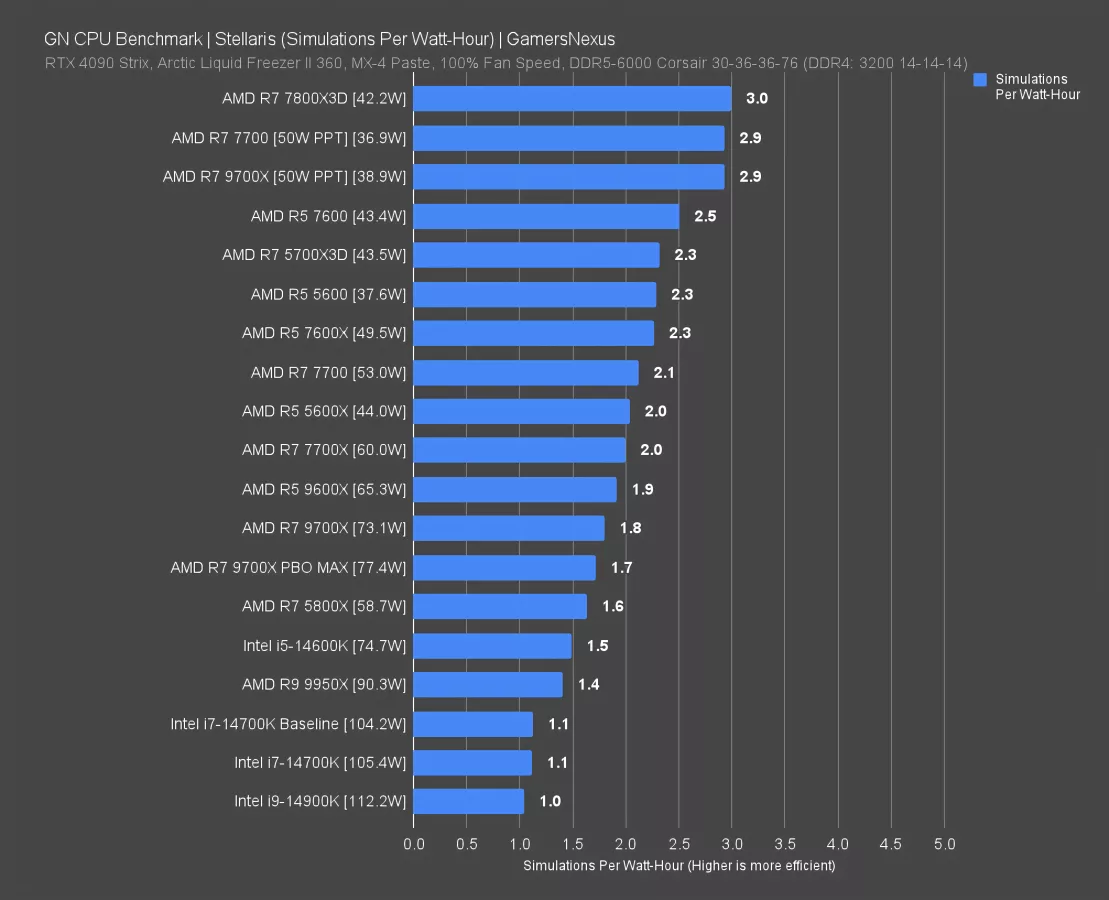
In Stellaris, the 9950X completes 1.4 simulations per watt-hour, which has it below almost everything except the 14700K and 14900K (watch our review)CPUs. The 9700X leads by significant margin, up at 1.8 simulations per watt-hour, with the 7800X3D roughly doubling the performance. The only positive is that it’s ahead of Intel here.
9950X Production Benchmarks
We’re starting with production benchmarks for the 9950X since its intended use case would be for workstation-type tasks, followed by gaming benchmarks just to make sure it’s working as expected.
Blender
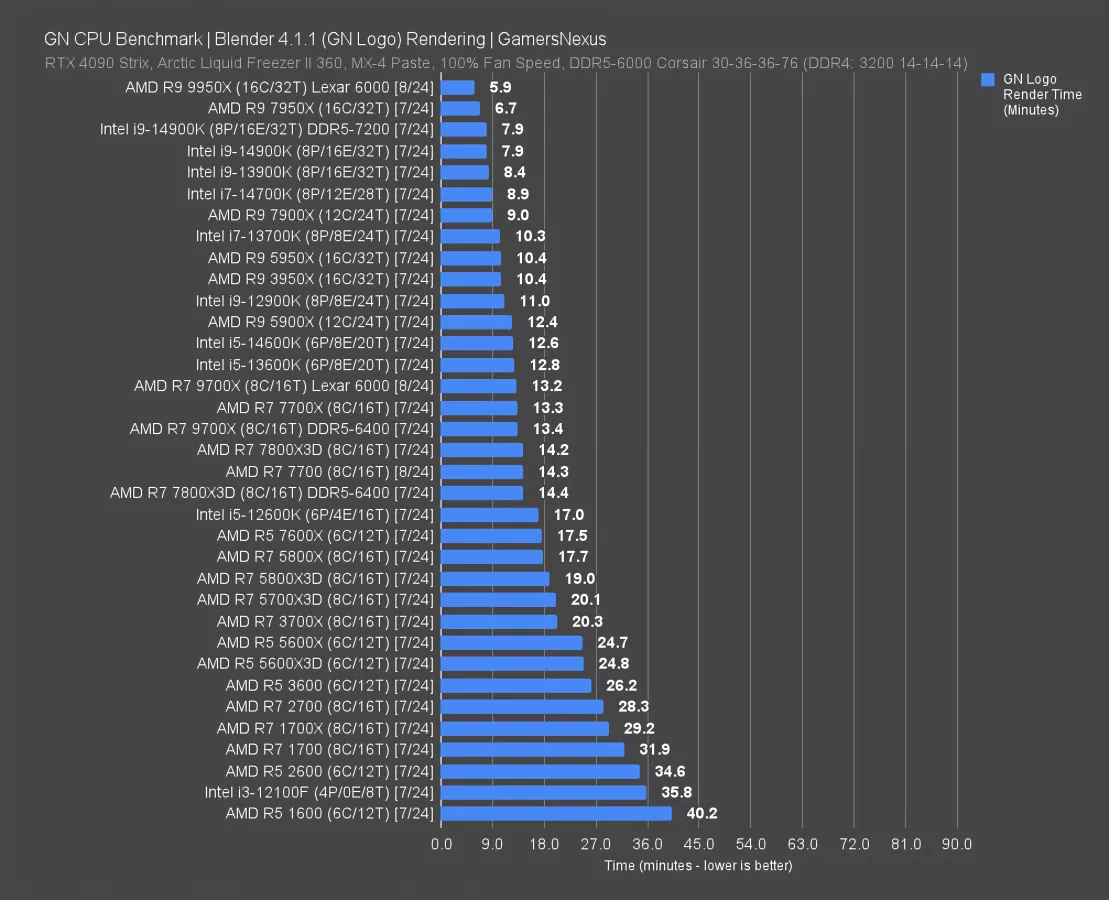
Blender starts us off. The 9950X is the new chart-topper for tile-based rendering, posting a total render time reduction of 12% from the 7950X. That’s going to be one of the top gains we see in this review, as this is a fully-engaged, all-core workload.
Intel’s 14900K required 7.9 minutes to complete the same work. Depending on launch day pricing and if the 7950X moves around, it’s possible that it remains the best option for a machine that combines workstation and gaming tasks when looking at it from a value standpoint, but it’ll depend on price positioning.
Generationally, the 9950X reduces the total render time required by 43% from the 5950X and 3950X, which require about 10.4 minutes to complete. This is not a mistake -- they are just the same here. We talked about that in our original review from years ago. If you prefer to look at it from the direction of increase in time required, obviously the percent flips and nearly results in a doubling. We do these comparisons as percent reduction in total required time.
AMD is at least moving the needle in this one. Let’s see if it sustains.
Adobe Photoshop
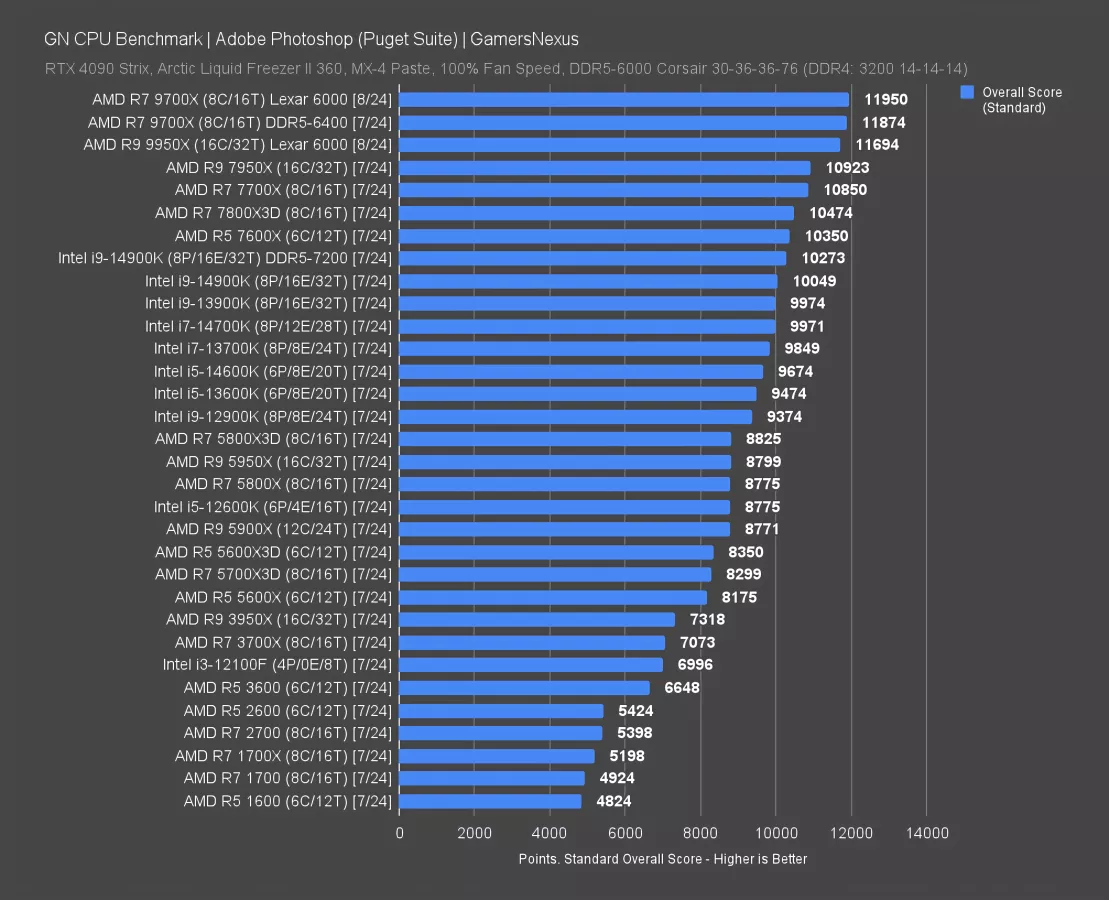
Photoshop is next, tested using the Puget test suite. Scoring is done as a formula calculating filtering, scaling, and other types of tasks within the software.
In this benchmark, the 9950X scored 11,694 points for Photoshop, which has it below the 9700X by a technicality. These two performed functionally the same. Photoshop can utilize extra cores, but isn’t making enough use of the extra 8 cores over the 9700X to matter.
Generationally, we saw similar behavior with the 7950X and 7700X: They were within margin of error of each other. The 9950X improves on the 7950X by 7%, which still isn’t bad, but certainly isn’t a huge excitement. This is performance we’d expect out of a mid-generation refresh. It doesn’t really feel enough for how much this was marketed as a brand new platform to work off of. Versus the 5950X, the 9950X improves 33%. The 3950X gives the 9950X an uplift of 60%. If you’ve been on the 3950X for years now, it’s at least starting to look like you’ll get meaningful uplift in some of these tasks.
The newest version of this benchmark combined with the newest version of Photoshop shows AMD’s favorable positioning, whereas older versions showed Intel favor. Intel’s first showing is below the 7600X.
Adobe Premiere
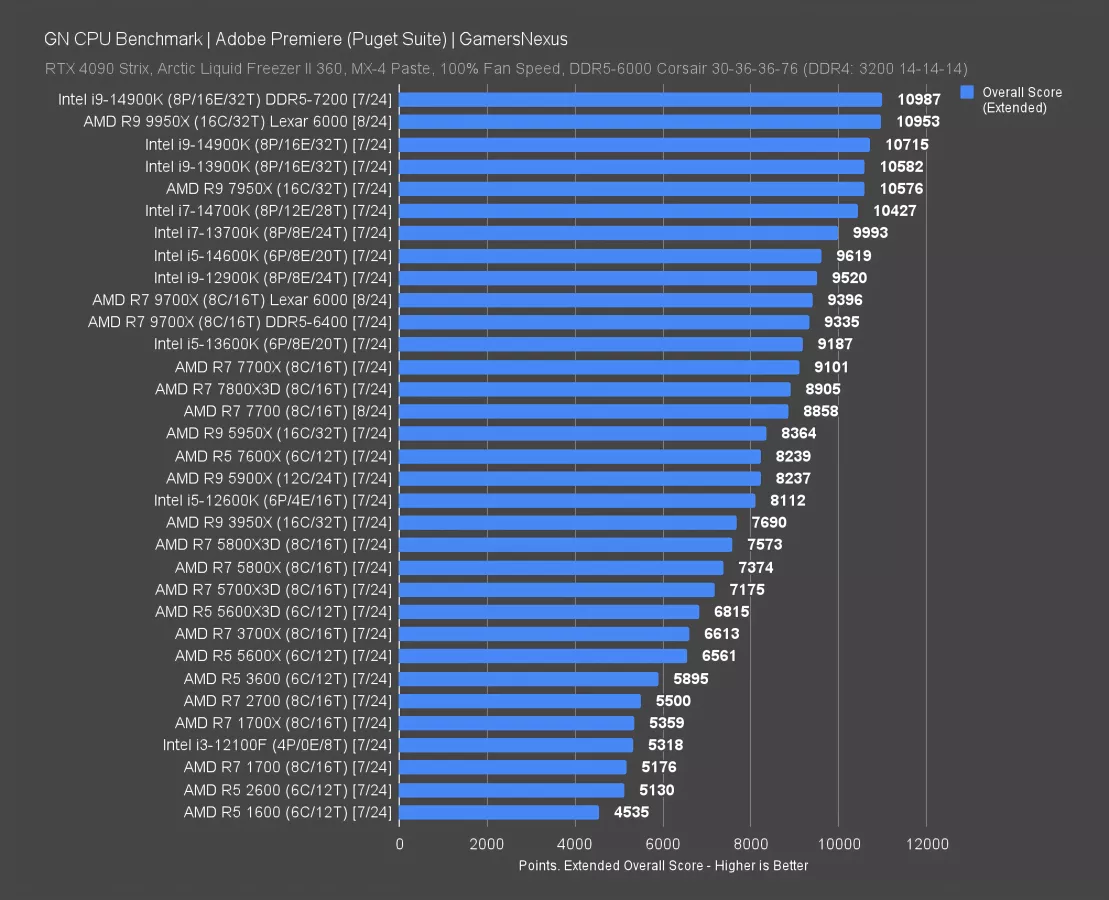
In Adobe Premiere, the 9950X scored almost 11,000 points for the extended benchmark. The 14900K flanks it with the standardized and faster memory, but ultimately, these are equivalent. Against the prior generation, the 9950X improves 31% over the 5950X (which is down near the 7600X) and 42% over the 3950X.
For comparison, the 5950X -- which itself wasn’t always an exciting uplift over the 3950X -- posts a 9% improvement over its predecessor. Anyone expecting a 7950X-era gain would be disappointed: That one is 26% better than the 5950X.
Intel does much better in this test than some of the prior ones with our current data set. The 14700K (read our review) and 14600K are still in the top portion of the chart. We actually generally like the 13600K and 14600K CPUs for a cheaper option for this task, especially when the 13600K is at its cheaper price, but we’re waiting for some of the smoke to clear before we resume recommendations of them. The microcode is still rolling out to boards.
Chromium Code Compile
Code compile testing with Chromium is next. This requires a reminder that not all compile workloads behave the same, just like anything else.
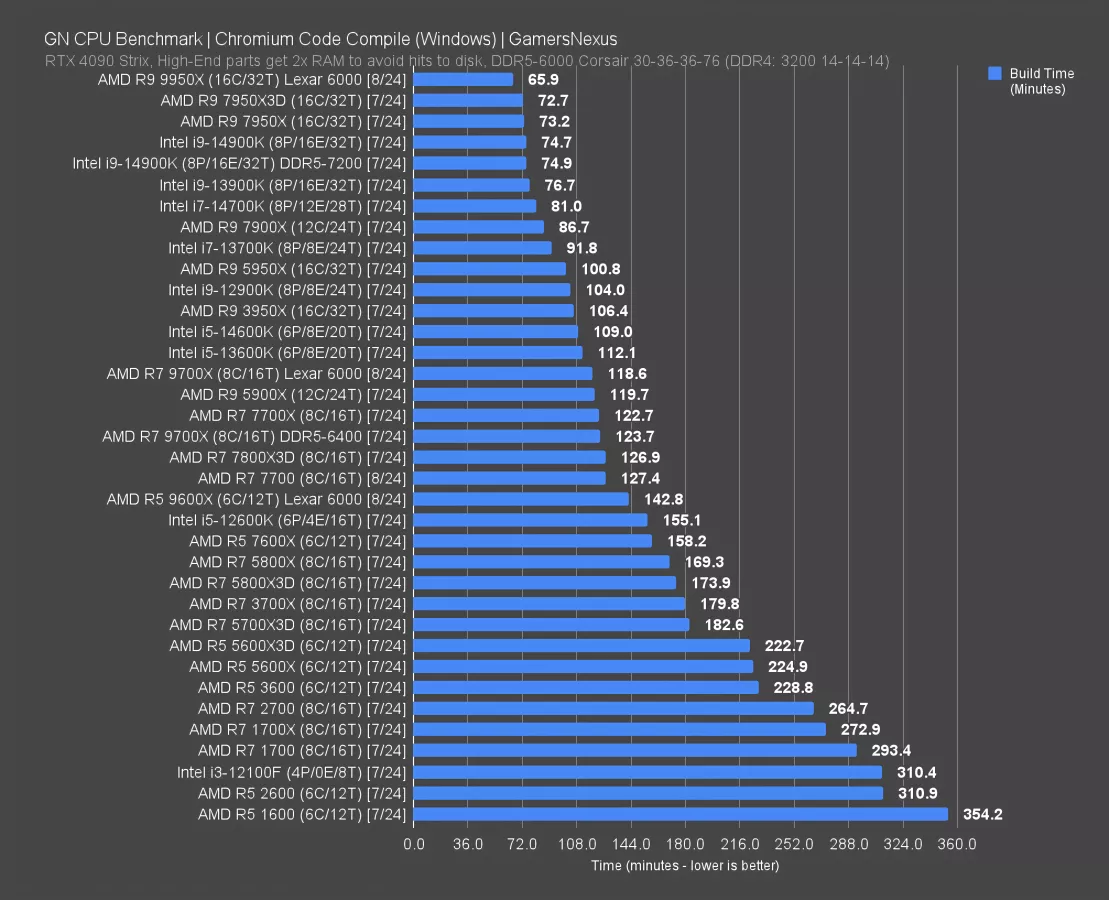
In our test at least, the 9950X leads everything. The new CPU required 66 minutes to complete the compile, leading the 7950X’s 73-minute entry and benefiting from a total compile time reduction of almost 10%. Obviously, Threadripper would be ahead of this, which we’ve tested in the past, but we don’t have it rerun for the new tests.
The 7950X was able to reduce the compile time required from the 5950X’s 101-minute result by 27%, whereas the 5950X only reduced it from the 3950X’s 106-minute result by 5.3%. The new CPU is more similar to that era than the total platform change we saw with AM4 to AM5. That’s not too surprising.
Intel’s closest entries are the 14900K, which roughly tie with the 7950X. AMD is gaining some distance where it only had equivalence before.
7-Zip Compression
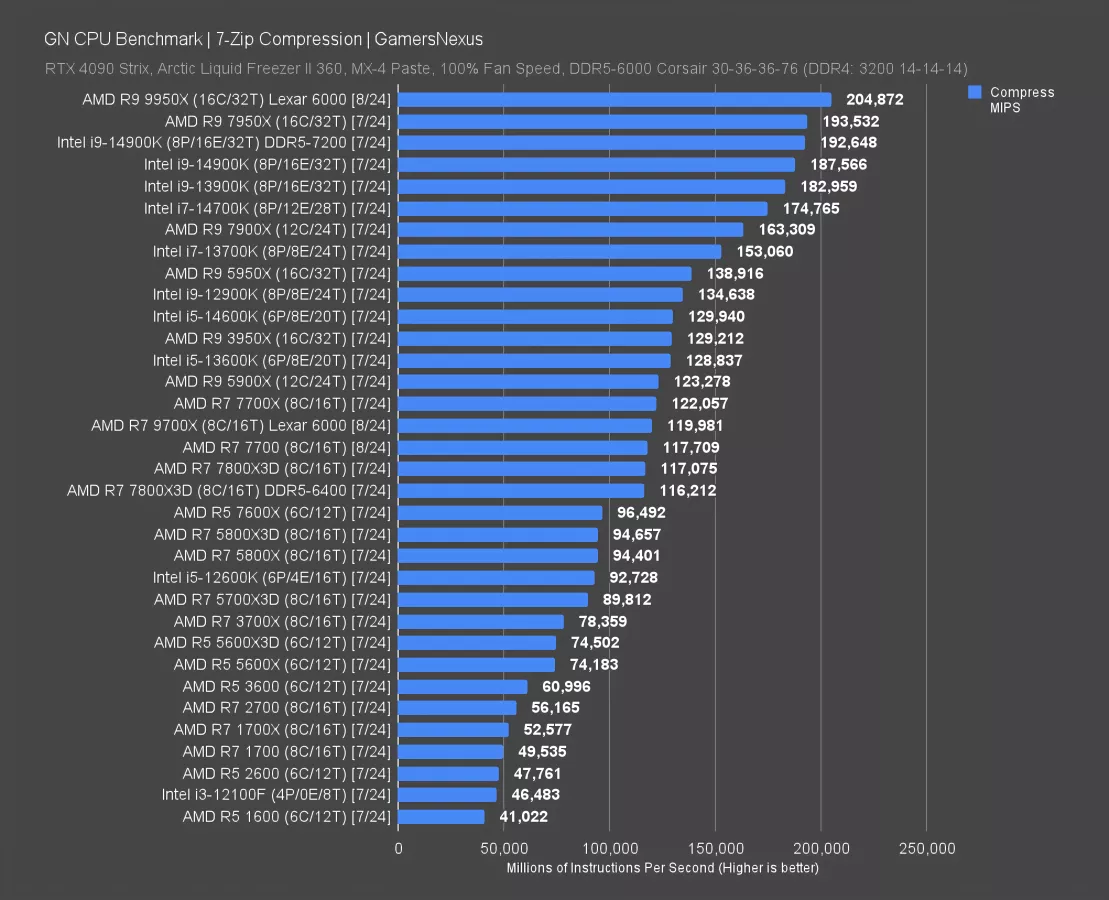
File compression with 7-Zip is next. In this one, the 9950X completed 205K MIPS (millions of instructions per second) when stock, an improvement of 5.9% over the 7950X’s result. For that same generational perspective, here’s how it lines up:
The 7950X gained 39% on the 5950X, which itself had gained 7.5% on the 3950X.
The gains are up-and-down, but the 9950X is the lowest of these metrics so far.
Intel’s 14900K encroaches on the top of the chart and was nearly tied with the 7950X previously; again, AMD benefits from creating some slight distance between itself and the 14900K, regardless of Intel’s current problems. If Arrow Lake can do better than this, Intel may be able to maneuver itself into a strong spot. It’ll depend if Intel can regain confidence before then.
Against the 9700X, the 9950X completes 71% more MIPS. This aligns with the massive core count difference.
7-Zip Decompression
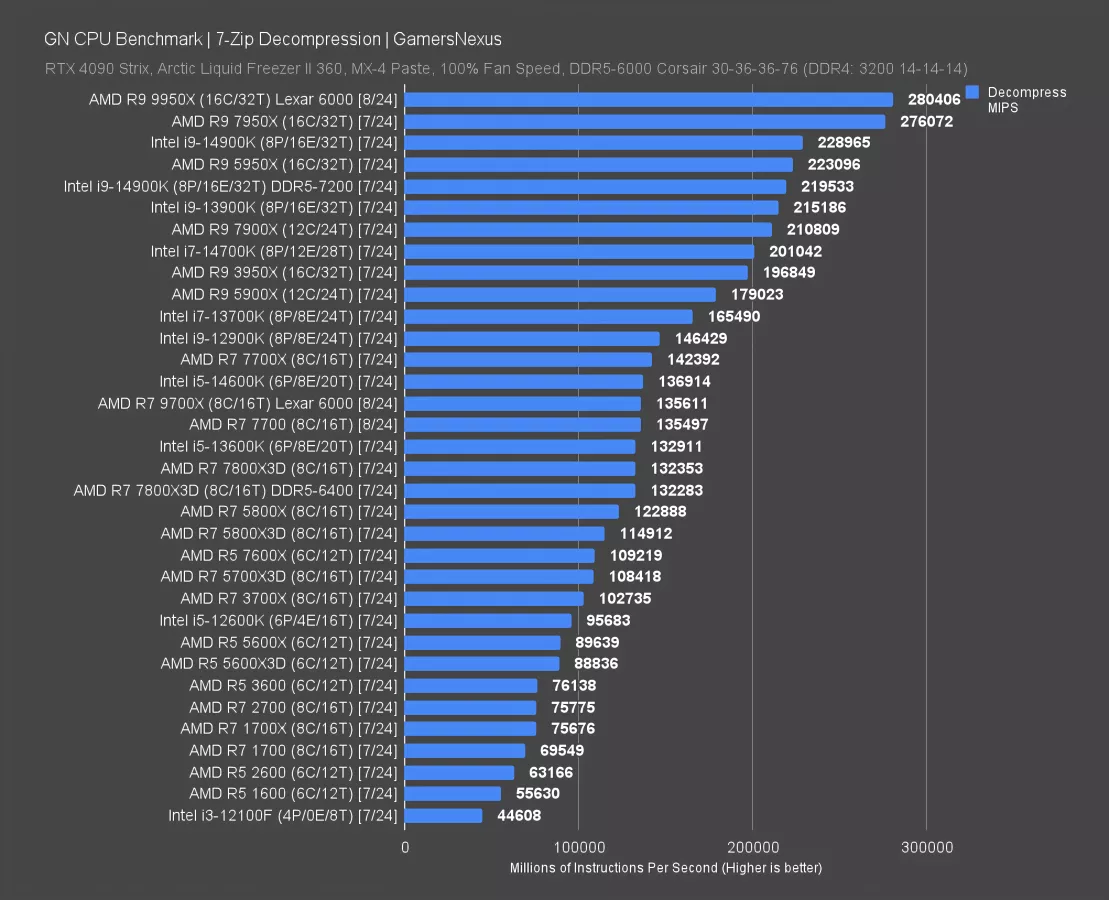
Decompression moves some of these CPUs around, but the 9950X remains at the top of the chart. Its lead over the 7950X is only 1.6% here, though we may also be running into memory bandwidth limitations. That’d be a separate test.
The next CPUs are pretty far away: AMD’s 9950X leads the 14900K and its 229K MIPS result by 22%. That’s a big advantage.
The 5950X also did well in this one, shoving itself right between the 14900K and 13900K. This test clearly favors having a bunch of homogeneous cores.
Against the 9700X, the 9950X doubles performance. It also doubles core count, making this one of the most linear gains we see.
SpecWS
Spec Workstation is up next. This testing is completed using the Spec pre-built benchmarks for various professional software.
Spec LAMMPS
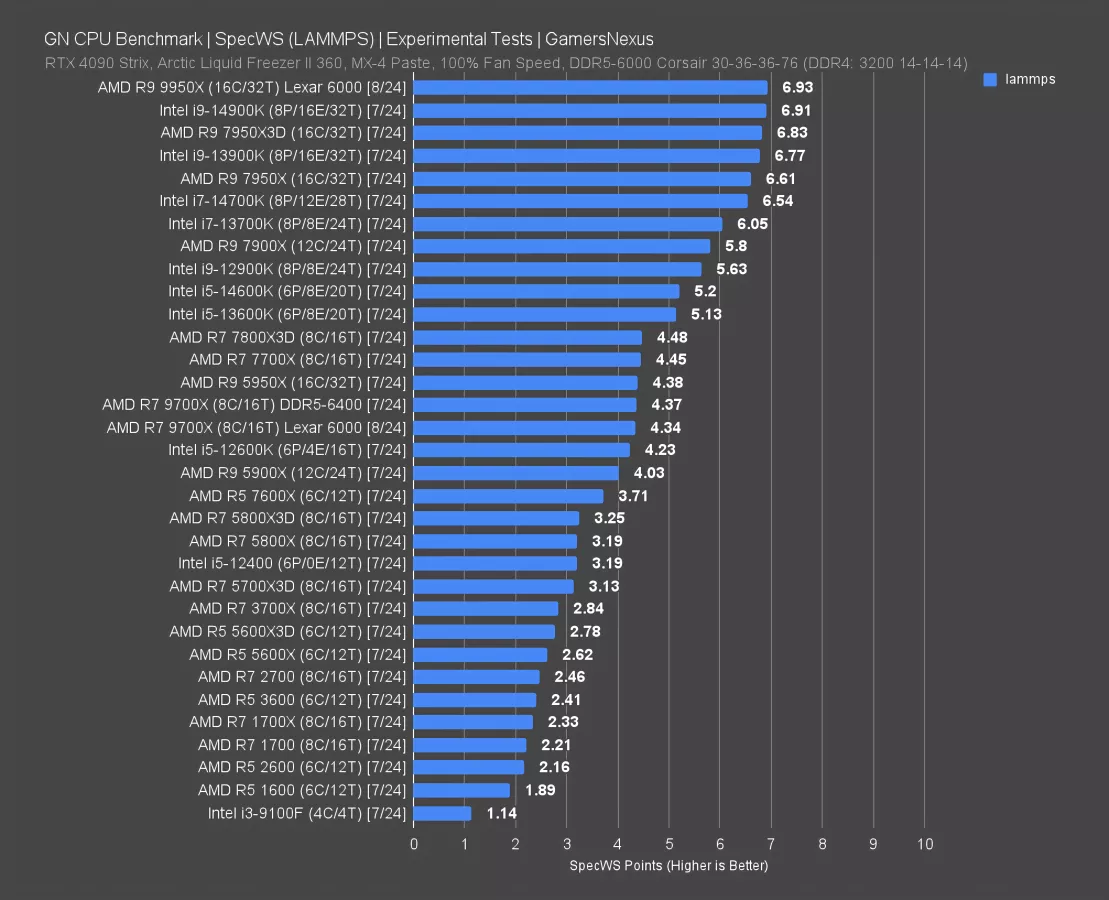
The first one is for LAMMPS, which is part of Spec’s biomedical suite.
As tested by Spec, LAMMPS has the 9950X as the chart leader: It’s up at 6.93, leading the 7950X’s 6.61 result by 5%. That also puts AMD now ahead of the 14900K.
Spec FSI
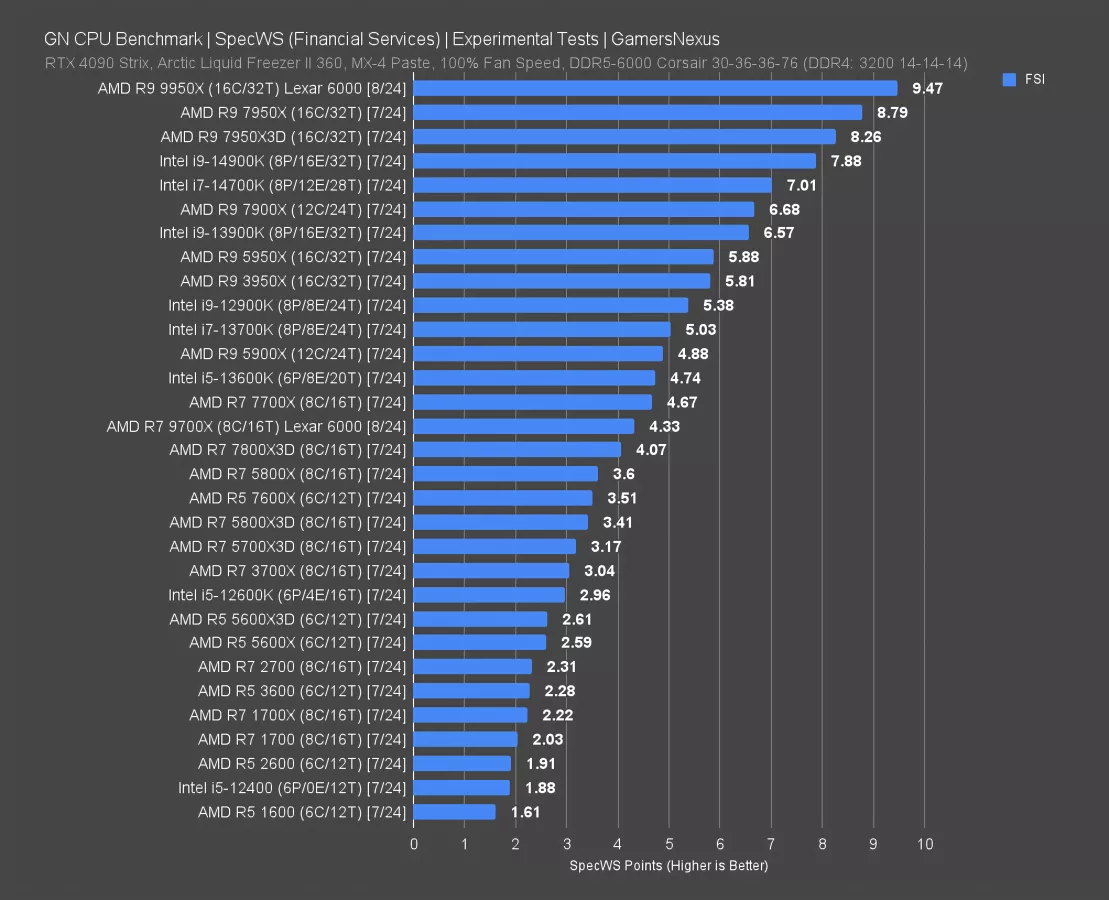
The next one is for the Spec Workstation FSI test, which it says analyzes Black-Scholes pricing models, runs Monte Carlo simulations and probability simulations, and runs a binomial options pricing model. We are not familiar with these use cases in real-world environments, but our hope is that the tests are useful to the audience.
Here, the 9950X ends up leading the 7950X-non-3D by 7.7%, at 9.47 to 8.79. The lead over the 14900K is 20%. Against prior generations, the 5950X gives the 9950X a lead of 61%.
9950X Gaming Benchmarks
Gaming is up now. This is less important for the 9950X: You shouldn’t buy these CPUs for a gaming build only. Our main goal here is to just make sure it works properly and doesn’t chop the framerate in any major ways. We won’t spend much time on each of these charts as we think that time was better spent in the earlier production sections.
Dragon’s Dogma 2
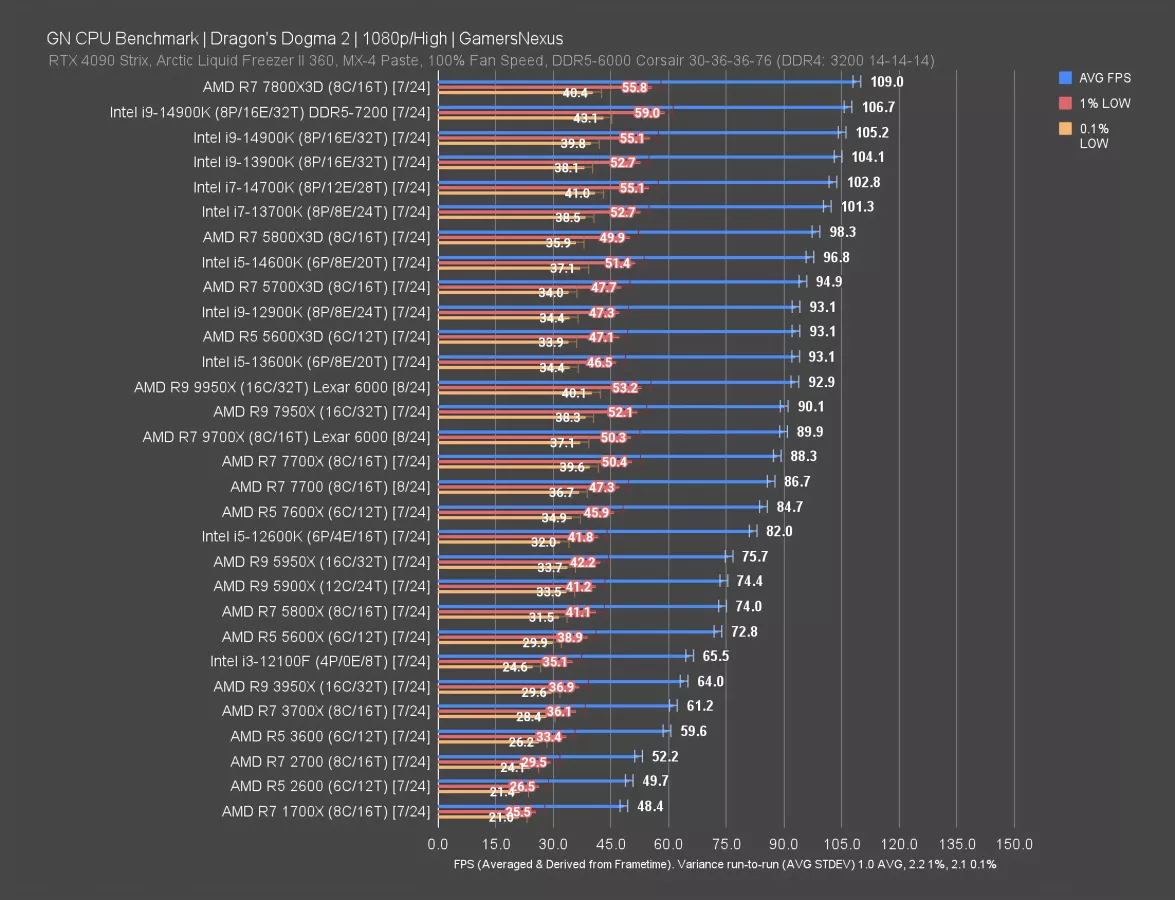
Dragon’s Dogma 2 is up first, a CPU-heavy game that came out this year.
The 9950X is about the same as the 7950X here. It’s technically slightly ahead, and as a positive, we are seeing benefit from the 16-core parts in this specific test. That’s at least good, as historically, some of the 16-core CPUs have had problems in gaming. That was especially true in older games.
The 9950X is definitely not worth buying just for gaming, but neither was the 7950X. In this one, it is holding an AVG framerate similar to a 13600K (watch our review) and 5600X3D (read our review), both of which are much better value for just gaming. The lows on the 9950X are good though, which means it clears the bar of “working” in a gaming scenario.
The 7800X3D (watch our review) remains remarkably good value for this particular game. Intel’s i7 CPUs at the top also do well.
You can see that the older 16-core CPUs also outdo their generational family by small margins: The 3950X leads the 3700X (read our revisit) slightly and the 5950X leads the 5900X and 5800X non-3D parts slightly. This is pretty cool to see as this was rare in prior years of benchmarking. Dragon’s Dogma 2 testing seems to be good for this.
Baldur’s Gate 3
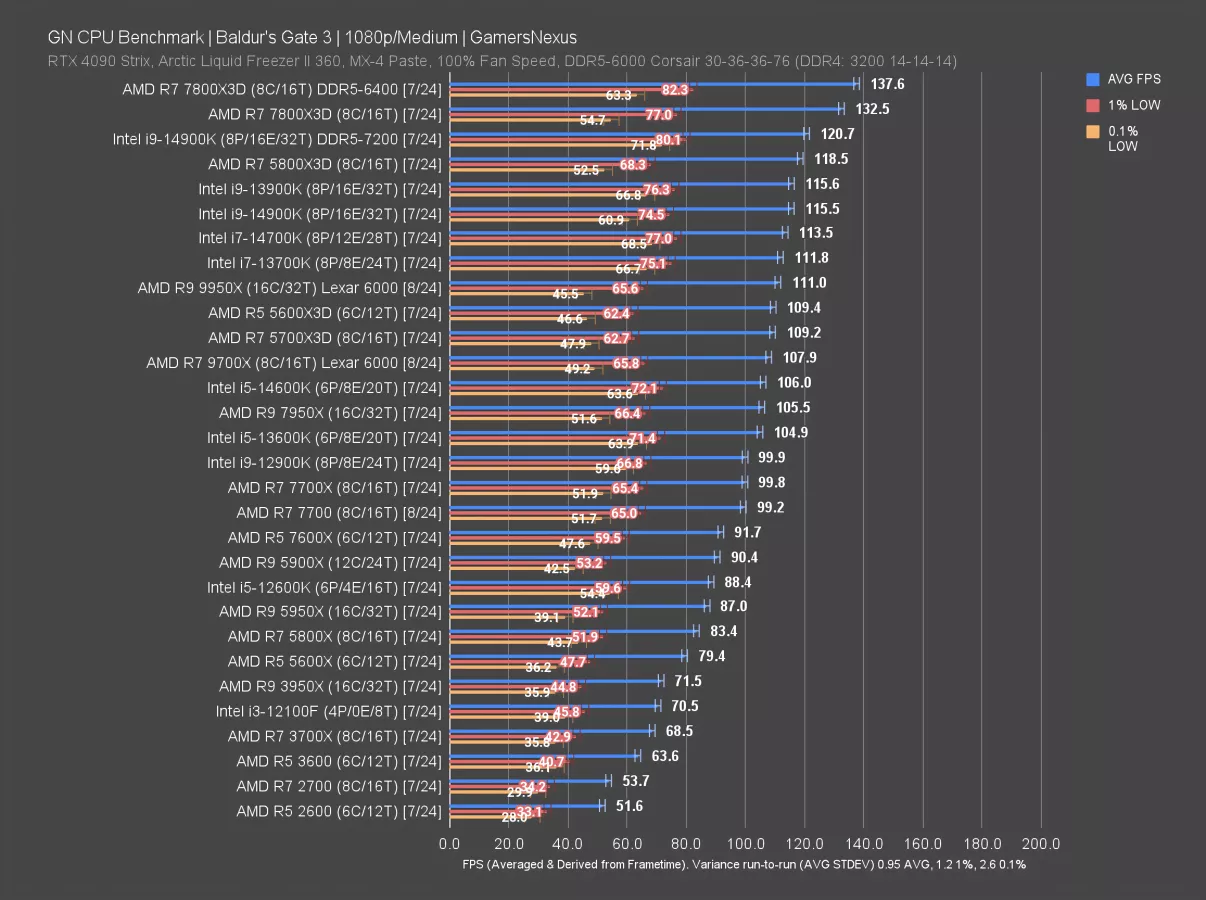
In Baldur’s Gate 3, the 9950X landed at 111 FPS AVG. That has it about tied with the 13700K and slightly ahead of the 5700X3D. Against the 9700X, we’re seeing about a 2.9% uplift with the 9950X. Lows are similar, but with the 0.1% lows technically worse. The gain over the 7950X is about 5.2% The 3950X allows the 9950X to run 55% faster, with the 5950X giving it a 28% lead.
As for the 7800X3D with our default memory, it outperforms the 9950X by 19.4%. The 14900K is also up here at 121 FPS AVG when paired with faster memory, or down at 116 FPS AVG without (where it and the 13900K become limited).
The 9950X is working better than we expected for Baldur’s Gate 3.
Stellaris
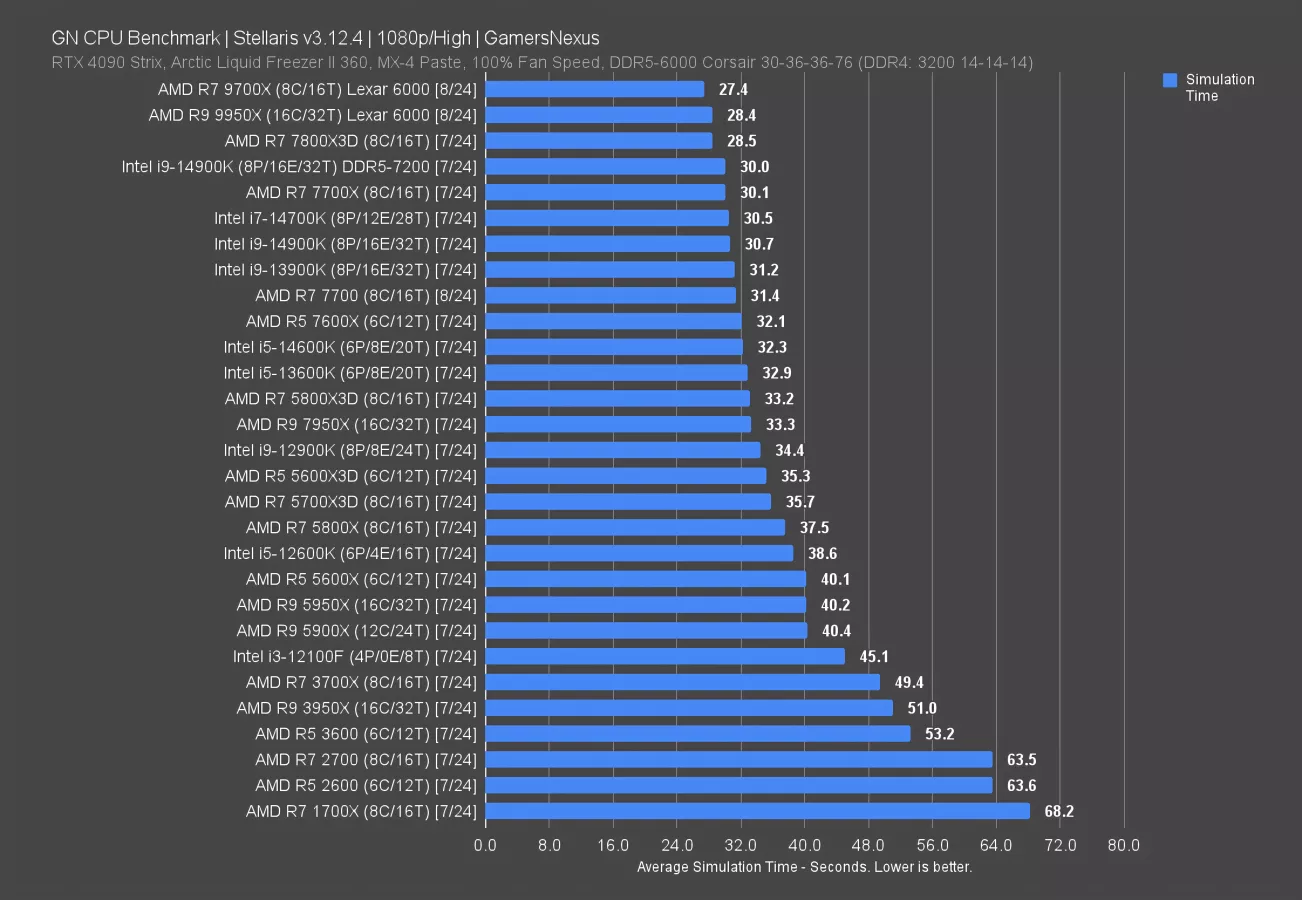
Stellaris posts results that have the 9700X outperforming the 9950X slightly. The reduction in average simulation time is 1 full second, or about 3.5% time reduced. The 9950X is also tied with the 7800X3D, with this being one of the only tests where we saw the 9700X leverage its changes to pull ahead. The 9950X has the same architectural benefits, so it’s up here as well.
Despite not improving over the 9700X, the 9950X at least improves on the 7950X. The jump from 33.3 seconds to 28.4 seconds starts to become noticeable for longer play sessions.
Back in the 5950X era, we can see that there was no real differentiation between it and the 5600X or 5900X. The 3950X was actually a little bit worse than the 3700X. This makes sense for those CPUs, as they sacrificed more frequency along with their core count increases.
Intel’s presence begins at the 30.5-second mark with the 14700K and 14900K, which are about the same.
FFXIV Dawntrail
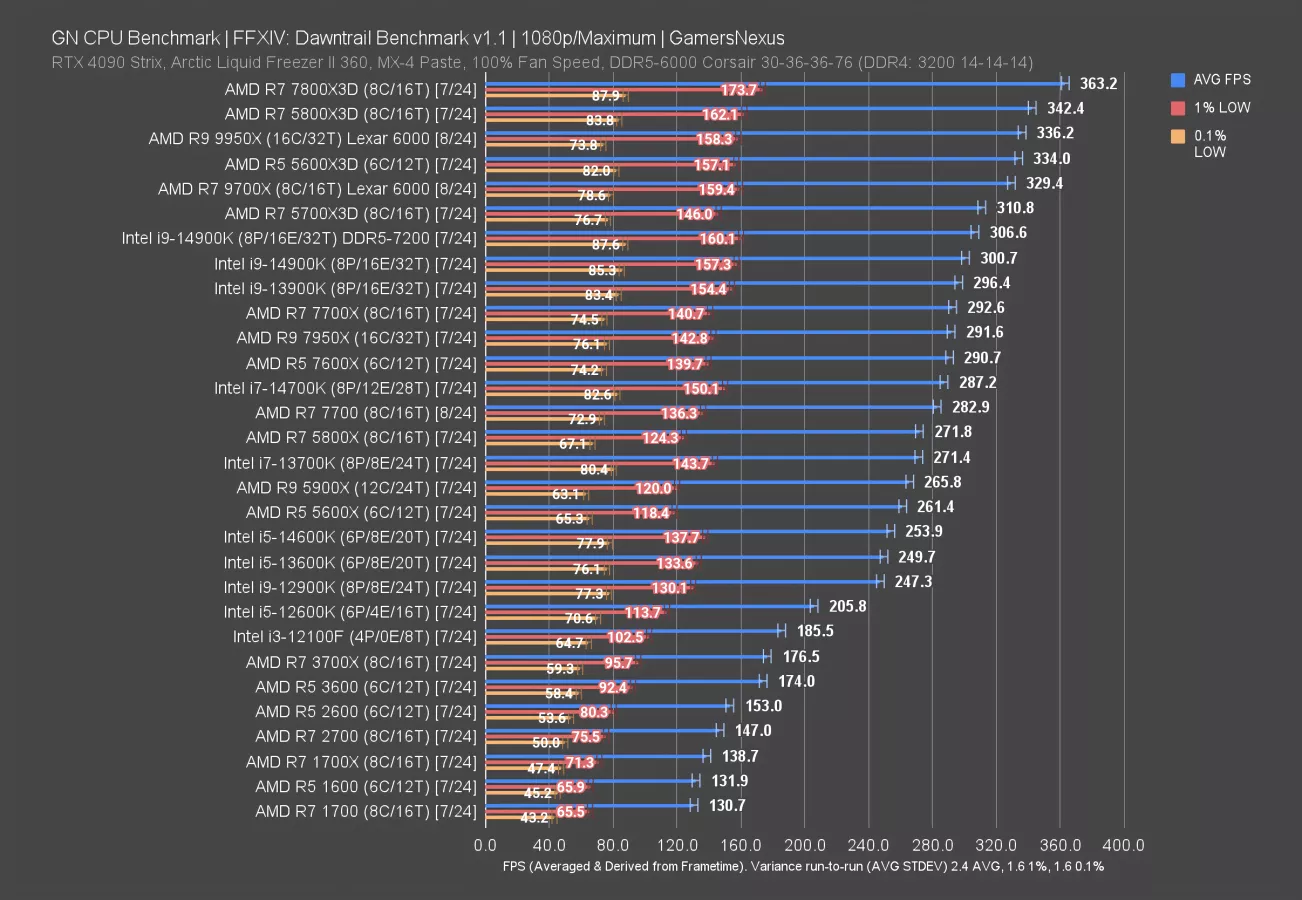
Final Fantasy 14: Dawntrail has the 9950X at 336 FPS AVG, which is a somewhat noteworthy lead over the 9700X of 2%. It’d be insane to spend this money on it for just gaming, but it’s at least tracking better and we seem to be past the old era of high core-count parts floundering, like what we saw with the original Threadripper 1950X (watch our review).
The 7800X3D remains the clear gaming chart leader.
Dawntrail Frequency
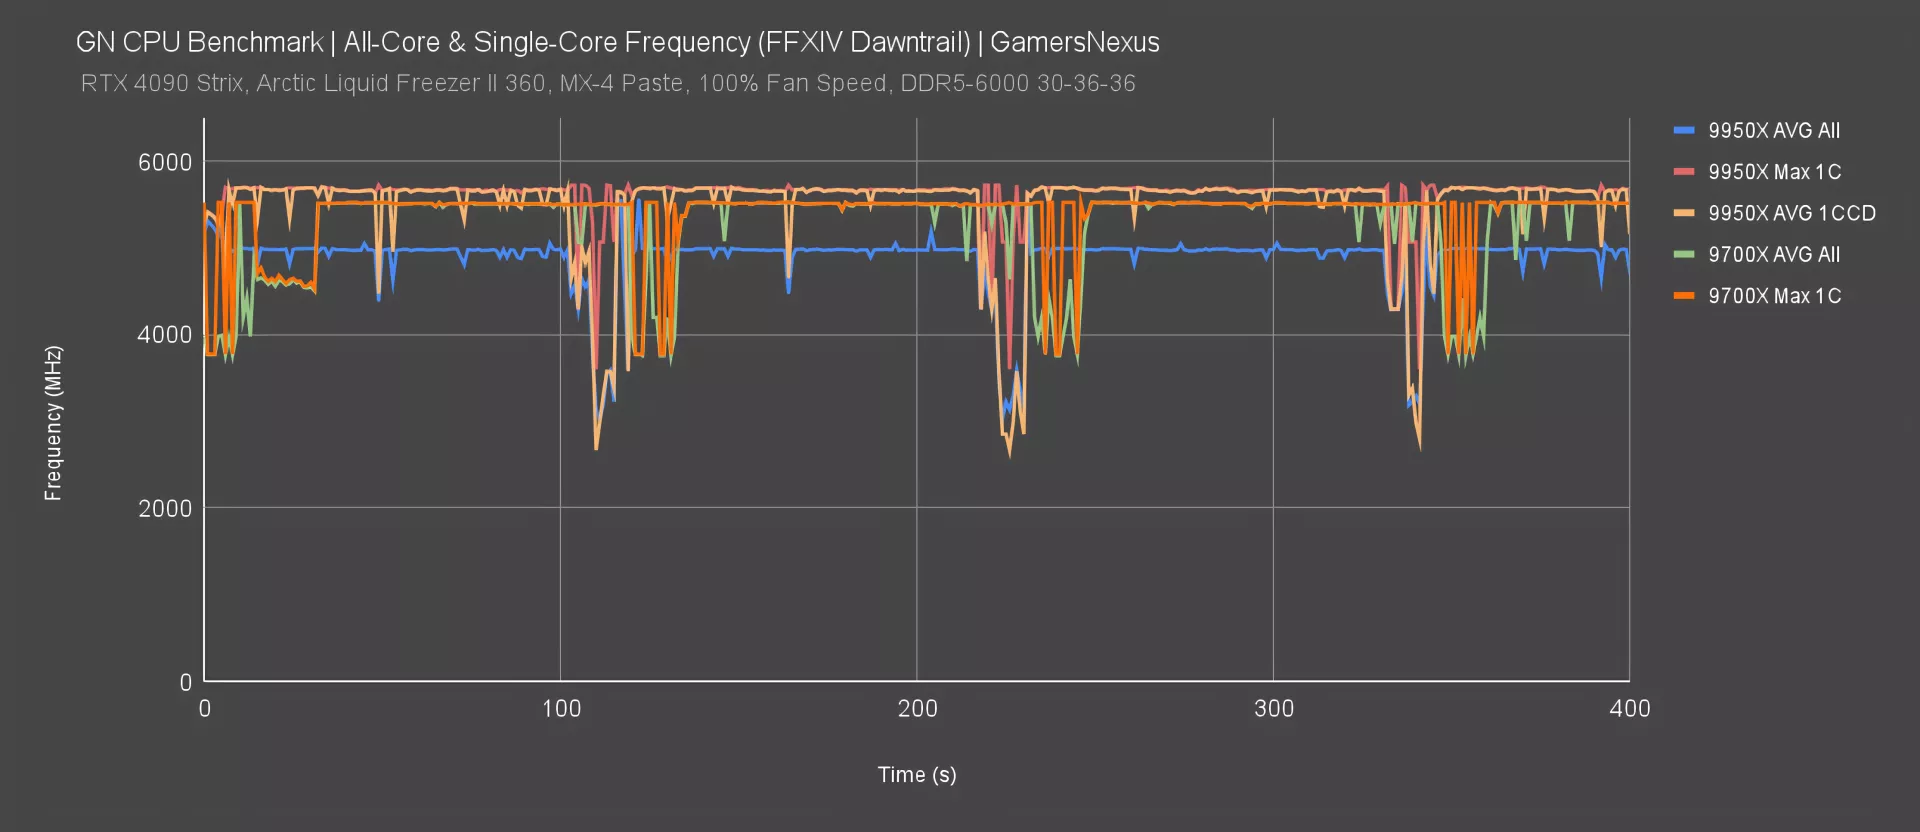
To better understand what’s going on in Dawntrail, we plotted the frequency of the 9950X and 9700X during this workload. We found that the 9950X’s all-core average was about 4975-5000MHz, which is lower than the 9700X’s all-core average of 5500MHz [but that’s because it’s averaging an inactive CCD. We’ll look at that soon. You can see that the 9700X’s all core is just below its maximum single core frequency.
At the same time, the 9950X is able to boost its maximum core higher, up to 5670-5700MHz. At times, that’s around a 150MHz advantage over the 9700X, which explains the performance we’re seeing in Final Fantasy.
If we plot the average frequency for just the 8 cores that are active, we see it aligns with the max -- that helps even further explain the behavior. The 9950X is just boosting higher everywhere.
F1 2024
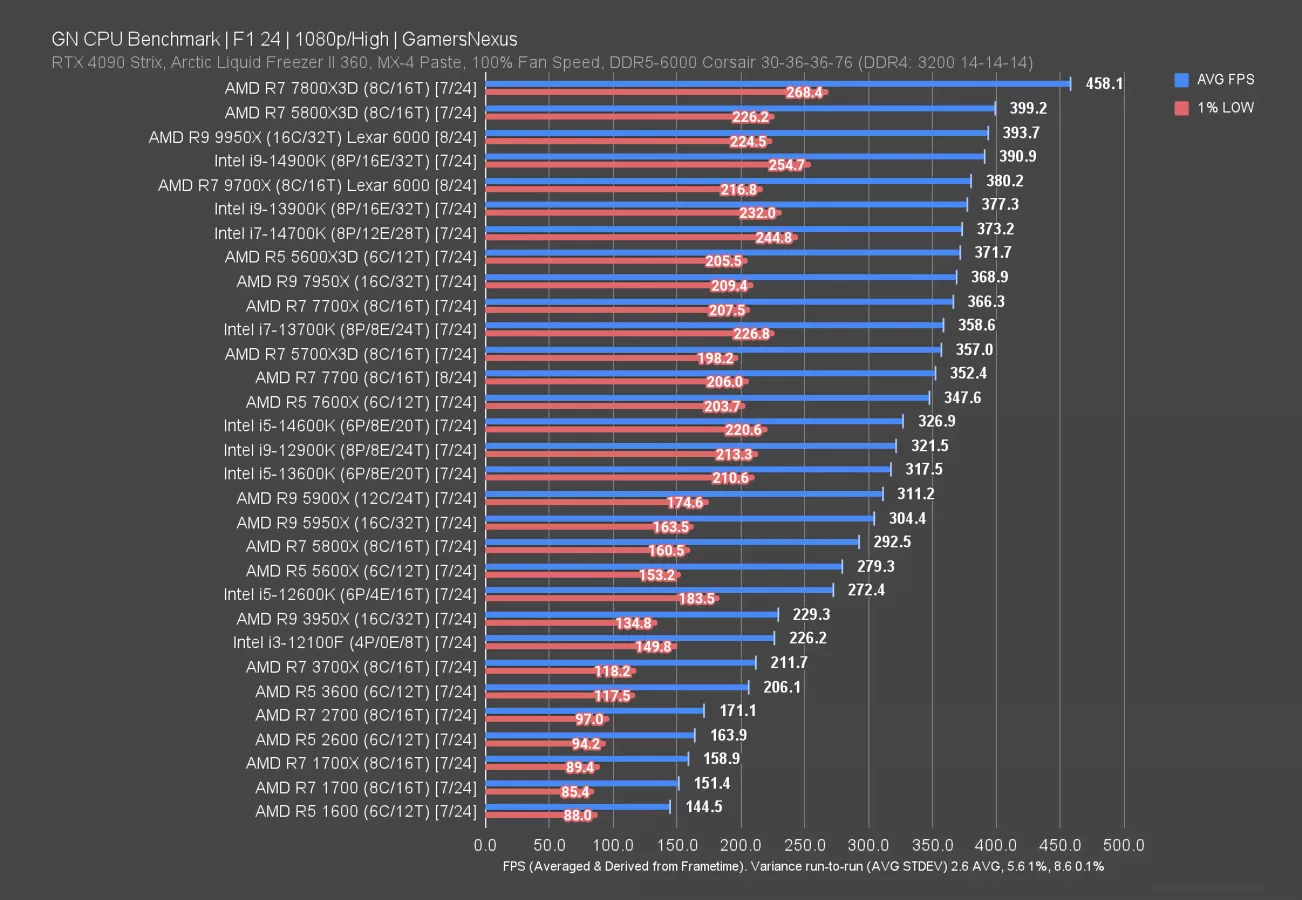
Now for F1 2024. F1 had the 9950X at 393.7 FPS AVG, with the 9700X at 380 FPS. That’s about a 3.5% difference between them. One note: We have observed more variable behavior in this test on the 9000 CPUs as compared to the 7000 series, which we think has to do with the change in memory kit that we’re using. As we discussed last time, we can’t use our standard Corsair DDR5-6000 kit for the 9000 series as the platform has some issues running it at the manual timings we set, despite 7000 working since launch. The Lexar kit does pretty well to match, but is not a precise match and has some reduced controls on some timings.
Even with all of that caveated, the difference remains within reasonable expectations.
F1 2024 Frequency
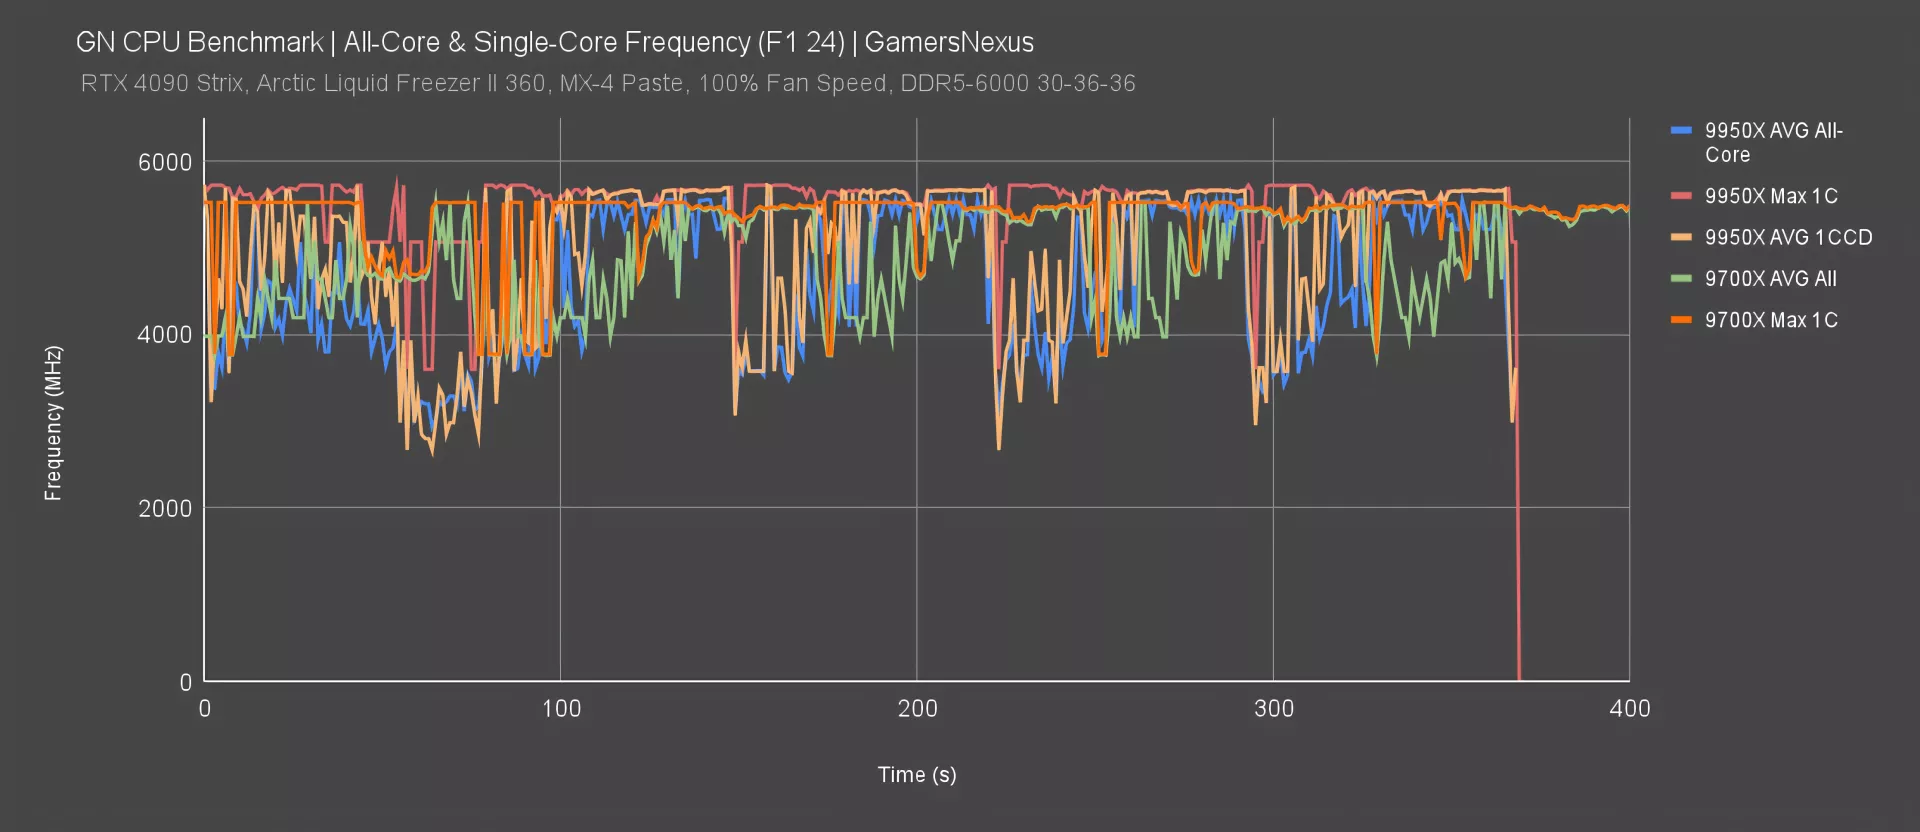
Once again, a quick look at frequency shows that the 9950X with its maximum single-core boost is pushing higher than the 9700X, with the single-CCD boost also running often right alongside the max single core at any given interval. The 9700X’s average is frequently significantly lower than that of the 9950X, helping explain this larger 3.5% gap in this particular title.
9950X Conclusion

We’re going to keep the conclusion really short. We’ve been running at full steam ahead for a week and there’s a ton of content on this topic already.
The 9950X has a higher TDP than the 9700X, so it can boost higher than the 9700X. This does make it “less efficient” in some games. In terms of gaming, the CPU is just not as efficient as almost any other modern AMD CPU.
AVX-512 is a strength for Zen 5, which becomes more relevant on these “mini-HEDT” CPUs. That’d be a big reason to buy a 9950X instead of a 7950X, as we saw in Blender where there’s a massive efficiency uplift but also a performance improvement.
We think it boils down to this:
For gaming, you’d buy a 7800X3D. For production workloads without a particular focus on AVX-512, and you can research your applications for that, we think the 7950X is far better value. These CPUs are more likely to be under a full, all-core workload than the R5 and R7 CPUs, so you’re more likely to benefit from the reduced power we saw in certain all-core workloads (but not all). That said, the 7950X is $520 now. That makes the 9950X 25% more expensive for what is often similar performance or maybe 12% better results at the high-end.
Generally speaking, we’d advise against the 7950X3D and instead in favor of the 7800X3D. You can learn about why in our prior reviews, but basically, most workstation applications we test can’t make use of the extra cache. They underperform versus the 7950X but do benefit from the higher frequency of the 7950X non-3D.
On the positive side, the 9950X did better in gaming than we expected. You really shouldn’t buy it for gaming primarily, but the fact that it’s at least regularly matching or very slightly outperforming the 9700X is good. Overall, the 7950X is generally a better value. The 9950X is at least worth considering if you’re doing a brand new from scratch build for a workstation type of environment but the thing for you to really research and pay attention to is the type of application you use. If it is really heavily threaded, it is running all cores at 100% all of the time like in Blender and/or if it’s an AVX512 application, you are more likely to benefit from a 9950X in a way that at least might start to matter versus a 7950X. If those things aren’t the case then, we think, the better value is to buy the 7950X instead.