This article is like our research/whitepaper piece that presents some experiments and possible representations for animation error in benchmarks
The Highlights
- Benchmarking has long had a problem of ensuring numbers relate back to the reality of what players feel when gaming
- Game stutters have sometimes been misattributed to frametime pacing issues rather than the actual problem, which was animation error, aka simulation time error
- The issue mostly comes to explaining precisely why stutters and hitching are happening in games, not just that they exist
Table of Contents
- AutoTOC

Intro
We have a new benchmark metric that exposes a limitation with current GPU and CPU game testing.
Editor's note: This was originally published on October 13, 2025 as a video. This content has been adapted to written format for this article and is unchanged from the original publication.
Credits
Test Lead, Host, Writing
Steve Burke
Testing, Writing, Research
Patrick Lathan
Camera, Video Editing
Vitalii Makhnovets
Video Editing
Tim Phetdara
3D Animation, Editing
Andrew Coleman
Writing, Web Editing
Jimmy Thang
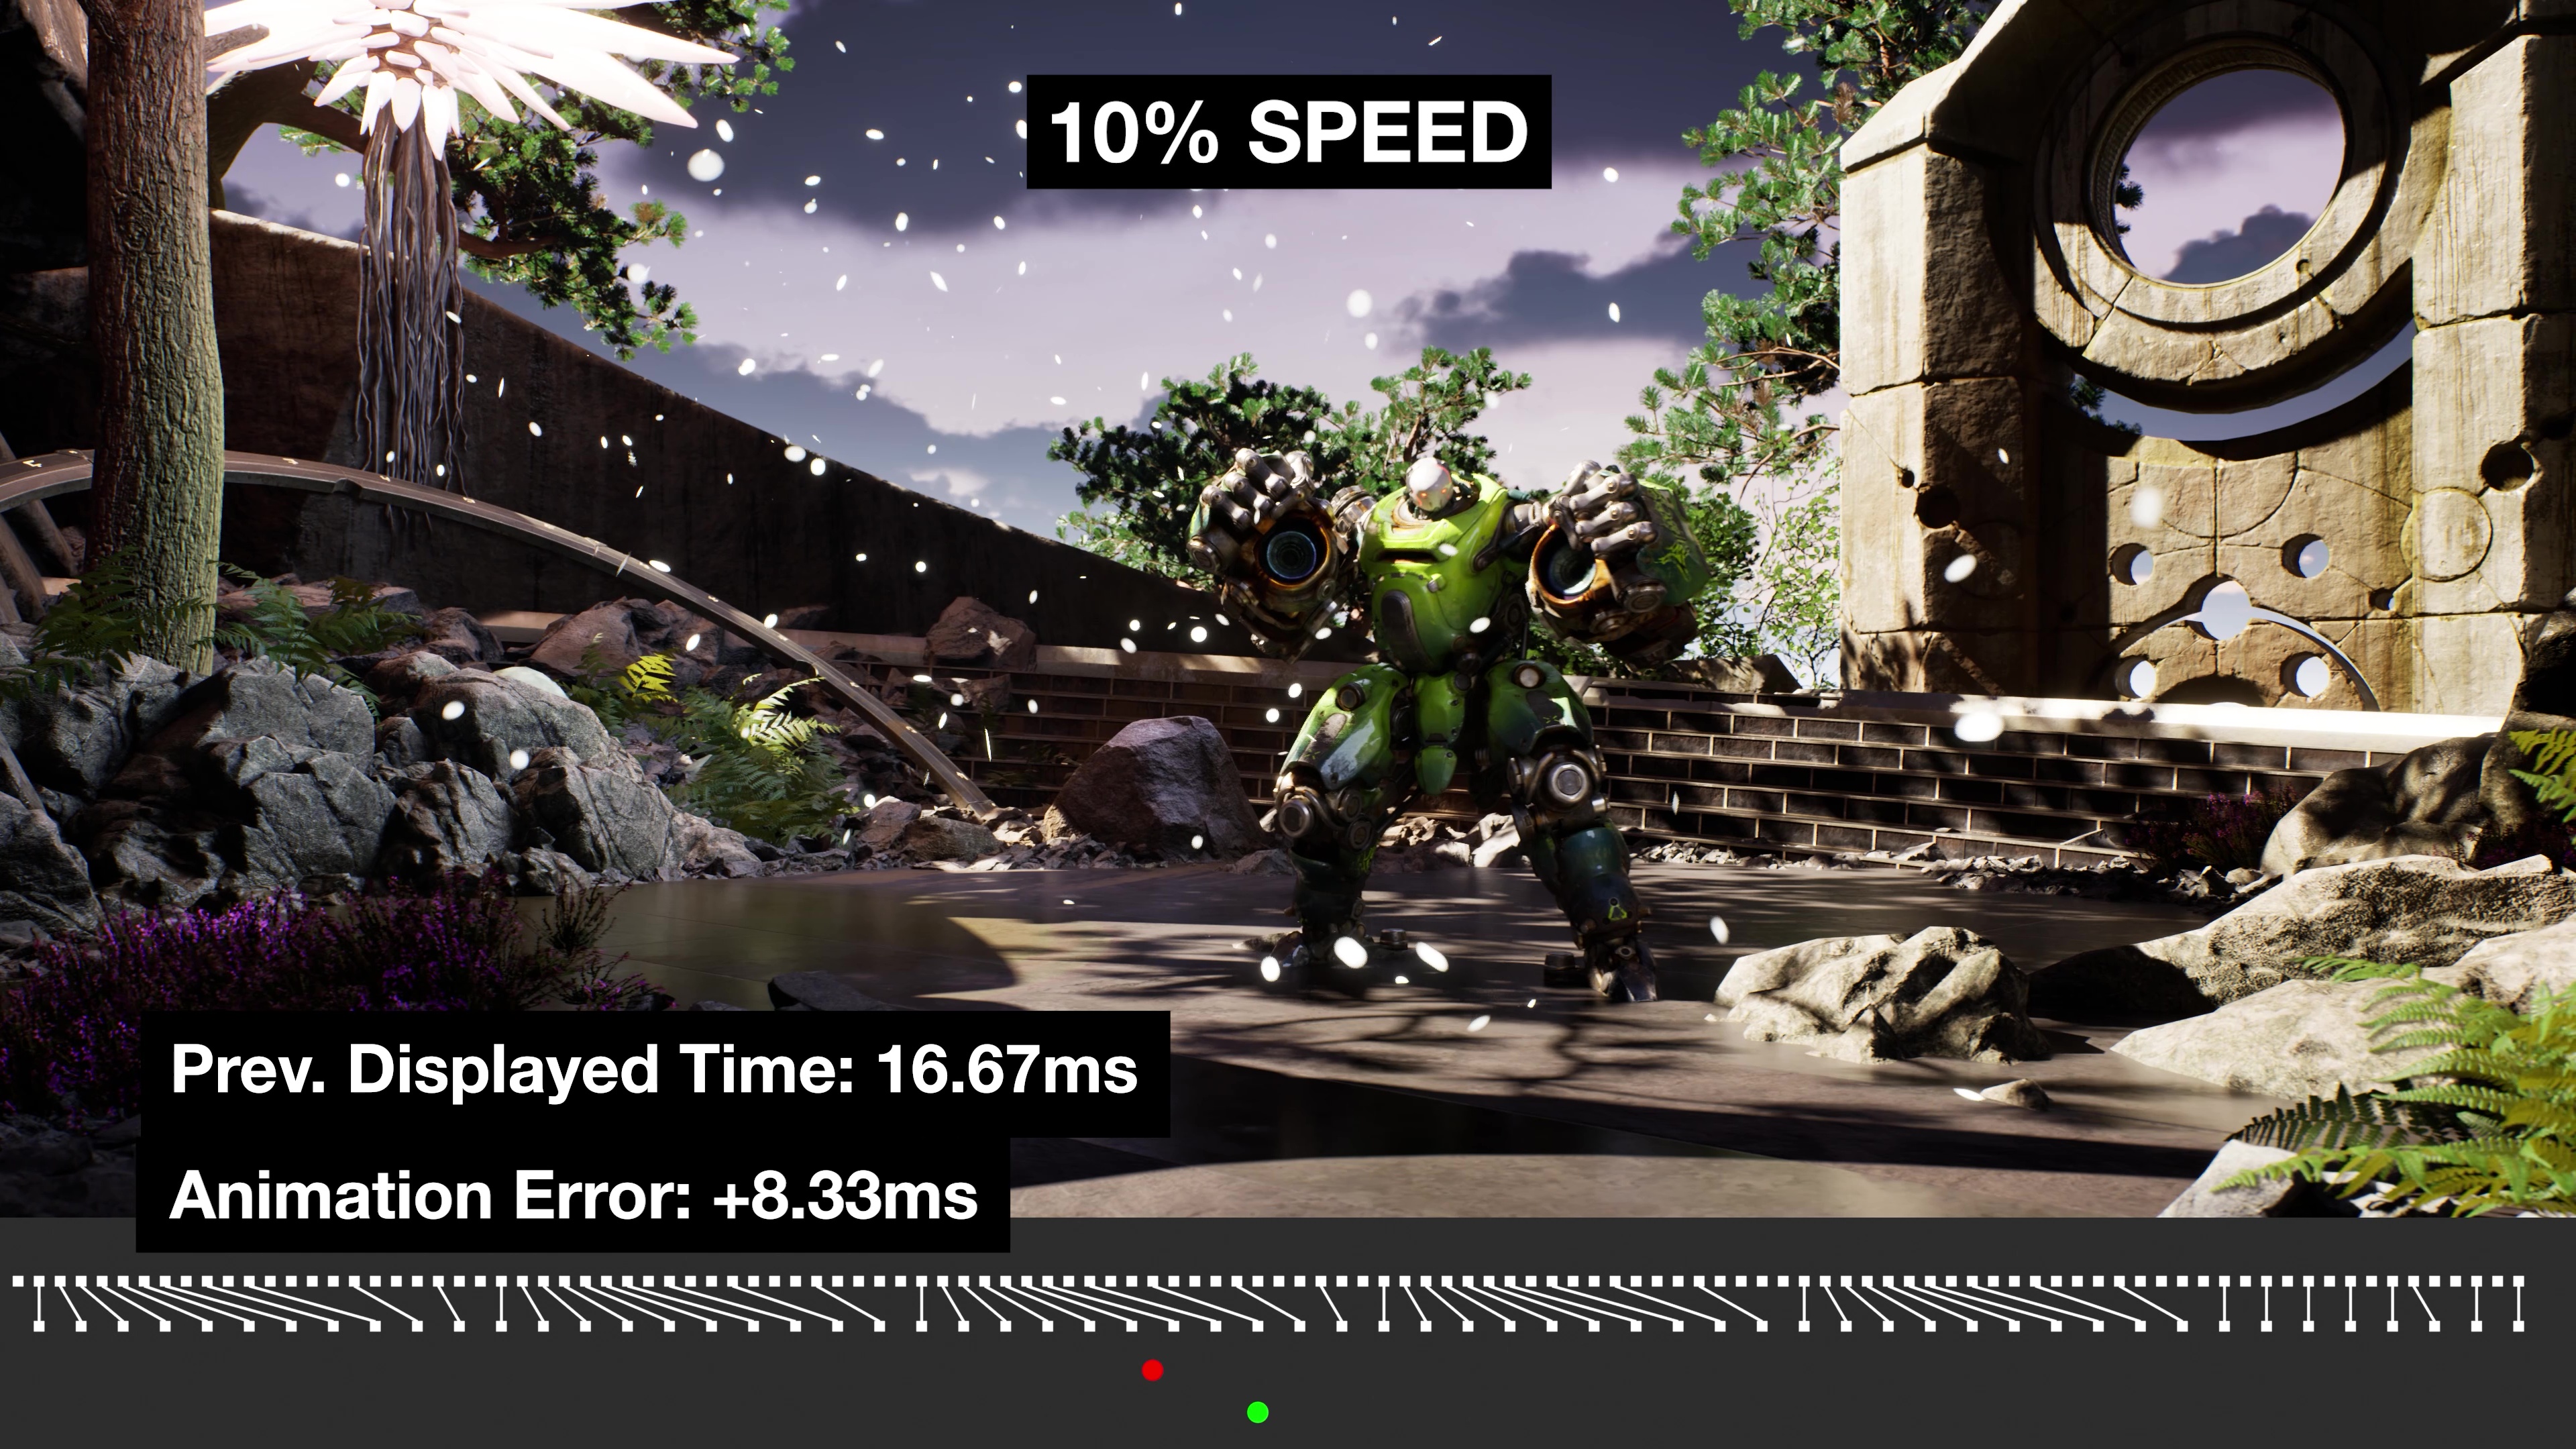
This is that limitation: Frames are displayed at an even pace in this example, but something is still wrong with it. The thing that’s wrong is why we have the new measurement methodology that we’re debuting today: Animation error.
Animation error is the difference between the pacing of animation and display. Putting "animation" in the name might be confusing: Intel called it Simulation Time Error at one point.
And this is a sample chart illustrating what we’re talking about, where you can see the animation error timing sometimes in alignment with frametime spikes, sometimes out of alignment with it, showing that it’s a different thing.
Here’s another chart showing the percent animation error during a test pass.
Or this one, where we show the CPUStartTime versus animation time delta.
These are all new types of benchmark charts that haven’t been shown before. Tom Petersen first pitched the idea of animation error a couple years ago, something he arguably began on about 14 years ago.
The problem with GPU, CPU, and new game benchmarks has always been that it’s tough to accurately capture the actual player experience. Framerate was a good start, and frame-to-frame interval testing (or "frametime testing") was a great expansion on that -- but neither perfectly captures the real experience.
This is what we’re unveiling and detailing today. Consider this a whitepaper, like a research piece that’s intended to put information out to the community for people to start trying to experiment with. None of this is perfect yet, but we think we have a good foundation for viewers and other reviewers to build upon and advance our understanding of game behavior. If you’re a reviewer and this is useful, please point back to this story as it was over a month of work for us to wrap our heads around.
Let’s get into it.
This methodological deep-dive lays the foundation for new testing. It’s exploratory.
We rolled-out 1% low and 0.1% lows in our testing back in 2014, eventually popularizing their presentation on bar charts alongside average framerate. These are the metrics we use today to point us toward a problem with frametime pacing. The industry has relied on frametimes, 1%, and 0.1% averages for over a decade now with few new metrics in between.
The history to that is all important, and it’s important that those who did the groundwork before us are known: Tom Petersen, PC Per’s Ryan Shrout, and Tech Report’s Scott Wasson all advanced this metric, with Petersen doing heavy lifting on providing software tools and early insights to frametime analysis. His engineering work has continued with the open source tool PresentMon, which gets us to animation error today.
Animation Error should be thought of in a more traditional sense: Like a flipbook with perfectly animated drawings, but without the execution of flipping through the pages at a constant tempo. That's just one specific scenario for animation error; you could extend the metaphor, like flipping through the pages perfectly but messing up the drawing (or you could do a combination of both).
We're talking about animation in the dictionary sense, "a movie, scene, or sequence that simulates movement from a series of still frames," so animation error applies to entire frames. Think of it like frames of drawings on an animation lamp, in a flipbook, or on a reel of film. We're NOT talking about errors in animation of individual models, objects, NPCs, or sprites within the frames, and we’re also not talking about games that just have bad animation from the artists.
You could technically have animation error even staring at a blank wall in-game without any movement whatsoever, though it might be impossible to notice.
This all comes down to two things: Smoothness and acceleration. When we were talking to Tom Petersen about this concept, he made some good points about this. Showing frames faster allows the brain to interpolate and generate an illusion of smooth motion, which is the illusion of TV and movies. But the brain also knows how to identify acceleration, something Tom equated back to “monkey times like running away from lions and shit.”
This is an example of animation error that we created in 3D space. It’s very smooth and accurate as a rate, but it’s slow. Every now and then, you’ll see an error in it despite the smoothness of the frames, and that’s stutter. When the brain sees even subtle acceleration or deceleration, we pick it up quick. That’s what makes it feel so bad when we see stutter in gaming. Stutter is what you’re seeing here: Something accelerates or decelerates quickly and the body is overreacting because, to quote Tom, “we don’t want to be eaten by a lion, or some shit like that.” He really has a gift with words.
But it would be great if we could measure smoothness and acceleration separately, because they’re different problems: Framerate and frame-to-frame interval evaluate smoothness, but acceleration is something we haven’t done a good job at quantifying in this industry. That’s characterized by animation error, which we’re introducing with its first full charts today.
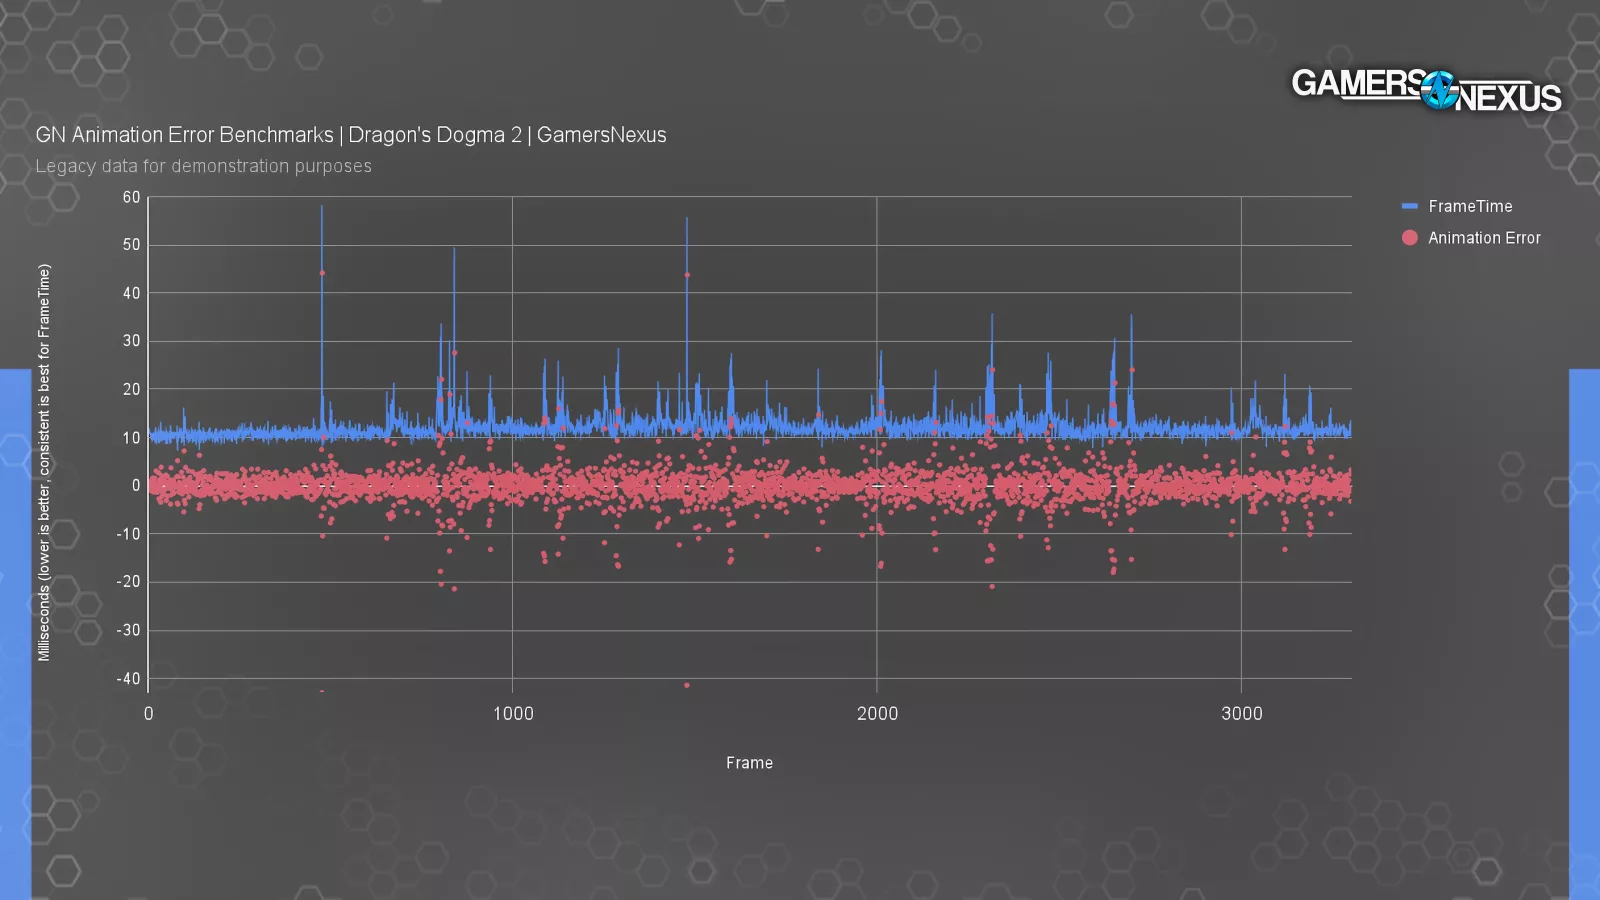
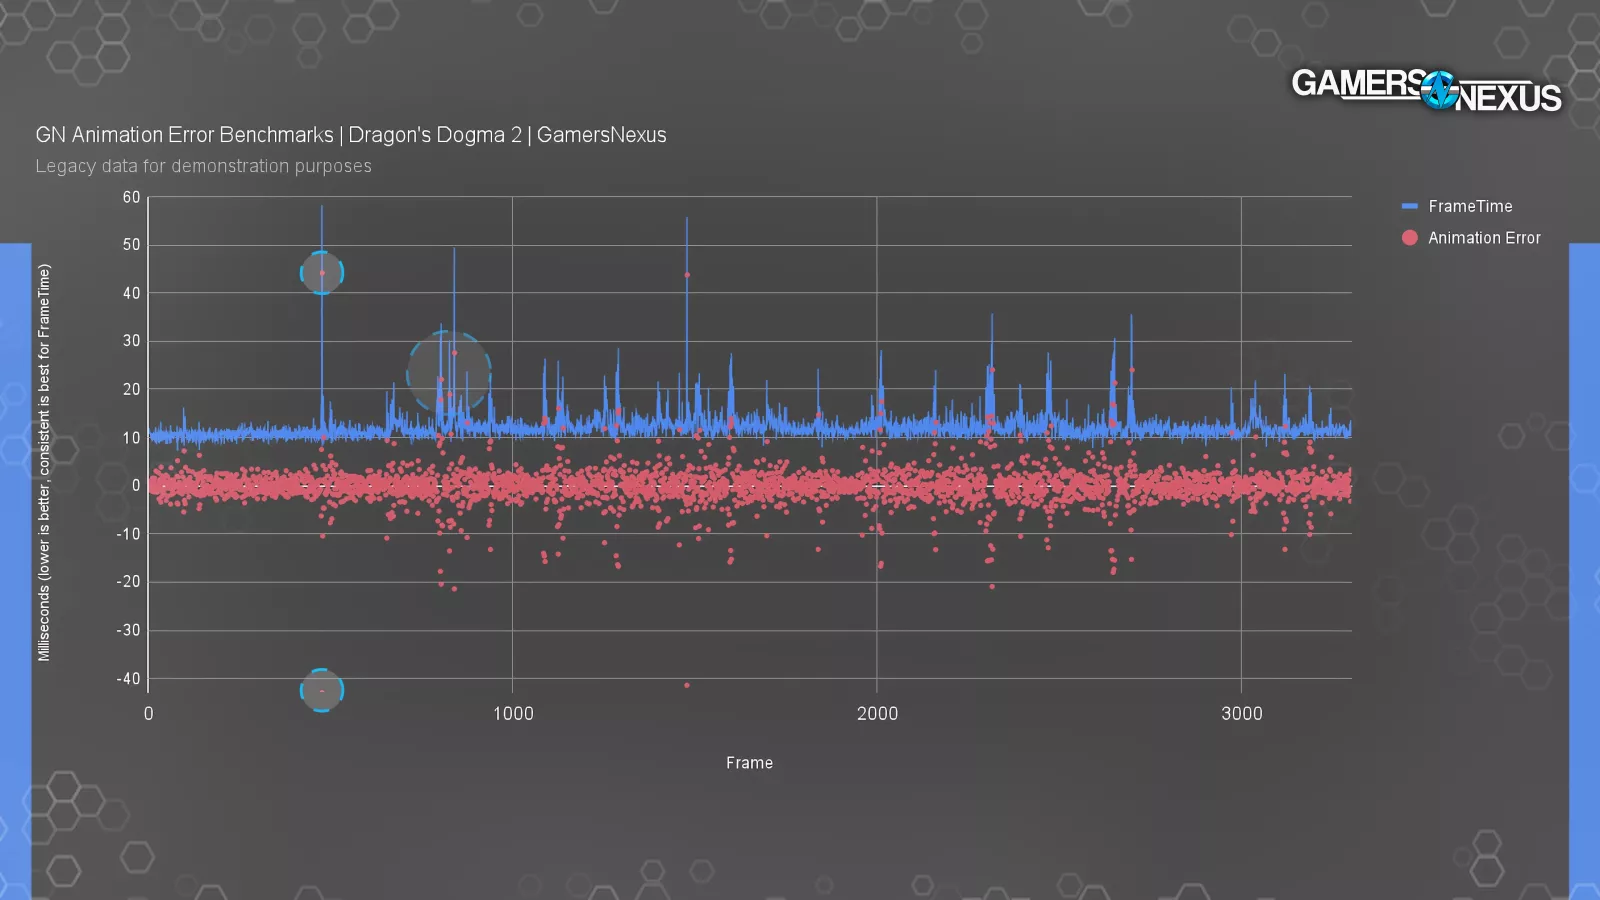
This chart is from our Dragon’s Dogma 2 testing at launch, where we were quietly beginning to farm data for this eventual piece. You can see where the animation error blips often align with the frametime spikes, but not always.
AnimationError can also be positive or negative. When a frame is displayed "too late" (relative to its correct placement) that's a negative error, and when it's shown "too soon" that's a positive error. Neither is good. At a macro level, it doesn't matter which is which: further away from 0 is always worse.
The idea is that if frames are created at a certain pace, you should see those frames displayed at the same pace. There are differences between animation error and frametime pacing, though.
If there's a mismatch, that's where the animation part comes in: movement depicted in the frames will appear jerky and wrong, even if frametimes are perfectly consistent.
For a real-world demonstration, the simplest, most reliable way we found to directly induce animation error was with SLI.
Yeah, we know.
We can take one card and get a normal result, then add a second and get a result with higher animation error.
That limits us to older hardware, and it also limits us to GPUs that we own in pairs. We selected two 1080 Tis (read our revisit) since they're our newest cards that still use regular old SLI, and (as of now) they're still supported in the most recent NVIDIA driver package. We also had to select a game that supported SLI.
We’re getting into benchmarks. We’ll break these down starting at the most abstracted metric, which is this chart.
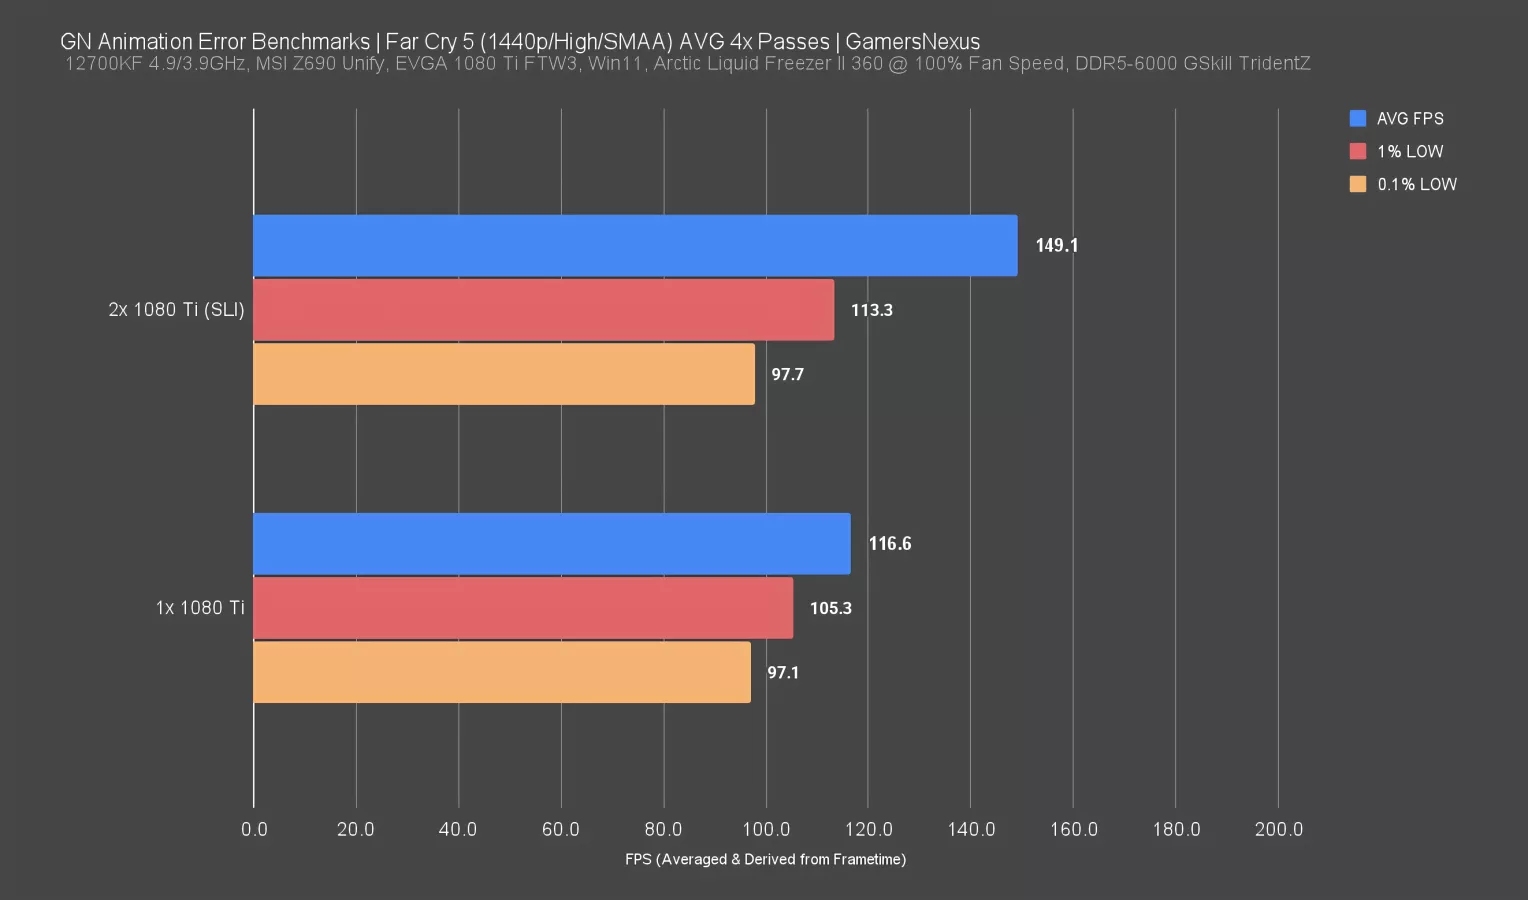
This is framerate represented as bars, abstracting away from time. Next, we’ll look at the frametimes that create this framerate average, and last, we’ll look at the new animation error metric.
These are averaged results for 30 second logs of Far Cry 5's baked-in benchmark, one using a single 1080 Ti and one using two 1080 Tis in SLI. The 1% and 0.1% lows indicate that there weren't huge frametime spikes, and it’s these metrics that tell us when we should inspect a frametime plot closer for major problems. Average FPS smooths over problems, 1% and 0.1% are still averages and can still smooth over them, but are more likely to draw our attention toward a problem because they’re averaging the worst 1% and worst .1% of data.
As a reminder, we aren't using percentiles, which is a different way of approaching this. We explained that in our video where we did JayztwoCents' lab overhaul.
The average with SLI is higher, as expected; however, beyond that, there’s no dramatic change between how these numbers manifest. The single GTX 1080 Ti appears to have closer frametime pacing to its average, which is what we’ve been preaching for years as a good result, but the dual 1080 Tis still look good overall.
Data Presentation: Frametimes
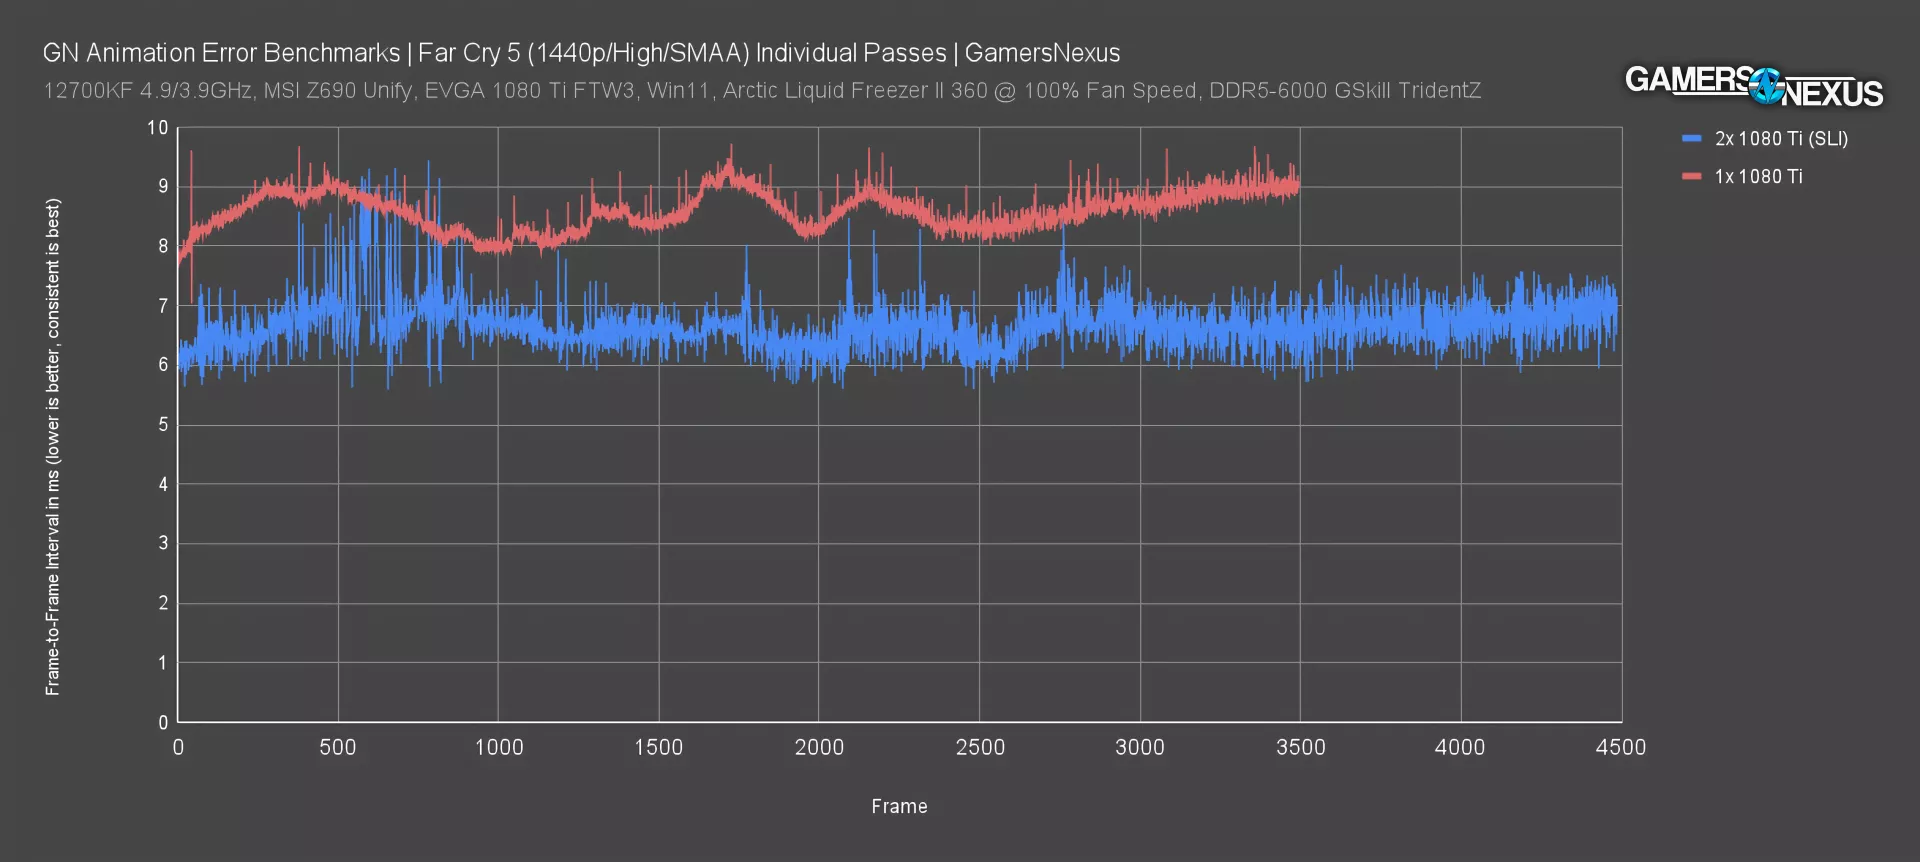
The frametime plot helps us see deeper into those bars.
This still isn’t animation error, though, and it’s still not new.
This plot of frametimes is for two individual passes. As we know based on the last chart, the SLI run’s gap between the average and its 1% and 0.1% metrics is wider. Here, that materializes in the form of spiky behavior (particularly in the 500-1000 frame range) for the SLI configuration. The experience is far less consistent, with more sporadic frametime excursions from baseline. Most users begin to notice these around 8ms, according to an interview we conducted with Scott Wasson years ago, but only if they frequently occur.
The single-card run has more consistent frametimes, despite its lower average. It’s not so bad that it’s a ruinous experience, as the SLI configuration is ultimately still within the range of 2-4 ms of the baseline, but the relative distance from baseline is larger. It’s not like we’re seeing 100ms spikes where you’d stare at one frame for 1/10 of a second, as we’ve seen in other tests on modern single cards.
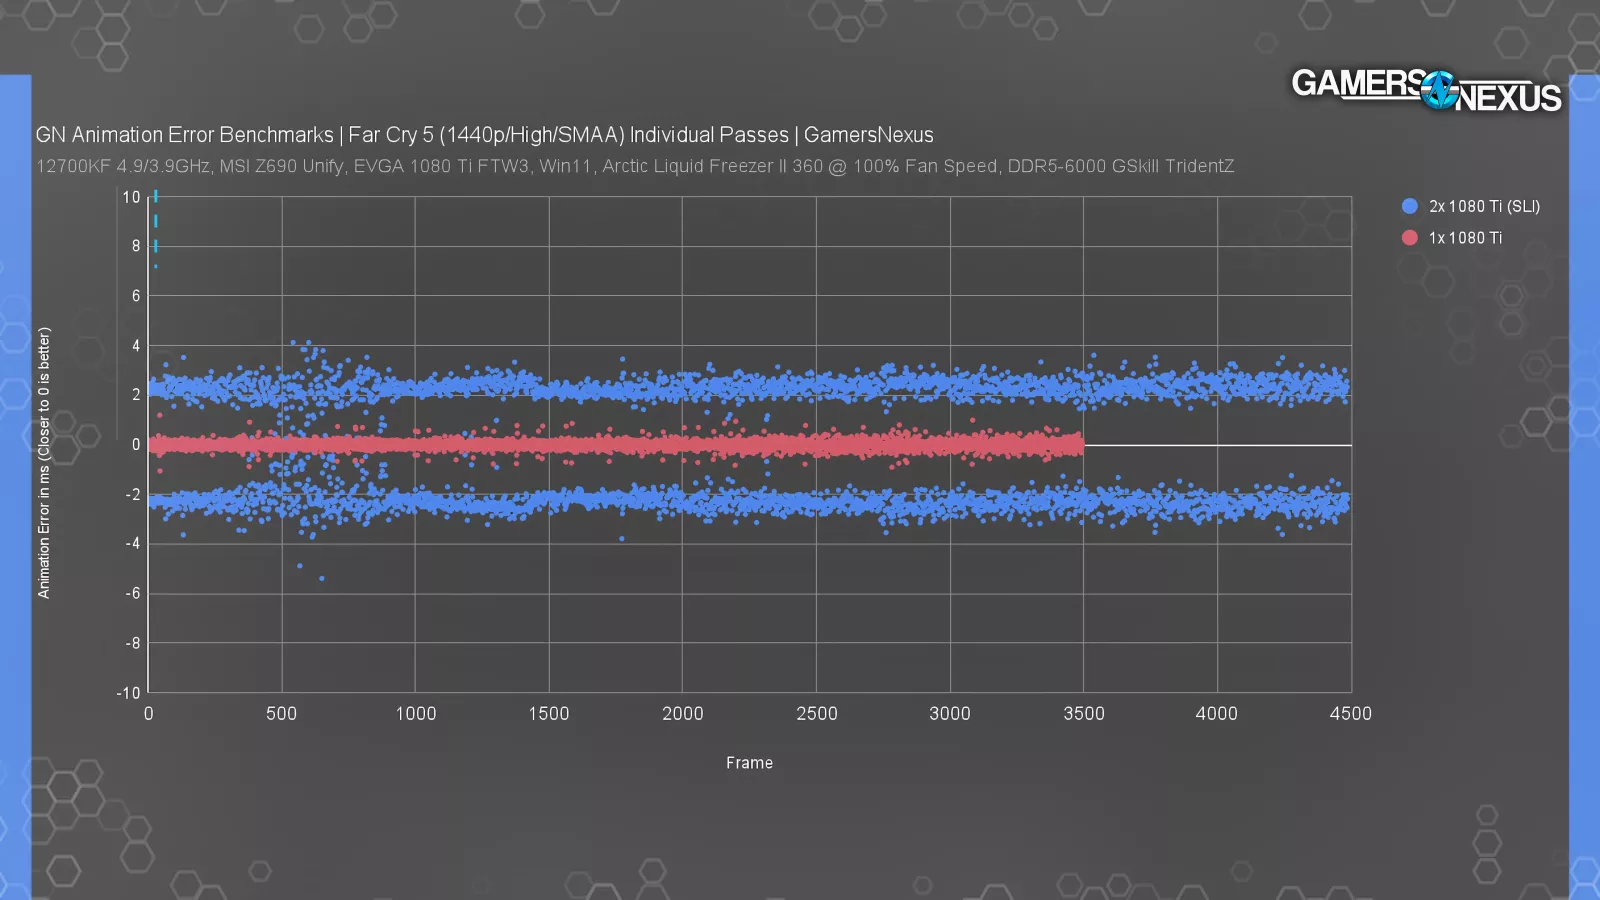
Data Presentation: Animation Error
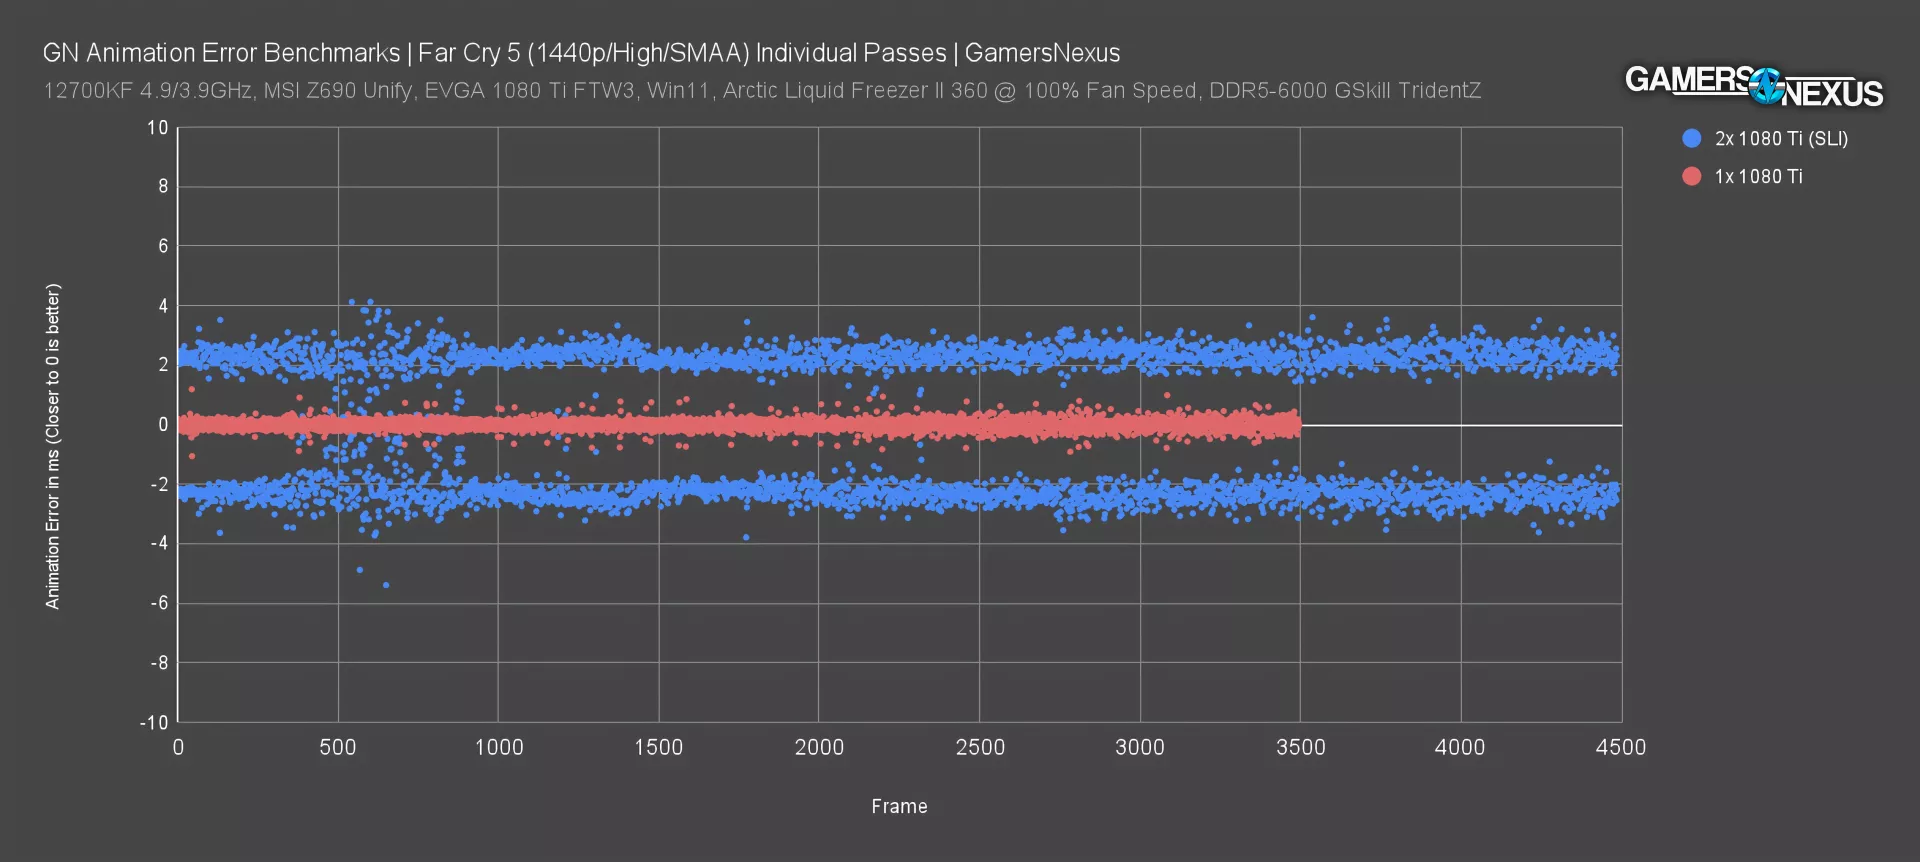
Here’s the new stuff.
The left axis shows animation error in ms, with deviations away from zero depending on whether frames showed up too soon or too late. 0 is perfect and 0 does occur. The X-axis represents frames, the same as the frametime plot we just showed. The animation errors could also be taken as absolute values for a lower-is-better representation, but this is a plot of the raw data as logged by PresentMon.
There are many ways this data could be plotted. A scatterplot lets us judge the data points individually, but still keeps the points in order so we can see how behavior changes over the course of the test. Lines between the points wouldn't mean much here.
By plotting the animation error, we can get rid of frametimes as a variable and just compare that relative spikeyness as a player would truly feel it interacting with the game itself. This is closer to the real experience, in the same way end-to-end latency can be but for different reasons. The further the deviation from zero in either direction, the worse. The cards in SLI frequently had 2-3ms of animation error per frame, while the single card typically had well under 1ms animation error. The SLI configuration is significantly worse for animation error in a relative sense, despite even the frametime data looking not that dramatic.
The single card is clearly far better in terms of animation error, although we need more data to judge whether the SLI result is "bad."
Strange Brigade Animation Error
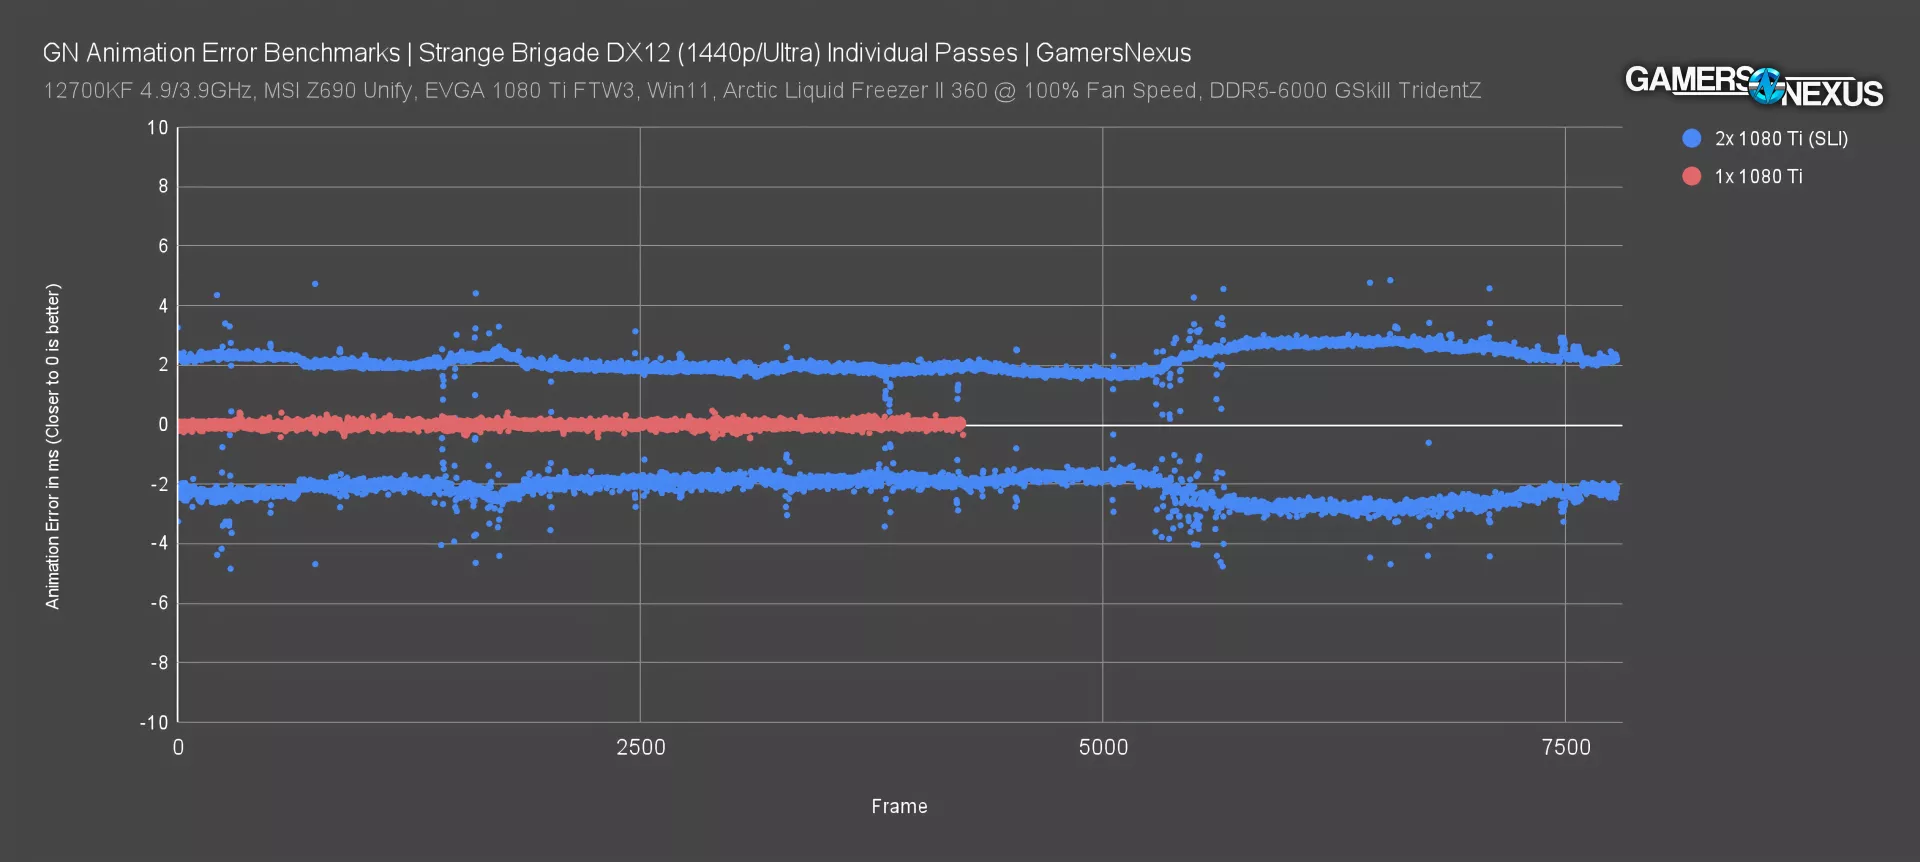
This is another test. This time, we’re using Strange Brigade. Our goal today is exploratory, so we’re choosing games based on usefulness to explore the concept, not on their popularity. That’ll come later.
The main advantage of a plot like this is that we don't have to insert our own calculations or conclusions: we can simply show the data. The single 1080 Ti sticks even closer to zero animation error per frame than it did in Far Cry, while the SLI 1080 Tis continue to generate 2-3ms of positive or negative error on nearly every frame, only rarely approaching zero.
SLI outperforms the single-card so heavily in this title that the red line is significantly shorter, which is a downside of using frames as an X-axis. Even though both its average framerate and its 1% and 0.1% lows are overall good here, the animation error is far superior on the single GPU. There is a possibility that it feels better to a player, but not for the reasons everyone in this community has said for years: It’s not due to frametimes, on a technicality, but animation error, which is a metric that has been under the surface this whole time.
Animation Error Bar Chart
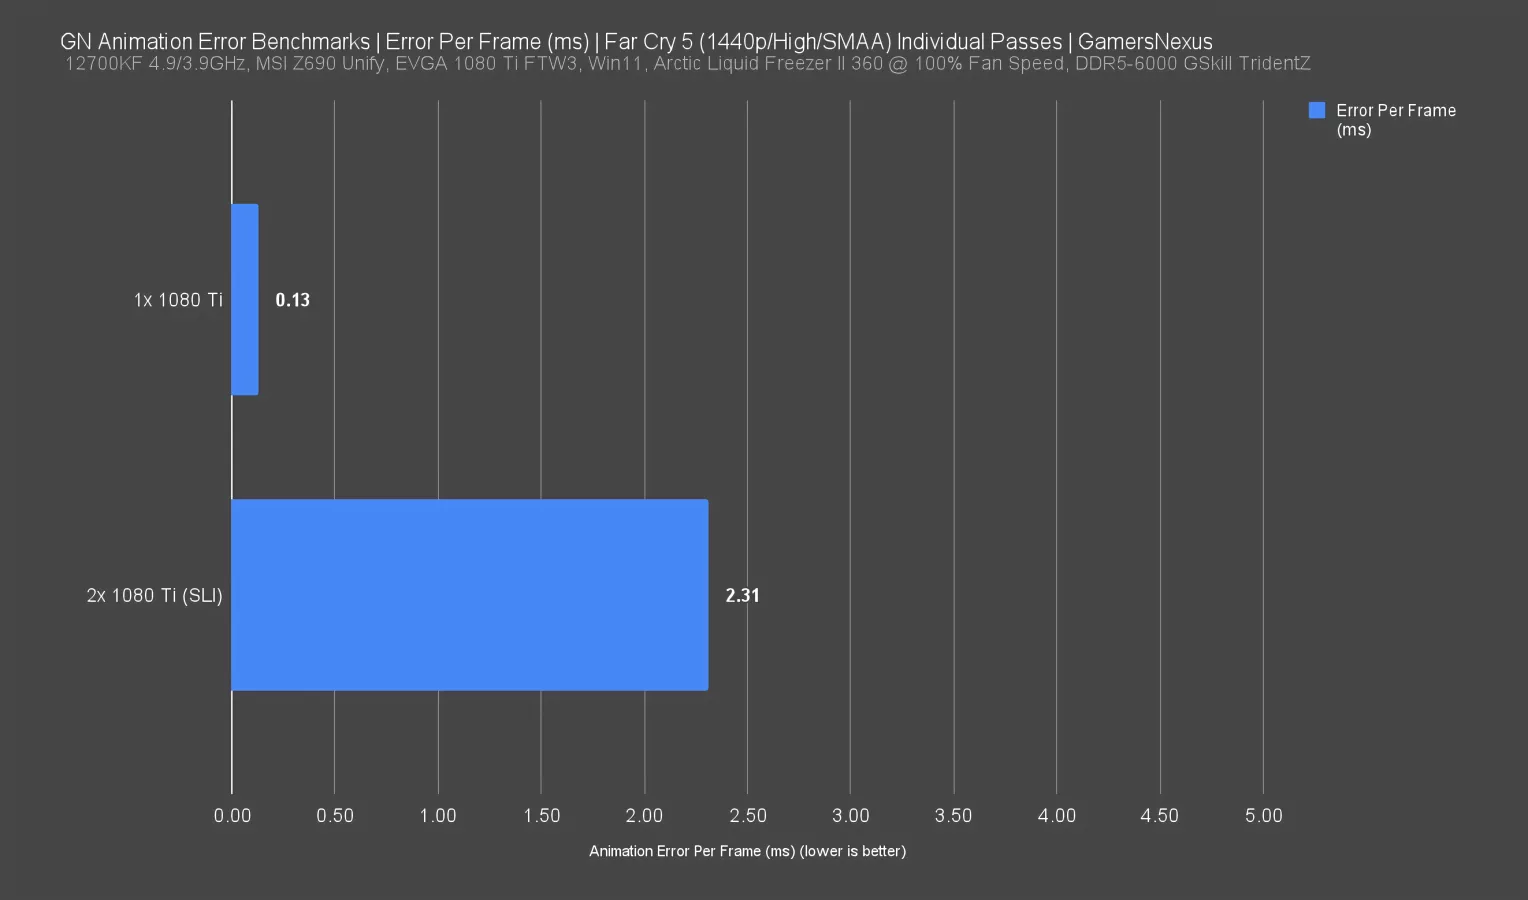
This is an “Error Per Frame” chart we attempted, which puts the data back into bars for denser comparison of more cards. Maybe this could work better as a visualization: for those two individual passes in Far Cry from earlier, the total animation error (taken as absolute values) divided by the total number of frames was 0.13ms per frame for the single 1080 Ti and 2.31ms per frame for the SLI 1080 Tis. These are basically single-number summaries for the plots we just showed. But now we’re doing the bad thing again: We’re abstracting away from the base metric over time (shown as frames) and converting it into a bar, because that’s easier to read. This isn’t ideal for a lot of reasons.
First of all, this could obscure individual big error spikes (if that's something we want to track), and secondly, it also adds framerate back in as a variable. The SLI setup generates more frames, which lowers the end result for this calculation, arguably making the SLI cards look unfairly good; then again, maybe it’s not “unfairly” because more frames going by quicker could help disguise animation error.
This is getting complicated, but you can see why we’ve had to think about this for weeks.
Far Cry 5 Animation Error Percent
So we don’t like the prior chart for those reasons, and the scatter plot doesn’t accommodate more than two or three GPUs before it’s illegible. Maybe this will help.

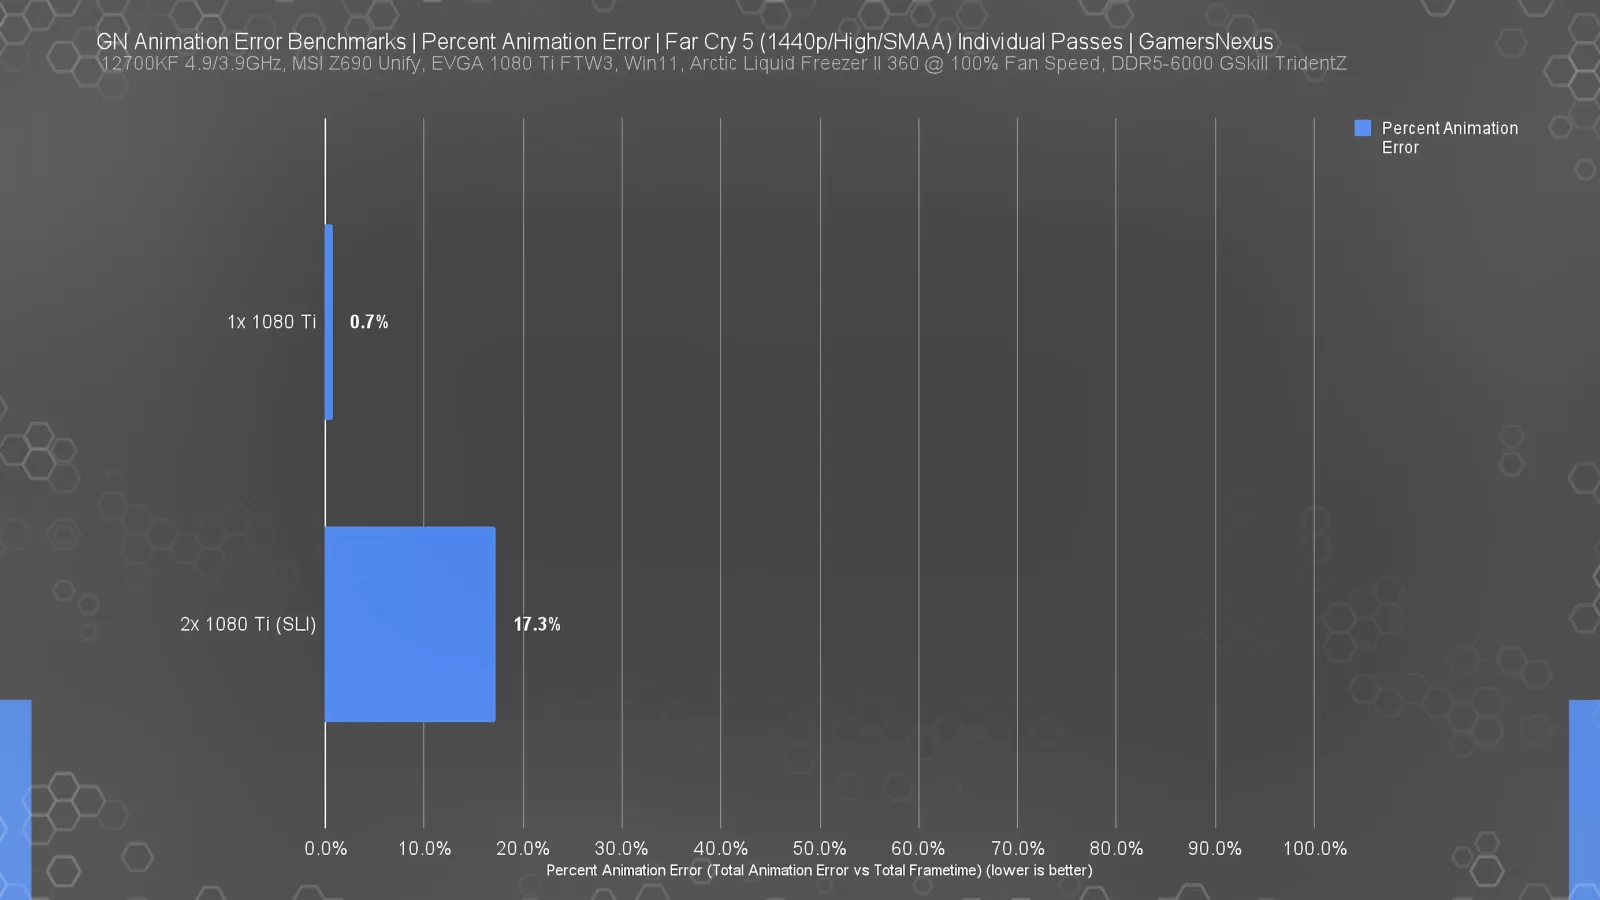
This alternative was suggested by Tom last year. It divides the total animation error absolute values by the total frametimes (the length of the test run) to get a ratio or percentage.
This is equivalent to comparing those average error-per-frame numbers from the last chart to average frametimes.
However, in order to make this chart we’re showing accurate and not misleading, we had to use two times the total frametimes for the calculation because otherwise, the implication is that 100% is the maximum value, and it wouldn’t be if we hadn’t corrected for that, and that’s because in the absolute worst case scenario and assuming that latency doesn't accumulate over the course of the test run (which is a different subject entirely), the maximum total animation error would be twice total frametime.
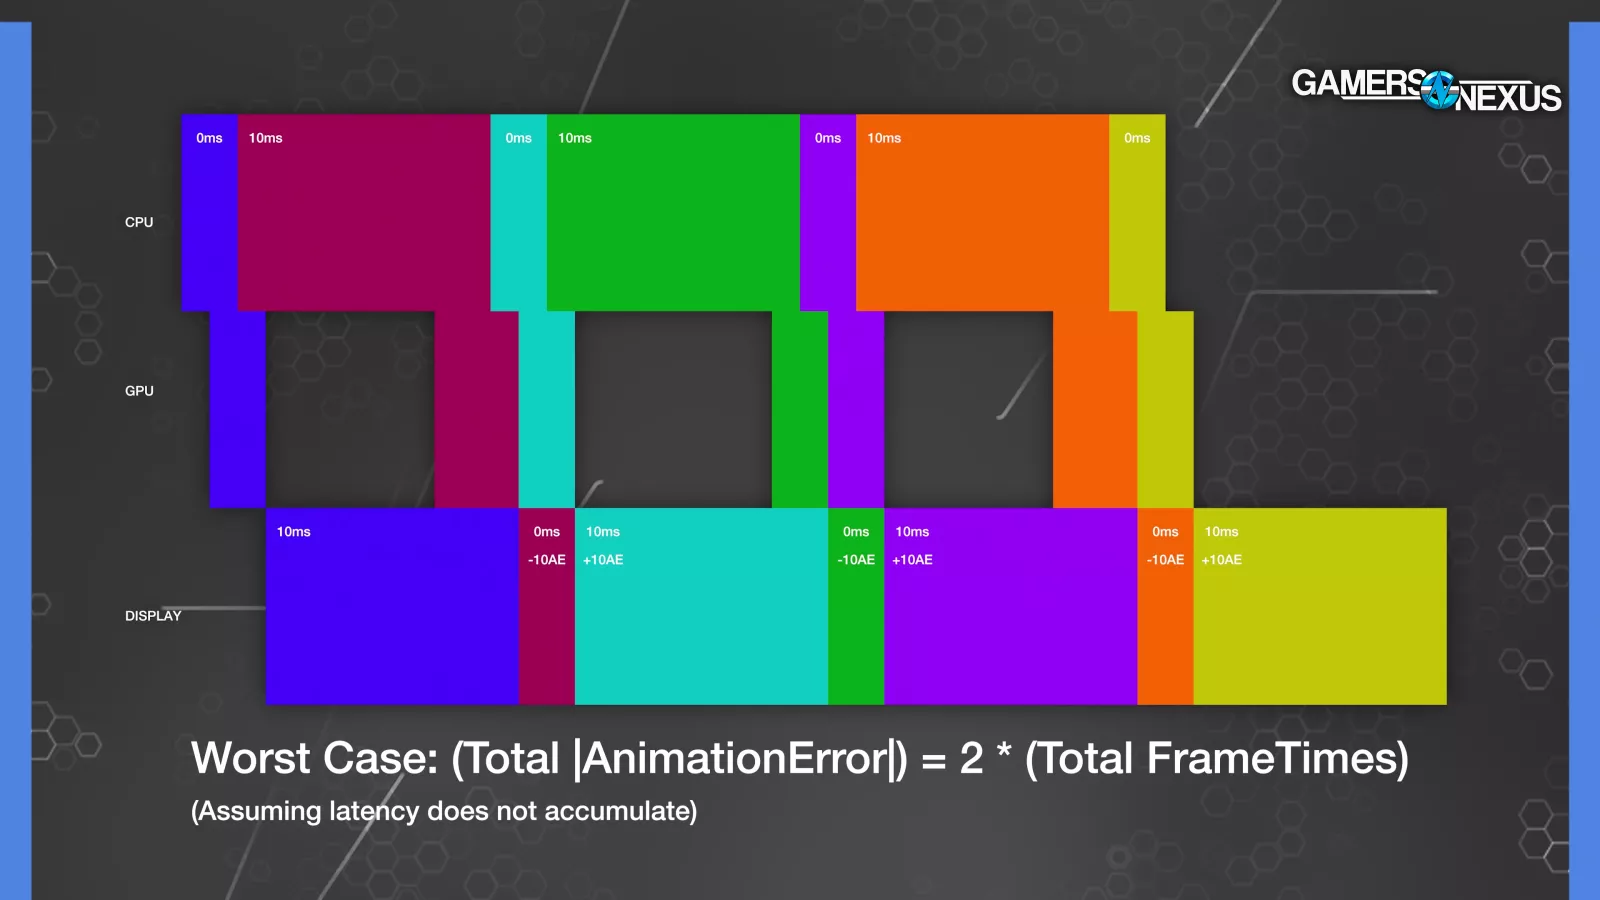
THIS diagram makes that abundantly clear by showing that alternating between infinitely small frametimes rounded to zero and 10ms frametimes, and inversing the display times, we can get 10ms or -10ms of animation error per frame, where adding up all frametimes gives us 30ms yet adding up absolute values of the animation error gives us 60ms.
OK, this graphic really isn’t helping make it less confusing. The point is, we already corrected for this in our percent chart and any other reviewers planning to use such a chart will need to do the same.
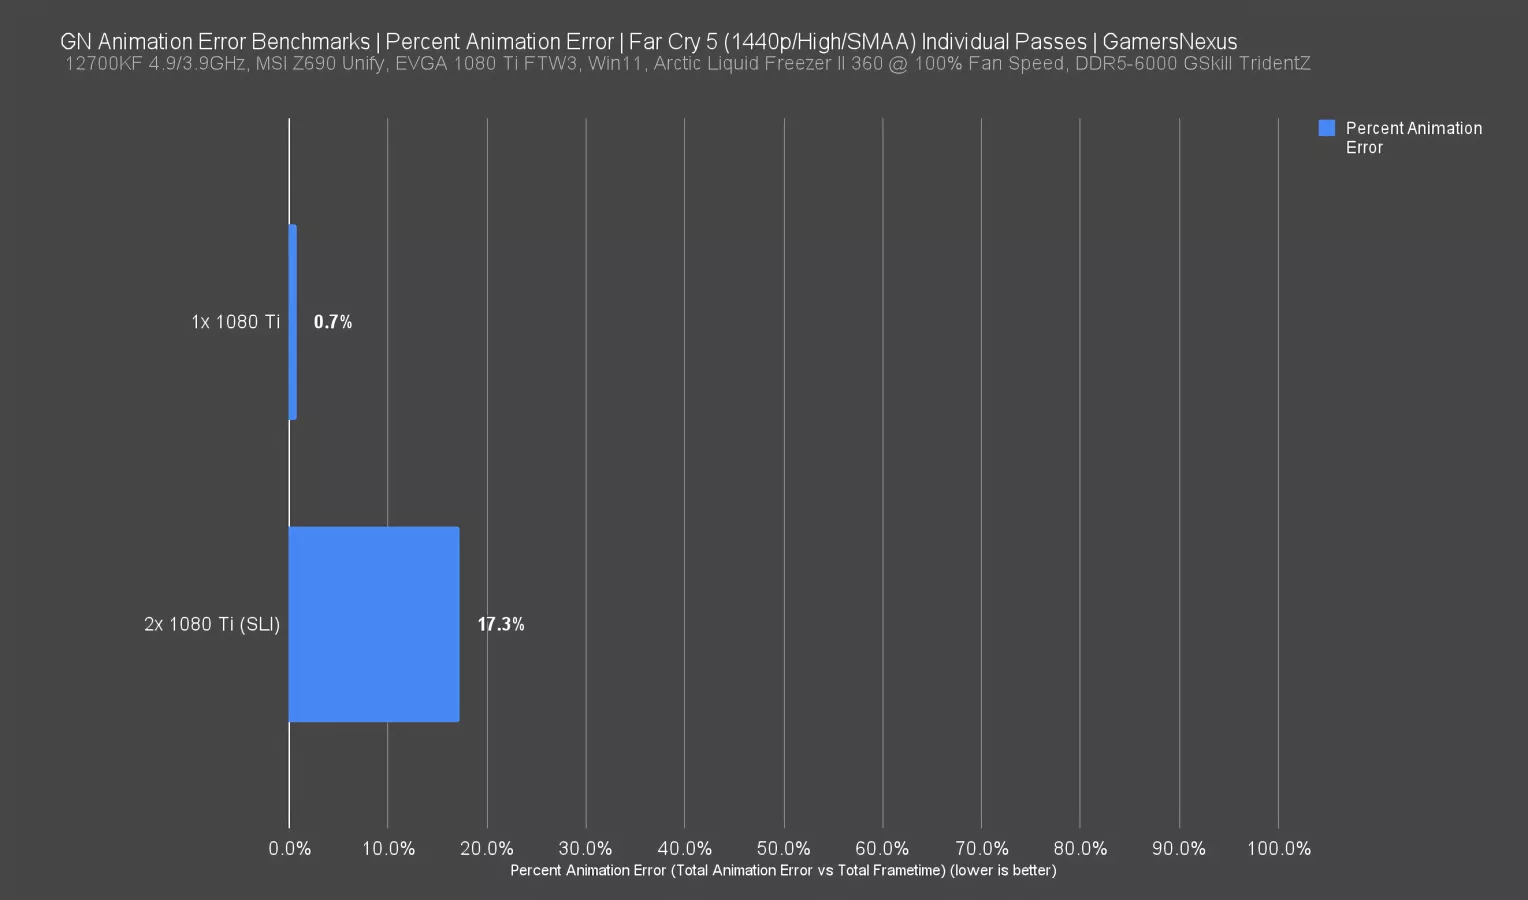
We used the same two Far Cry passes for this example: for the single 1080 Ti, the result is 0.7%, and for the SLI setup the result is 17.3%. This potentially cancels out or reverses the high-framerate advantage from the last chart: more frames equals more (total) error.
Real-World Uses
Let’s talk potential real-world use cases. Maybe this will give other reviewers some ideas.
Animation error is theoretically decoupled from framerate and frametime consistency, although in reality poor performance correlates across all of those categories.
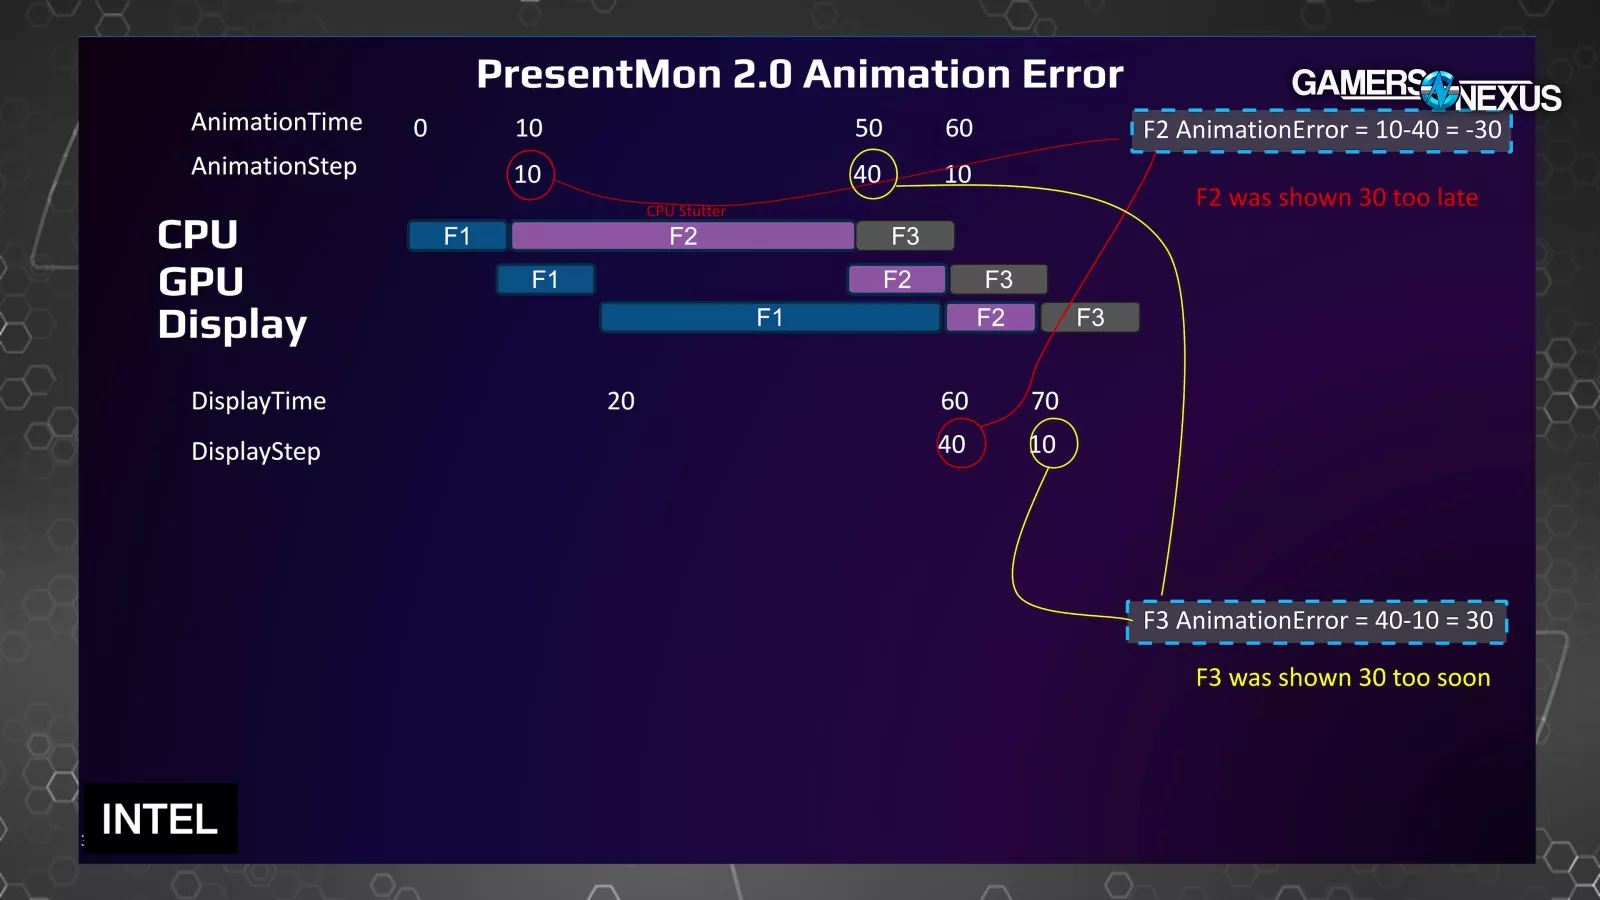
In this mockup from Intel, the bar marked "CPU Stutter" marks a frametime spike, while the mismatch between the sizes of the bars in the top and bottom rows is the animation error (F1 versus F1 = error for F2, F2 versus F2 = error for F3), so we'd see similar spikes in both metrics.
Animation error is also separate from latency: it's about how the frames are spaced, not whether they're all showing up ten seconds late.
Frame generation has interesting implications for animation error, but unfortunately there's no animation time for fake frames, so there's no reference point for calculating error. That makes this whole thing even more challenging to quantify.
We'd like to check on NVIDIA MFG in particular, since that comes along with flip metering that shuffles frame timings around at the end of the pipeline, which has the potential to actually induce animation error (as we mentioned with the SLI example).
Animation error could shine a light on shortcomings of flip metered frame generation that are currently masked with existing testing methods, but we won’t know until the software works on it, which may at least partially rely on NVIDIA’s willingness to play ball.
Dragon’s Dogma 2 Animation Error
Because we expect AnimationError to correlate with frametime spikes most of the time, its most common usages for us will be similar to 0.1% lows and frametime plots, but with a more direct representation of how the game feels.
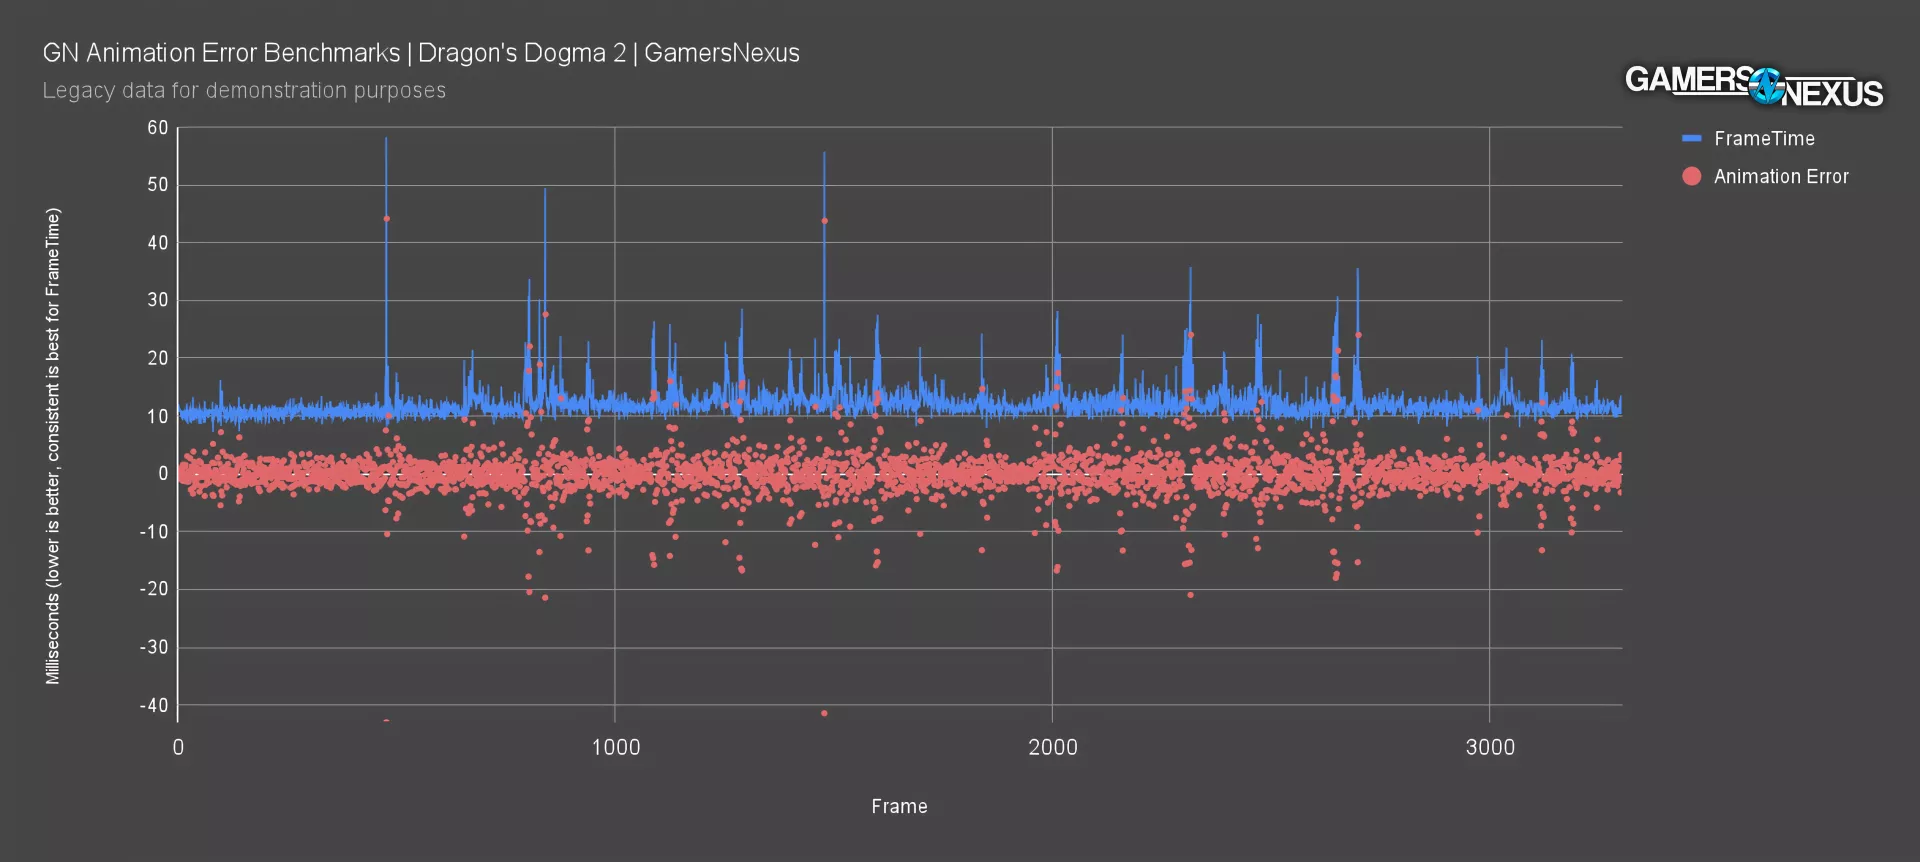
For example, this is a chart that Tom helped us generate during the early stages of troubleshooting Dragon's Dogma 2's performance back when it launched -- that’s how long we’ve been thinking about this data.
The spikes in both metrics line up exactly, but animation error adds depth by telling us why the stuttering was so noticeable and unpleasant. The positive and negative animation error dots that correspond to the frametime spike toward 60ms around frame 500 shows a potential for 45ms of animation error. That’s potentially a lot more noticeable than even the already noticeable frametime hitch of 58ms.
Borderlands 2 Animation Error
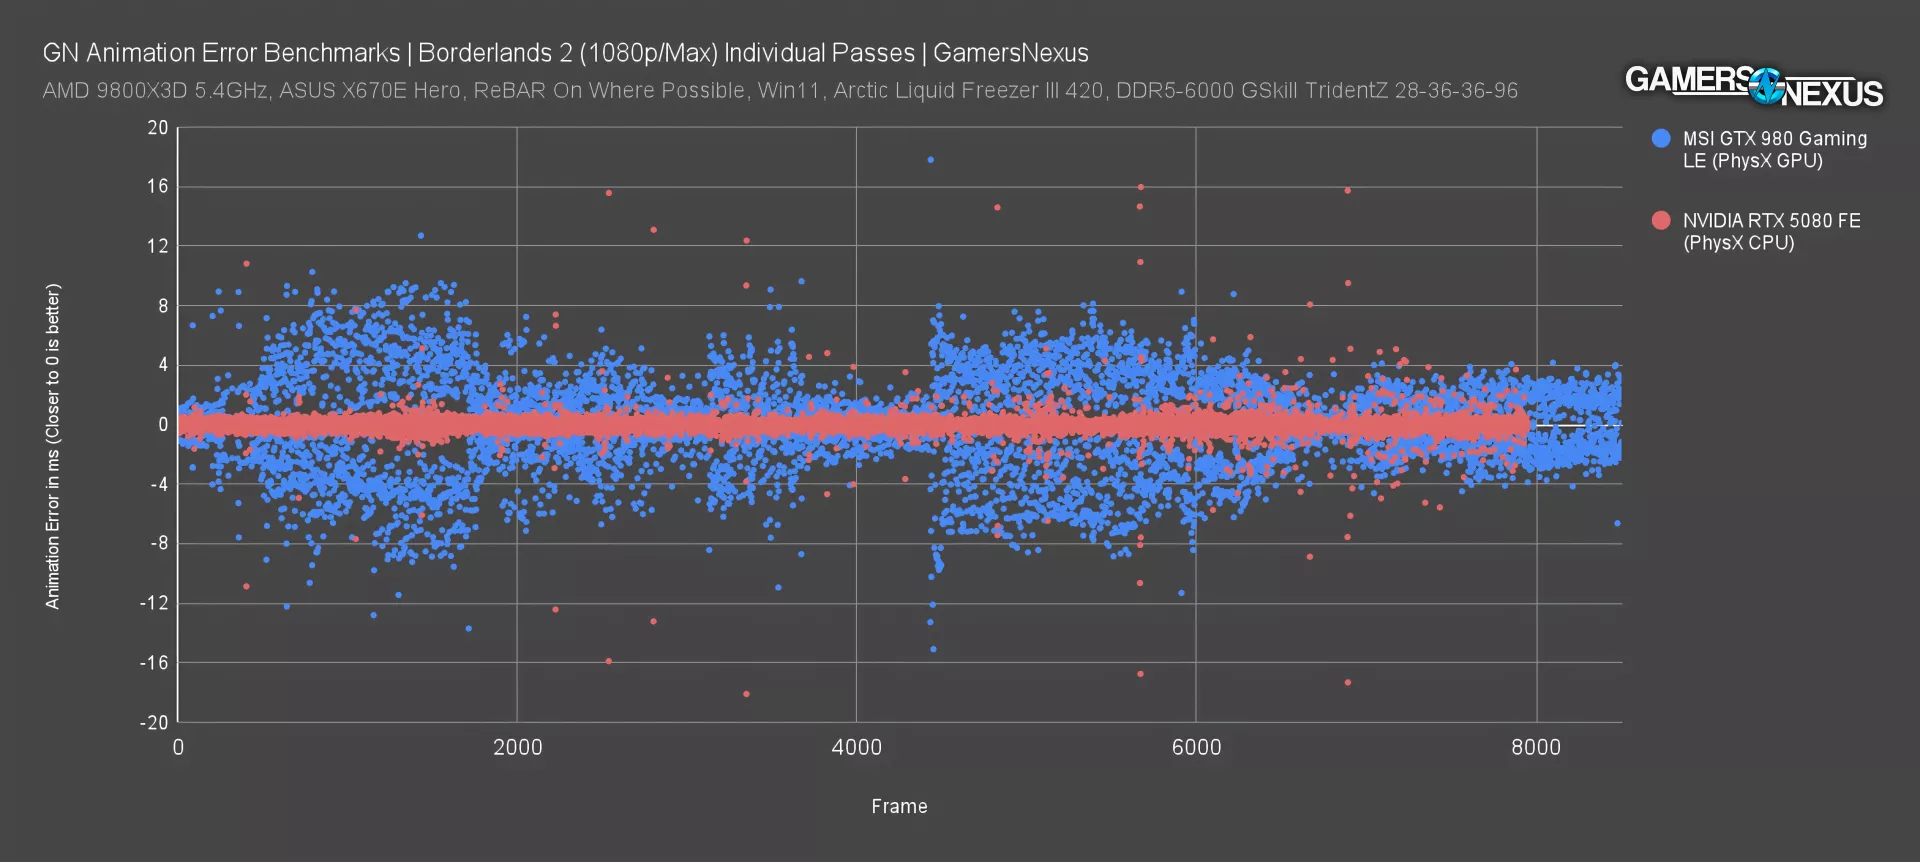
Here’s Borderlands 2. Yes, we know there are newer ones. But this is a better demonstration.
Since animation error effectively cancels out framerate differences, we can use it to compare two completely different pieces of hardware and get more nuance out of it.
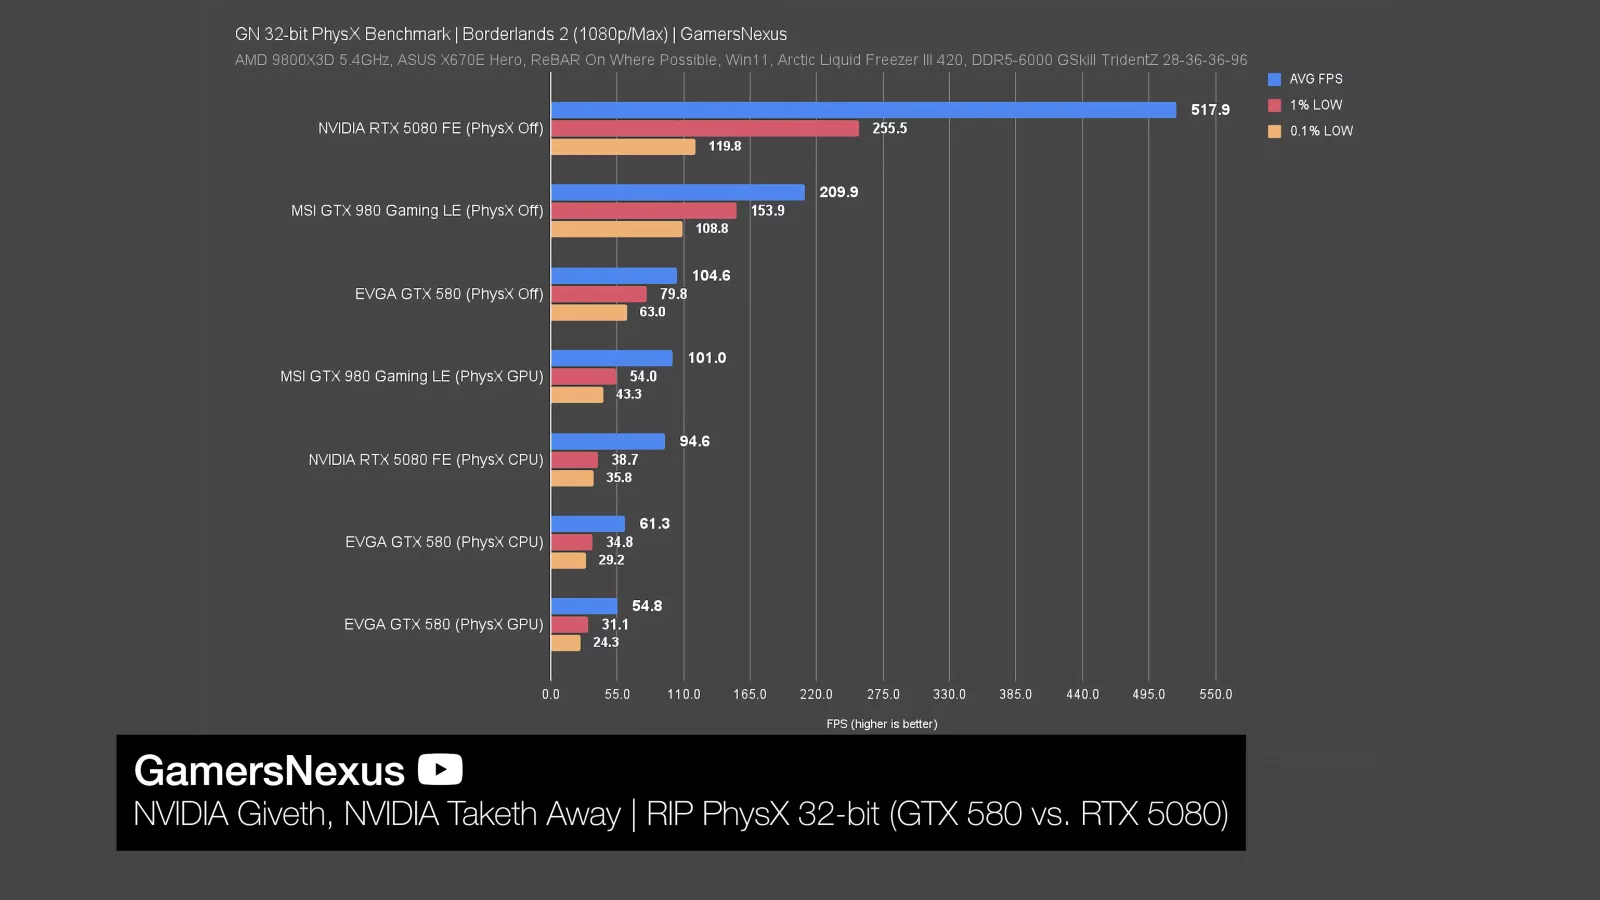
These two results are from our piece about the death of 32-bit PhysX. These two particular results were fairly close together both in terms of average FPS and lows: the GTX 980 with GPU PhysX averaged 101 FPS across multiple passes and the RTX 5080 (read our review) with CPU PhysX averaged 95 FPS. These are real results and we explained them in our piece about NVIDIA killing 32-bit PhysX support this year.
In spite of that, there's a clear difference in behavior, and animation error is much higher with the GTX 980. Using the percentage math we mentioned earlier, that's an error-to-frametime ratio of 11.9% for the 980 and 1.8% for the 5080, which allows us to identify a problem without having to generate frametime plots for every single result.
Percentile Limitations
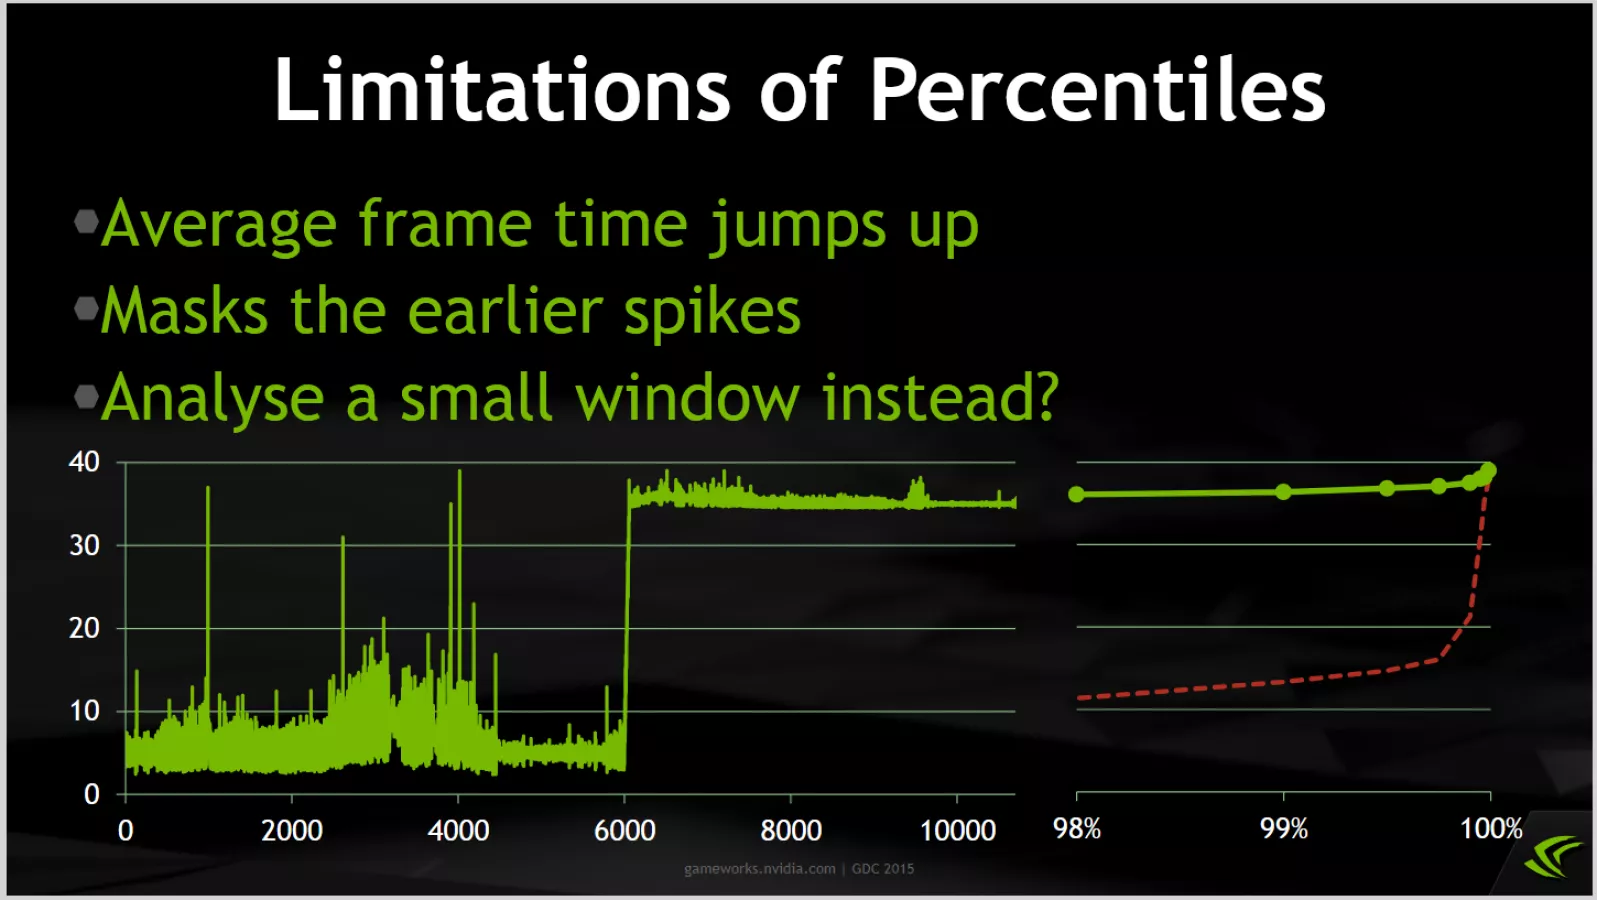
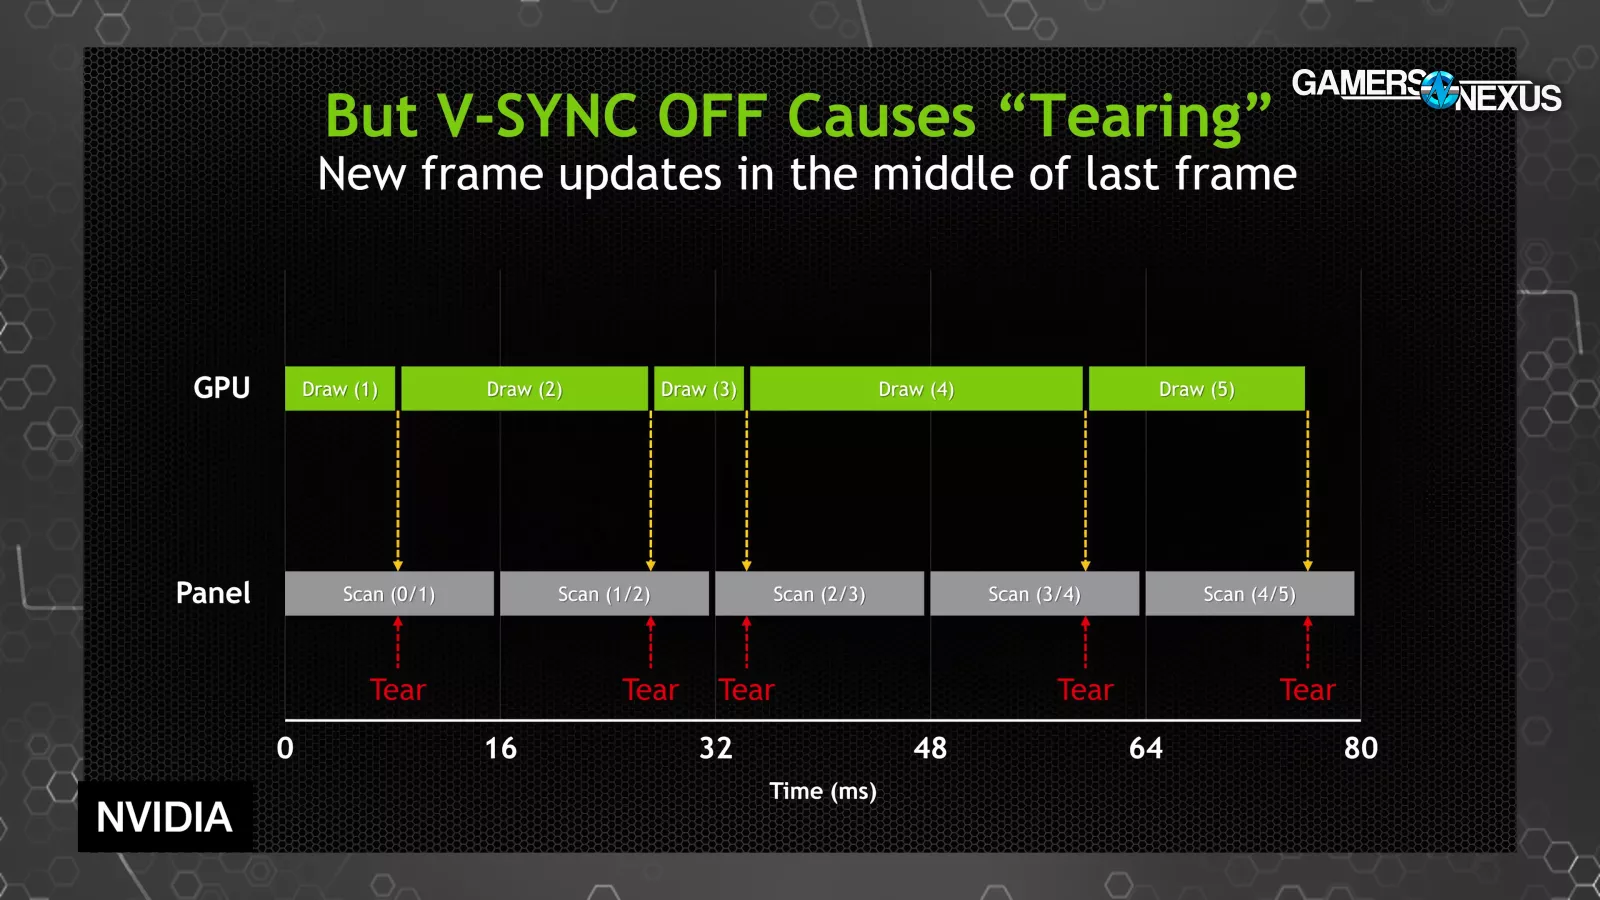
We probably wouldn't use a test scene that resulted in a graph like the GDC 2015 one shown above by NVIDIA, but as it points out, there are scenarios like this where frametime spikes could be artificially masked and not show up in 1% and 0.1% low calculations.
NVIDIA is using percentiles here instead, which we don’t use, but the idea is similar.
Assuming these frametime spikes were accompanied by animation error, calculating animation error would do a much better job of summarizing the problem (in this instance). That said, our approach to lows already helps to control for some of this, but it still requires knowledgeable testers to know when to look into the 0.1% and 1% low results.
Microstutter & Multi-GPU
Animation error has been associated with microstutter in the past, but it's not quite the same thing. If anything, animation error is a way to measure microstutter, but not microstutter itself, depending on the definition. Microstuttering was frequently brought up in the context of multi-GPU rendering, so we'll go back in time and start there by referencing materials from GDC 2015.
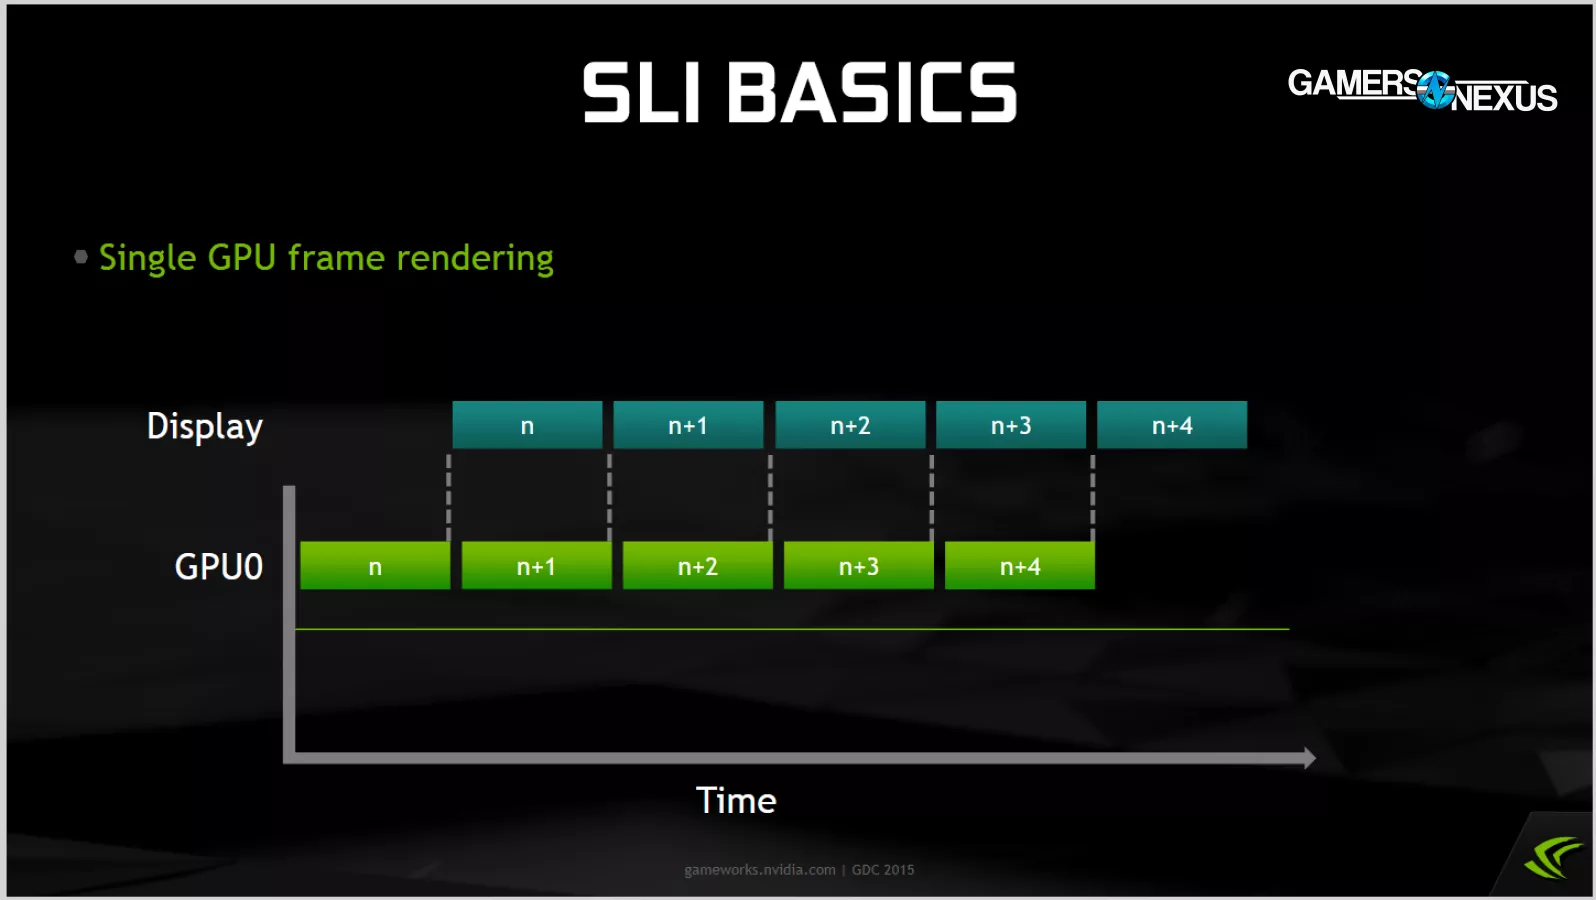
This simplified timeline establishes our foundation: each block is a frame, and frame N gets displayed while the computer works on frame N + 1 behind the scenes. CPU work isn't represented here, but we'll ignore that for now. The frame times are perfectly consistent, which is ideal.
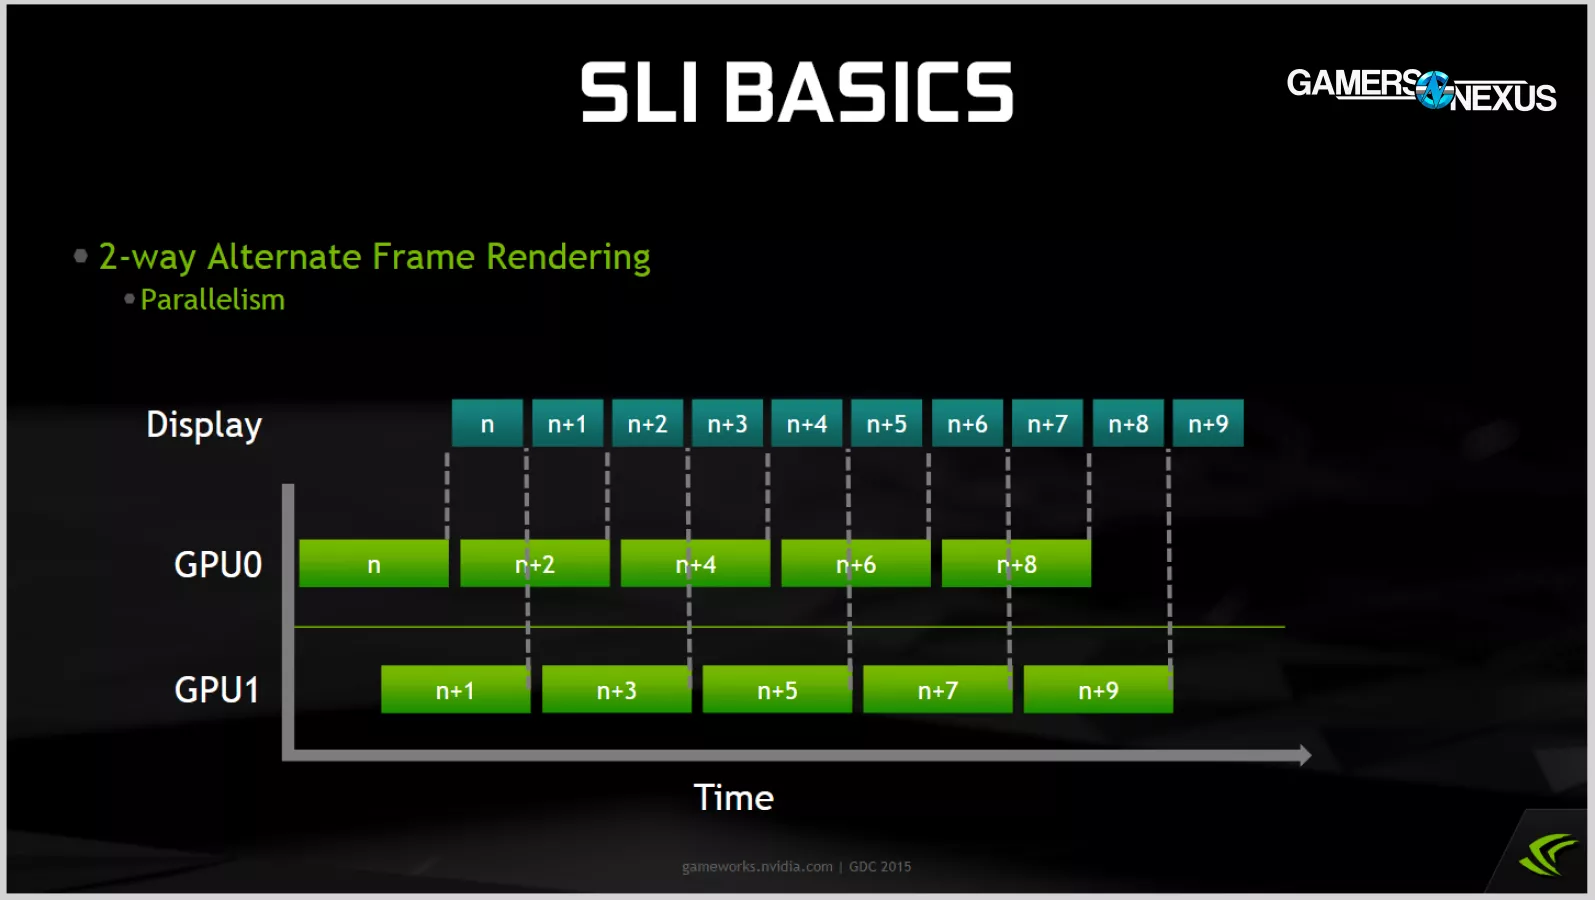
This next slide shows how Alternate Frame Rendering (AFR) multi-GPU operates, or at least operated back when anyone actually supported it. Each of the GPUs takes turns rendering frames, and the output is combined and displayed in order. The blue boxes are still uniform sizes, indicating consistent display times, and they're smaller than the previous diagram, indicating a higher framerate.
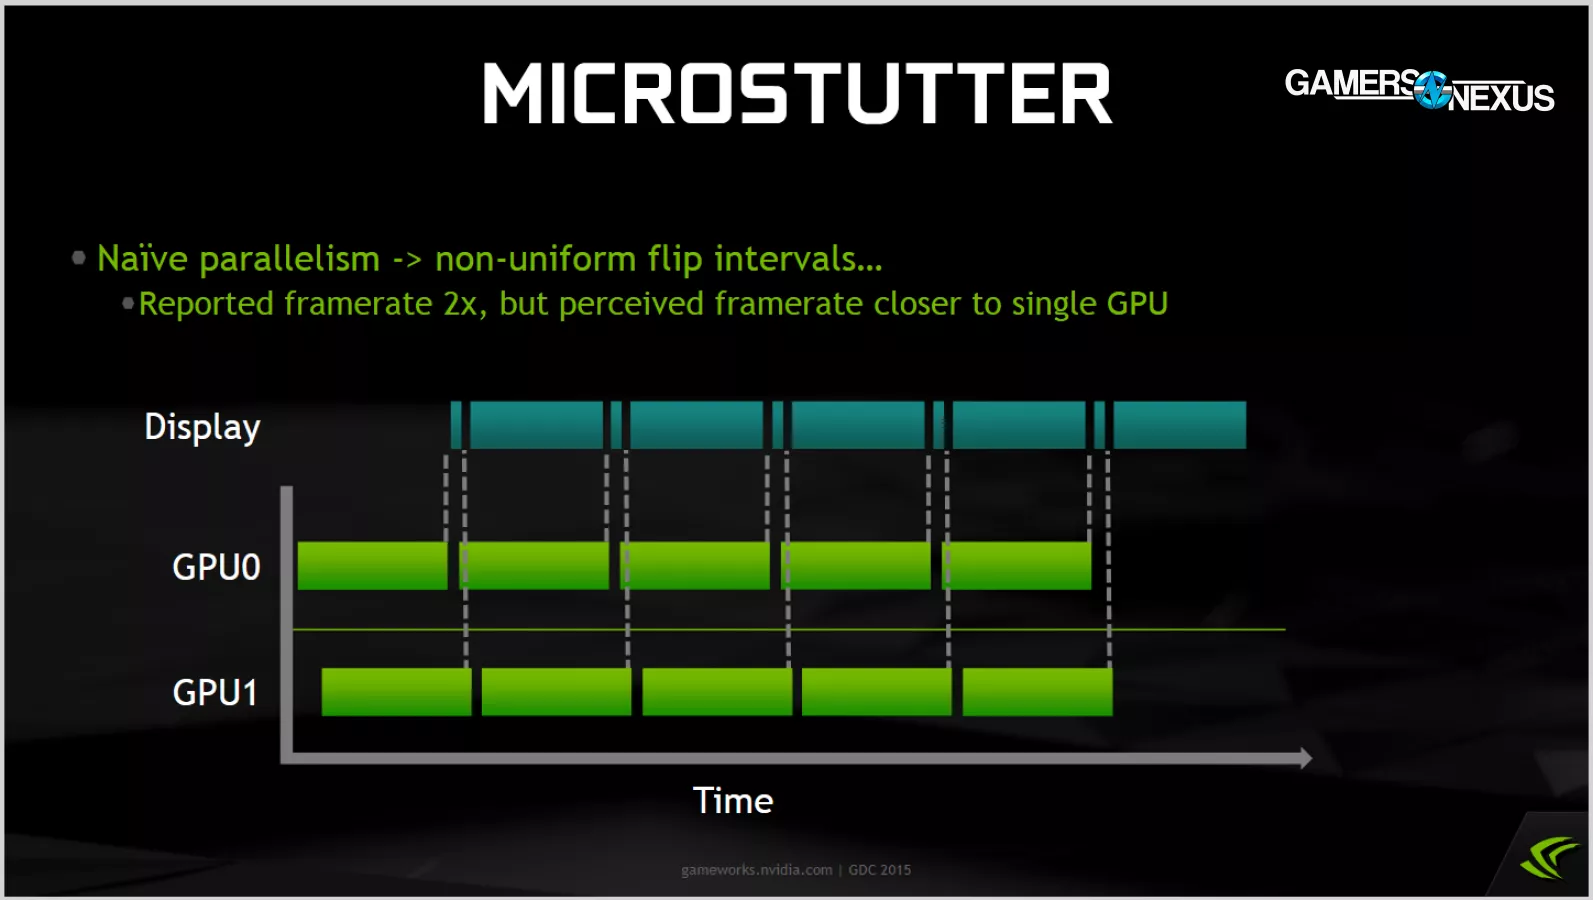
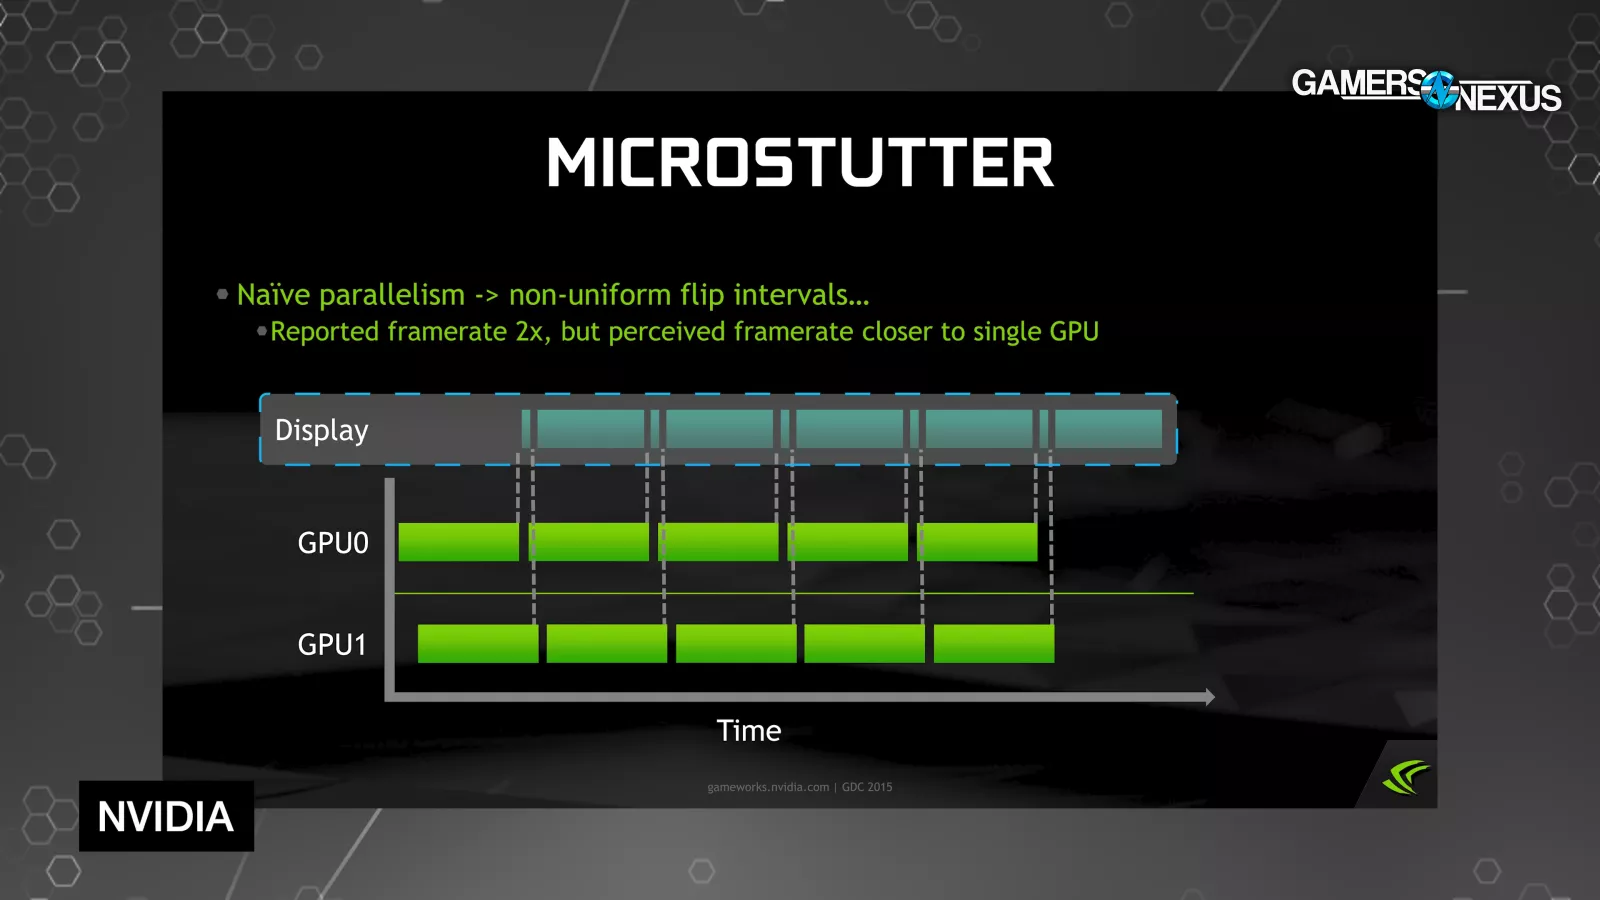
One of the major difficulties with AFR is trying to synchronize GPUs. Here, GPU0 and GPU1 are taking the same amount of time to complete individual frames, but they're poorly synced so that some frames get little display time and are effectively wasted.
These are also known as “runt frames,” where fractions of frames are shown in a way that elevates the average FPS, but creates an awful experience with bad tearing. The average framerate is higher because more frames were technically shown, but the additional frame is useless and the actual experience can look lower in framerate, which is one definition of microstutter.
Again, we can't see the CPU stage of the pipeline here, but we'll assume it's being completely consistent.
In this example, the rhythm of animation matches the rhythm of display, so there is no animation error. The framerate is stuttery, but all the moving stuff in the frames shows up in the right place at the right time. After each short frametime, objects move a little; after each long frametime, objects move a lot.
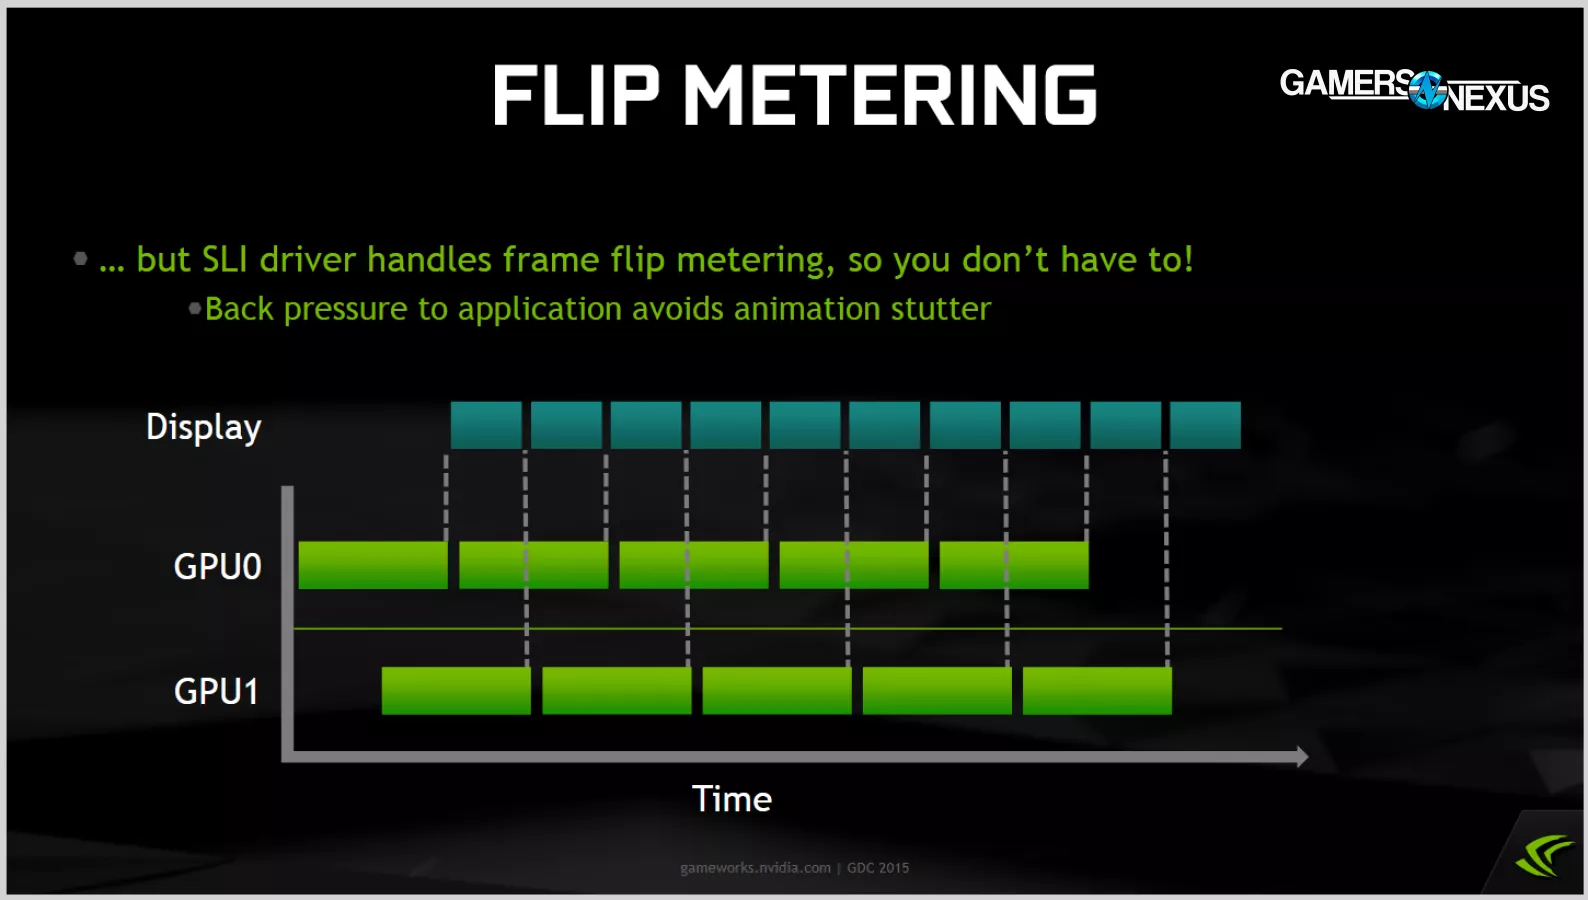
You can avoid that microstutter by forcing the pacing into alignment. Ideally this happens by manipulating delays early in the pipeline (on the CPU), in which case you return to a clean result like this one.
However, if you were to meter those frames out at the END of the pipeline, that would directly contribute to animation error (or "animation stutter," as NVIDIA put it back then). We've created and rendered an edited diagram to show what that would look like. If you just take the "short" frames and hold onto them longer before flipping, then there's a mismatch between the pacing of the frames as they're displayed versus the animations depicted in those frames. That leads to perceived stuttering and rubberbanding.
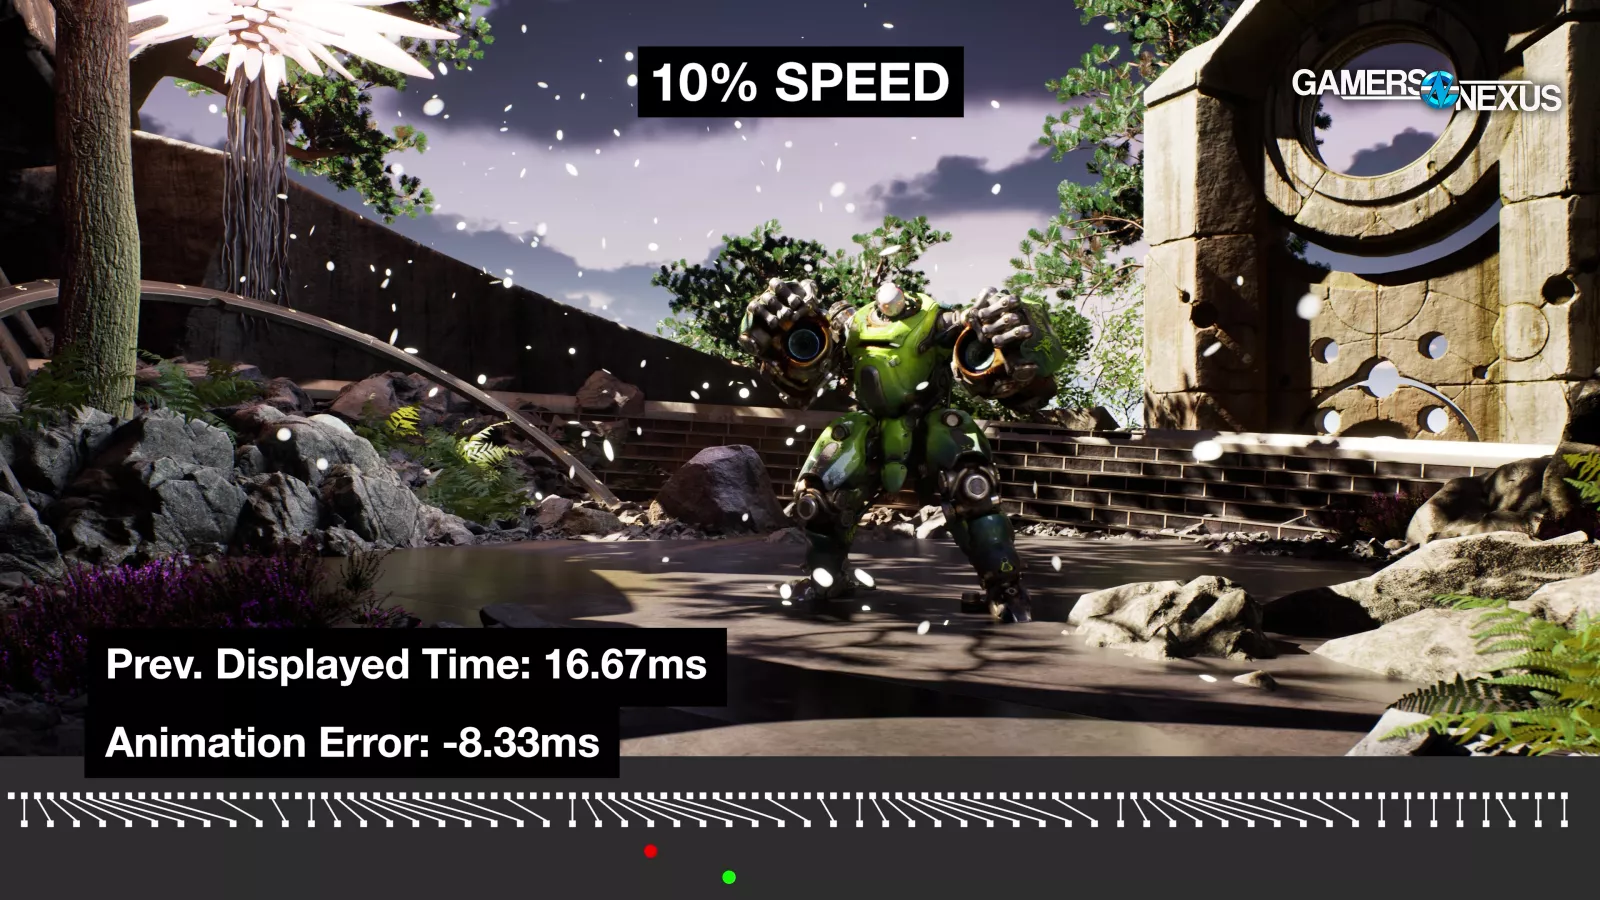
Back to our earlier animation, that’s seen when comparing the red and green indicators below the scene, where the imperfect ball stalls and then gets dragged forward in uneven intervals.
We aren't exploring which method NVIDIA or AMD used to deal with microstutter; that's a subject for another time, and that time was 12 years ago. Today, we're just showing a real world example of a situation where animation error was a risk.
Animated Examples
Andrew on the team made some 3D mockups of simulated animation error. We started by rendering out a scene at 120 frames per second. This could have been any arbitrary number, but picking a high framerate allowed us to downsample and play around with the spare frames.
Here's what that looks like. The top row of squares represents our 120 FPS source video, and we'll pretend that our simulated game has an impossibly low latency of zero, meaning that this row represents in-game reality. The bottom row of squares represents frames that we pulled out of the original sequence to create our 60 FPS video. Because we pulled exactly every other frame, we still have smooth playback with zero frametime spikes and zero animation error. Because we display the frames in sync with their original placement, we have zero latency as well.
Since we're pulling frames every 16.67ms from the source video, our AnimationTimes are always 16.67ms. And since we're also displaying those frames every 16.67ms, our DisplayedTimes are always 16.67ms. Therefore, AnimationError is always zero.
The green circle represents "reality" as determined by our source video, while the red circle represents what we're actually seeing. Again, these match perfectly in this control example.
By taking some of the spare frames from the source video, we can create animation error, but we need to be specific. The diagonal lines mean that we're taking the original frames and displaying them later than "reality," which introduces latency. Latency itself is not animation error. That’s a different problem.
As we play through the big lump of diagonal lines at the start of this clip, the red circle falls behind the green circle, but the animation of the video remains smooth. Animation error is when the red circle jerks around, skipping to catch up with the green circle at an uneven pace. If you watch the video clip when this happens, you can see the interruptions. This is what we mean when we say animation error is a measurement of jitteryness.
Here's an extreme example of our point about latency: we're displaying every frame 41.67ms "late," so the red circle lags behind the green, but the resulting video is identical to the control. AnimationTimes and DisplayedTimes are still perfectly matched 16.67ms intervals every time, so there's zero animation error.
We can do this multiple times during the clip to intensify that feeling of rubber-banding. We're creating a lot of variation in our simulated AnimationTimes here: if we take two back-to-back frames from the 120 FPS source video, that's an 8.33ms AnimationTime. If we pull two frames that were spaced four apart in the original video, that's a 33.3ms AnimationTime. Meanwhile, our DisplayedTimes remain constant, because we're still displaying fresh new frames exactly 16.67ms apart. That's the mismatch in pacing that animation error quantifies.
As Tom told us before, our challenge is to "make people understand that you can take frames and show them with an even cadence on display and still have it look like shit." He has a real way with words. It’s like poetry.
We can also create an inverse example. Think about a flip book. Here we've pulled frames from the source video at even intervals for constant simulated AnimationTimes of 33.33ms, but by displaying those frames at uneven intervals, we still create animation error. This is like drawing a perfect flipbook animation and then failing to flip through the pages at a constant tempo. This is a weird theoretical example, because if we assume this is a case where frametimes equal animation times, PresentMon would report a completely steady 30FPS based on MsBetweenAppStart.
That's not the only way for animation error to manifest, though—in fact, it's pretty unlikely that you'd naturally encounter perfectly consistent DisplayedTimes with inconsistent AnimationTimes, or vice versa. A more realistic scenario is this one, which simulates CPU-based stuttering, like the diagram Intel shared with us.
Here, rather than displaying a unique frame every 16.67ms, we freeze on individual frames. These are DisplayedTime spikes, which usually correlate to FrameTime spikes under the hood.
For each spike, we get two animation errors: after a frozen frame, the next frame is judged to be too late, and the frame after that is judged to be too soon.
This is closer to what we've observed in games, but just like with latency, it's important to remember that the frametime spikes are not the same thing as animation error: you could theoretically keep freezing on frames while maintaining zero animation error.
To help explain, let's cover a real-world example.
Capture Demonstrations
For easier discussion, we're mostly ignoring VSYNC and variable refresh so that the monitor is not a factor in any way.
When we say frames are "displayed," we mean that a flip has been signalled to the operating system, and without VSYNC, that flip can happen even if the monitor is in the middle of a refresh (leading to tearing).
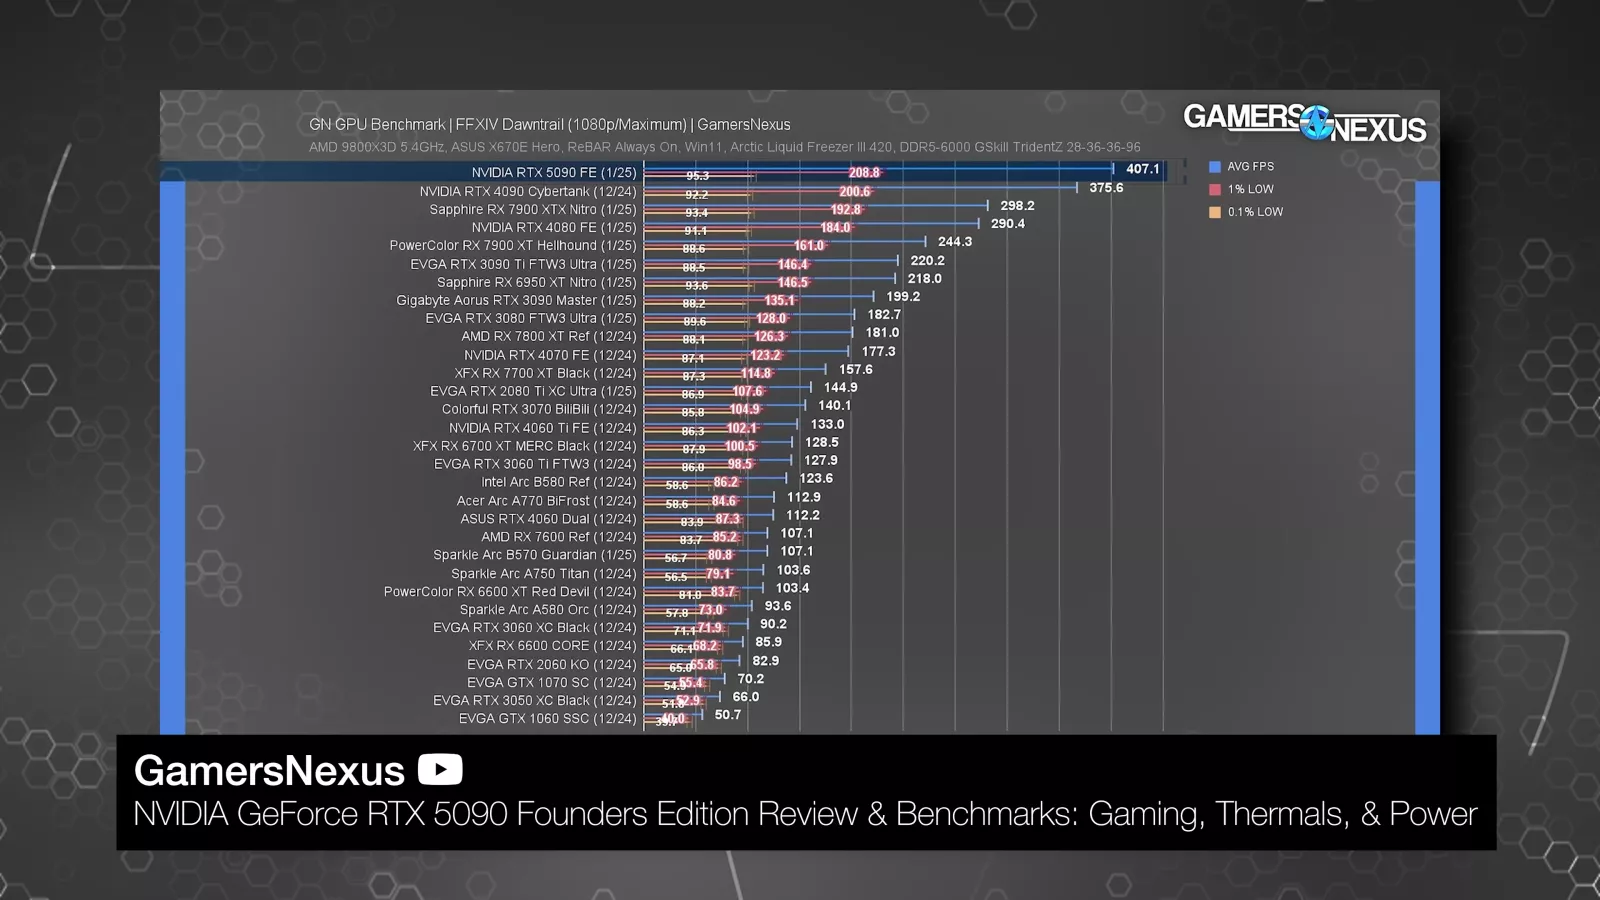
That pushes numbers logged without VSYNC towards the theoretical realm, but no more so than usual: for example, in our launch review, the RTX 5090 averaged a ridiculous 407 FPS in the Dawntrail benchmark at 1080p. That's a comparable performance number, independent of whatever monitor we used, and in that context, that's what we wanted because we want percent scaling between devices.
Separately, higher framerates do correlate with lower latency, so there’s value from that side as well. Today though, we’re also ignoring latency for purposes of focusing discussion.
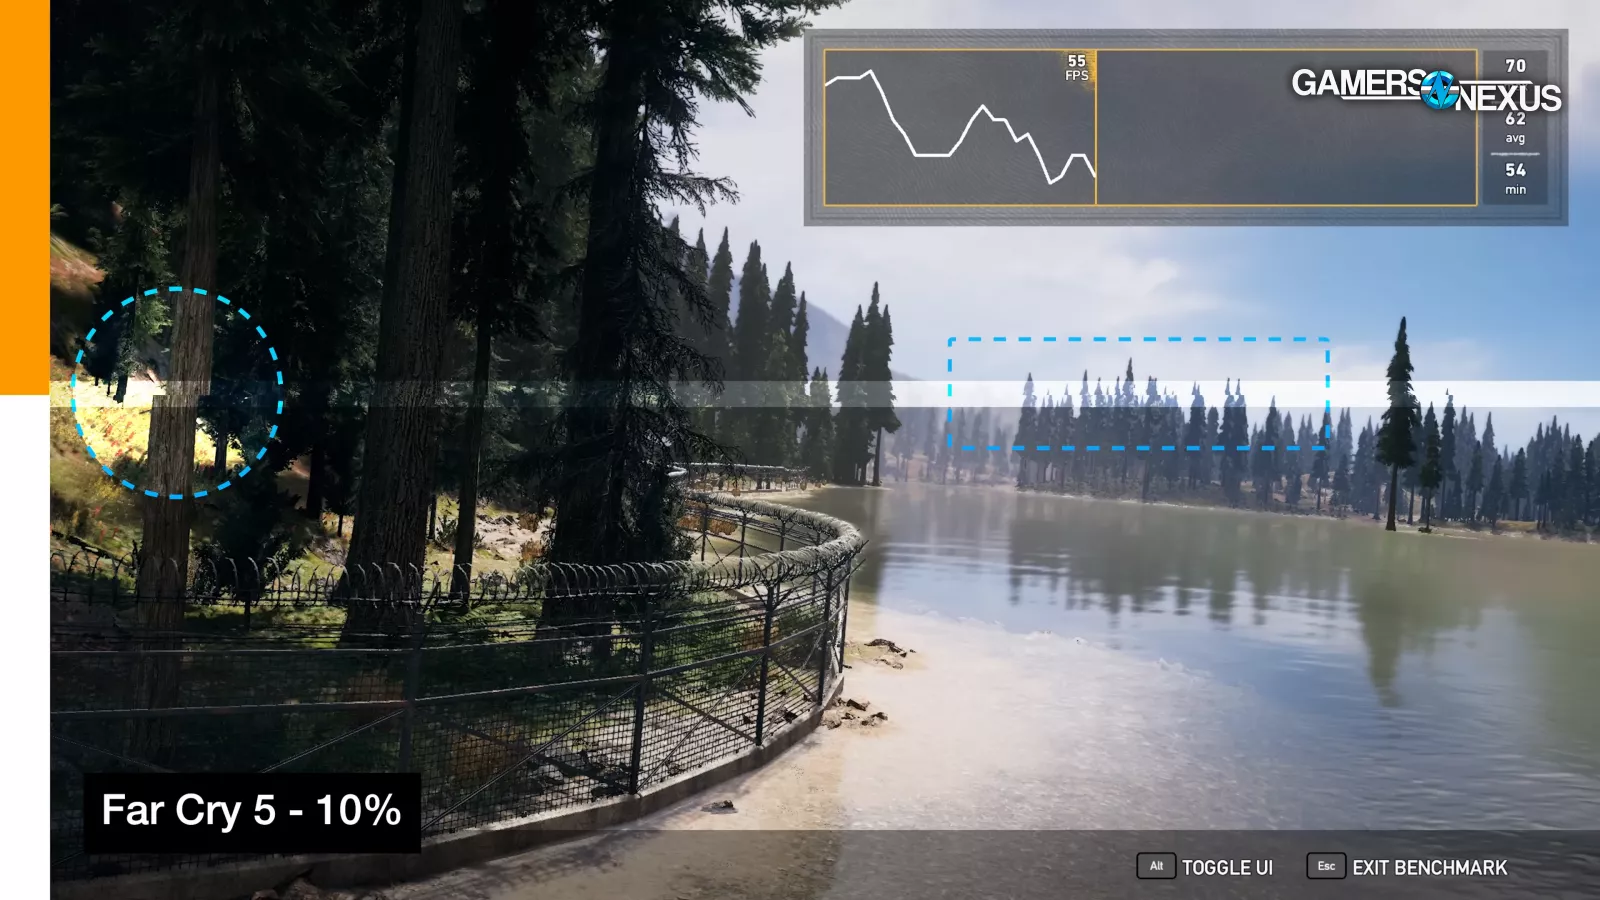
All of that said, the easiest way to actually show animation error in captured footage is with VSYNC to avoid tearing. If you ignore the overall drops in framerate and focus on the movement of objects that should be smoothly traveling across the screen, you'll see them appear to change speed and jump around: that's animation error.
It's most noticeable in fast panning shots with smooth tracking: the camera should be moving at a steady rate even when the framerate drops, but it appears to hitch and rubber-band, especially when played back at half speed. Animation error is separate from frametime spikes, but the two things are frequently associated, and they're both bad.
We want to be careful here, because animation error is uniquely bad when VSYNC is enabled, and this footage isn't representative of the non-VSYNCed test passes that we're about to discuss.
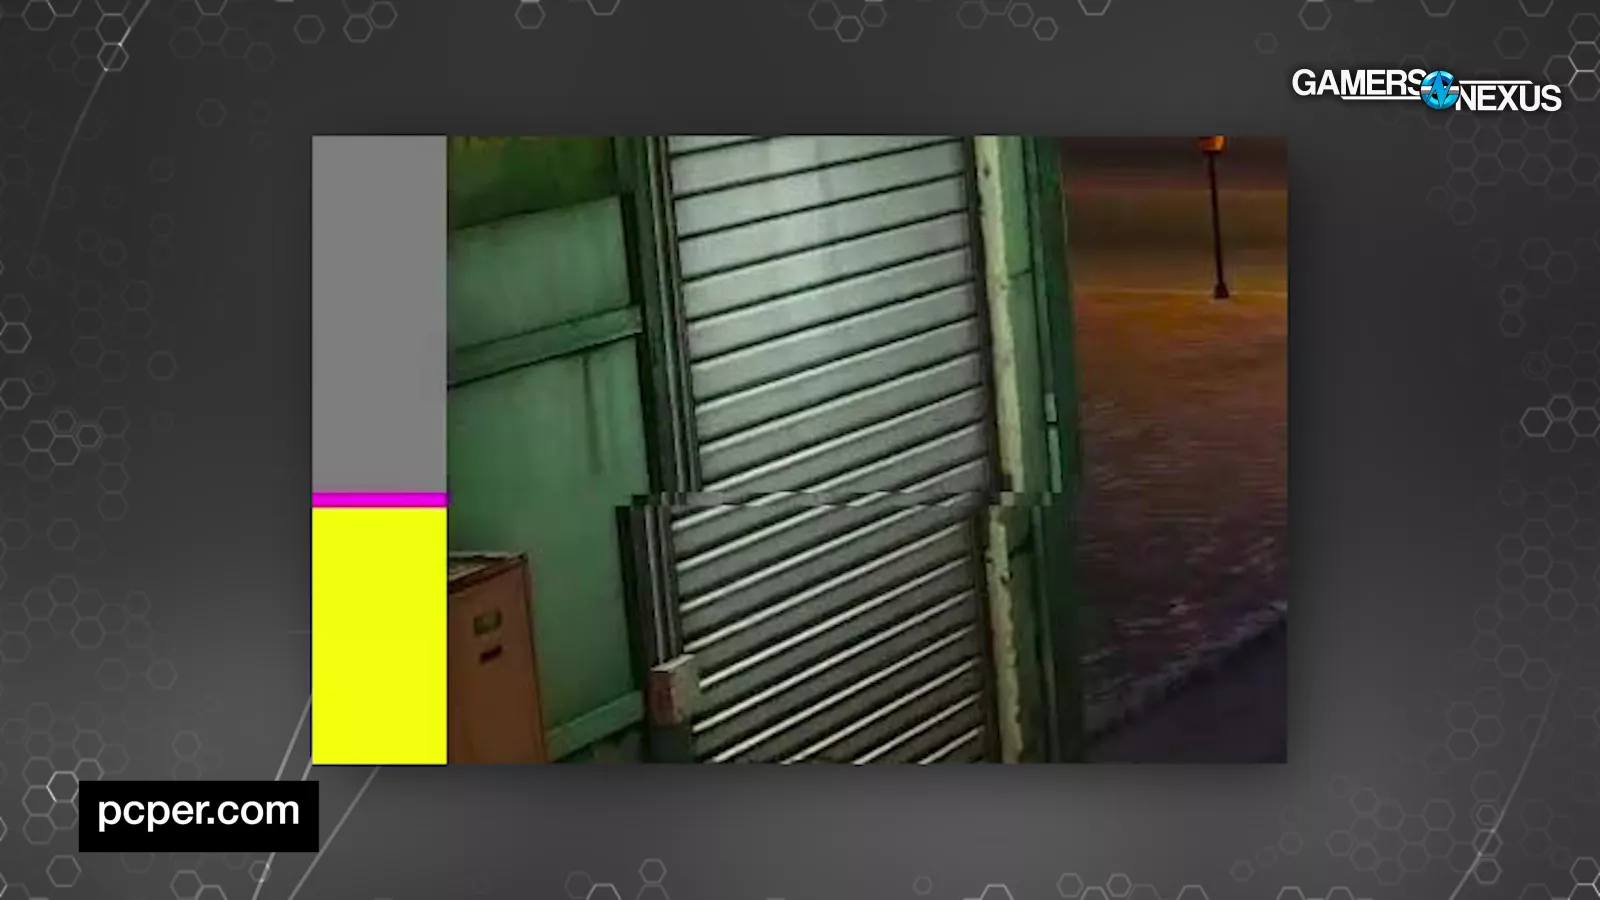
One of the only ways we can represent those test passes in fixed-framerate capture is with an FCAT-style overlay, which adds a visual indicator of where torn frames begin and end. This helps illustrate runt frames as well, and was used in VirtualDub back in the day. That gives us an indicator of each individual frame that we're discussing without adding the complication of VSYNC, but it does also mean that frames may only show up as a tiny sliver of pixels.
If we play back this footage slowly, you can frequently see the pattern of tearing: a new color shows up at the bottom of the bar in one frame of the capture, then it continues from the top of the bar in the next frame of capture. It's kind of a mess, and it's difficult to focus on one sliver of frame at a time, hence using VSYNC for visualization in spite of the downsides. The FCAT functionality would be more useful as part of the PresentMon overlay, which can simultaneously show a live graph of animation error.
Advanced Definitions
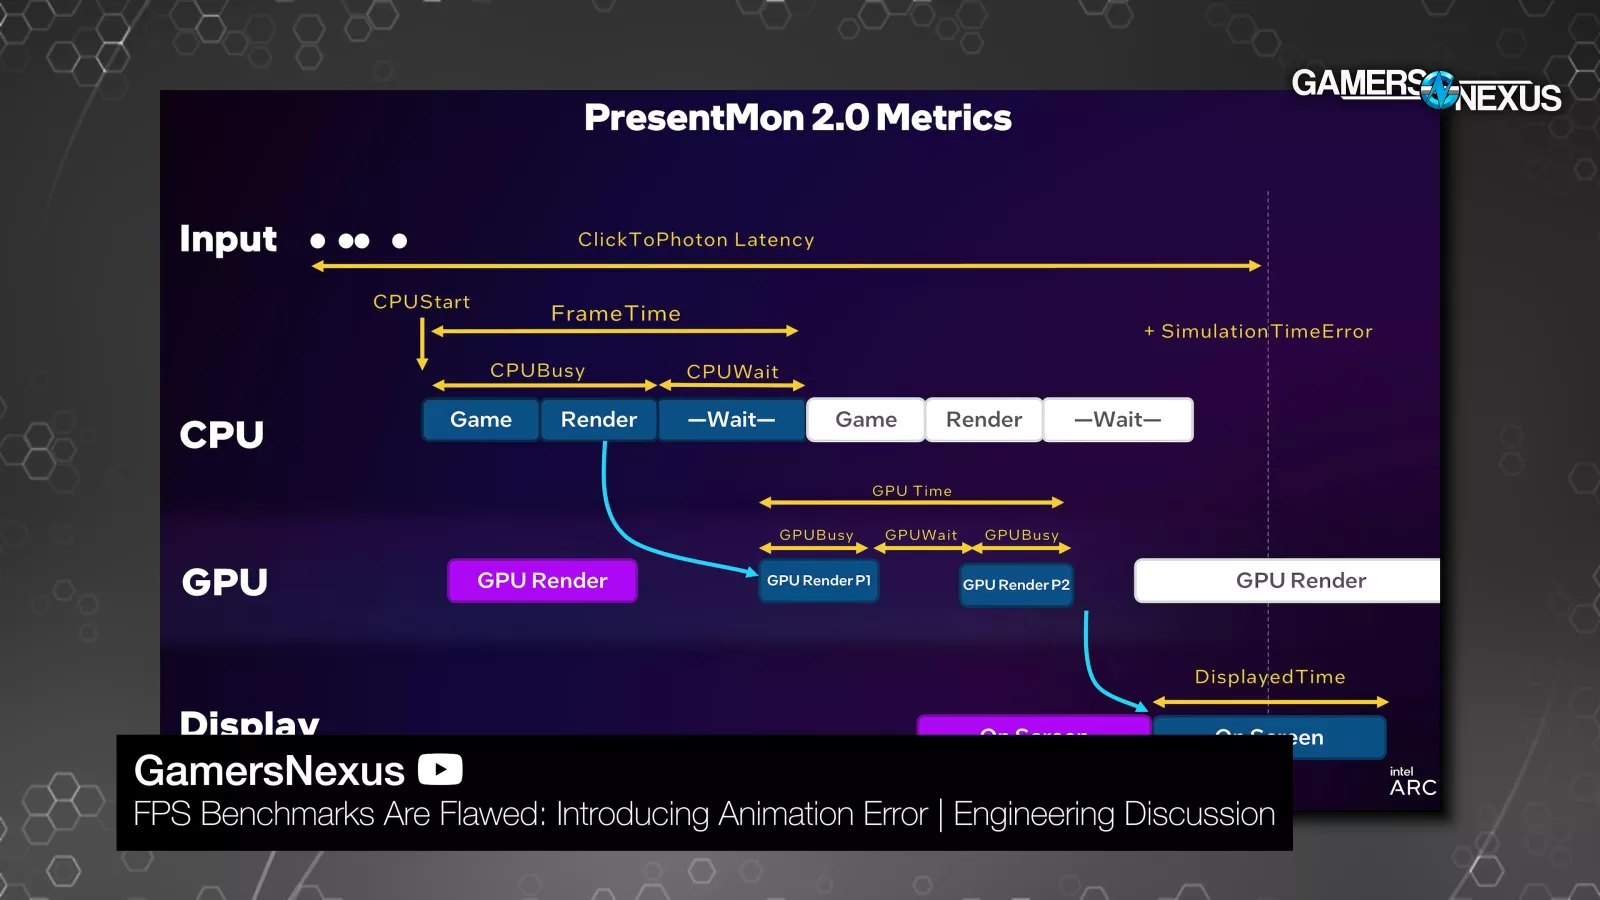
Here are the PresentMon CPU metrics.
PresentMon CPU Metrics:
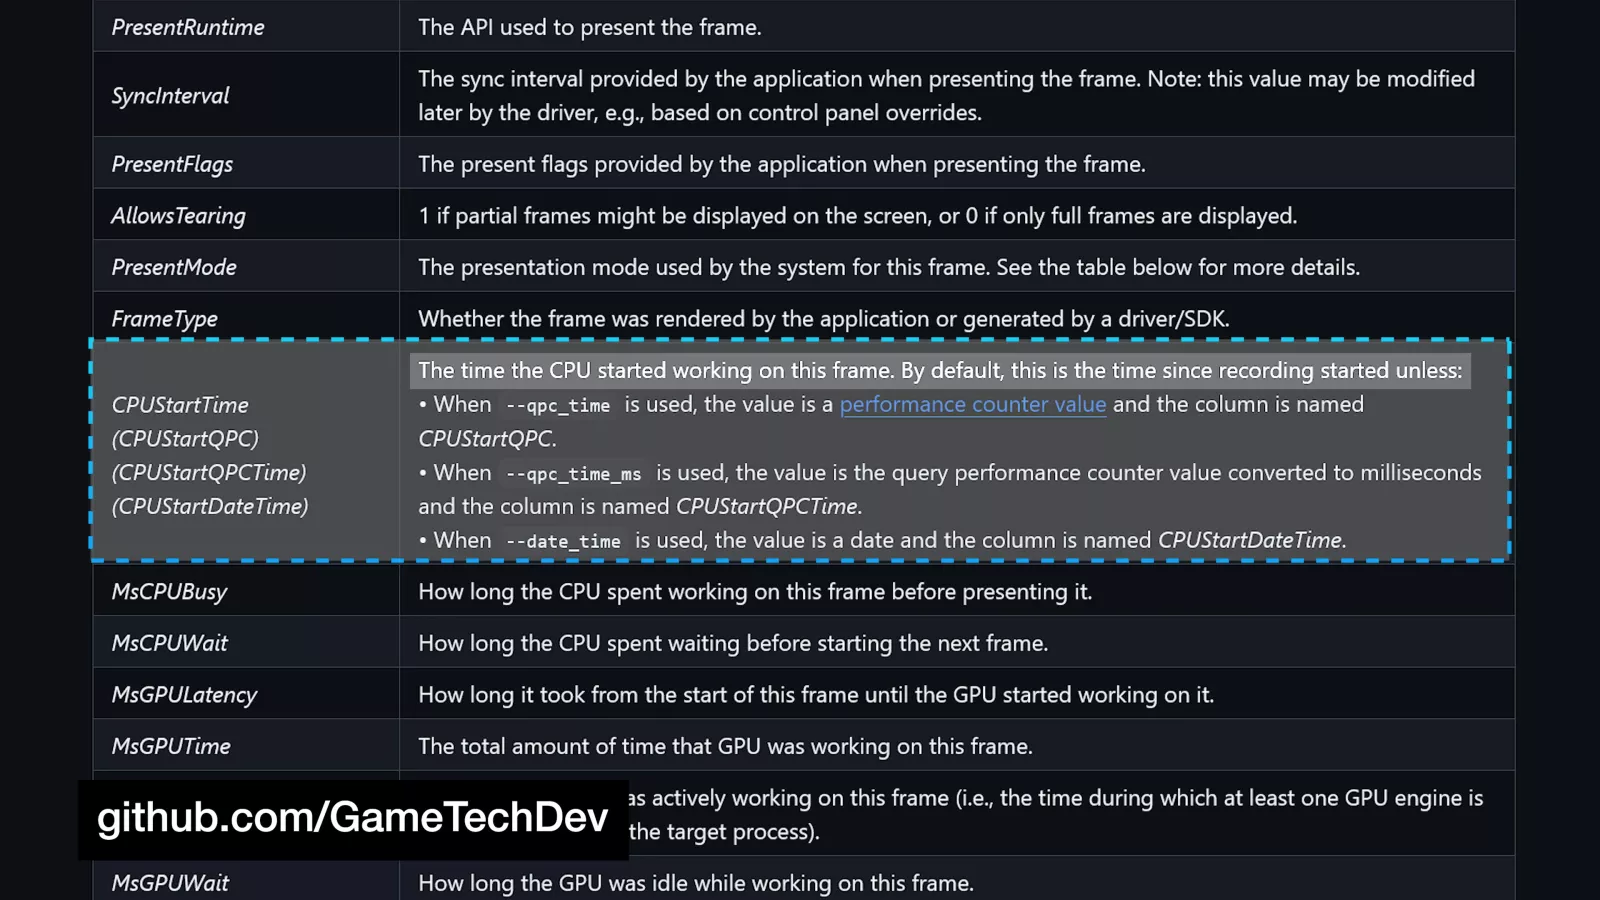
CPUStartTimeInMs: The moment where a new frame is born, expressed as a timestamp (relative to the beginning of the PresentMon session).
AnimationTime: This is PresentMon's best estimate of the frozen moment in game time that's depicted by a frame. As a player, you're always seeing rendered images of a game several milliseconds after the in-game reality that they depict. AnimationTime is the timestamp for that reality.
According to Tom Petersen last year, "Today people are mostly using CPUStart as the AnimationTime, which is a pretty good proxy, and that's what we're going to be doing initially. There are explicit APIs, both from NVIDIA and from us [Intel] and others that are allowing game engines or games to tell you that AnimationTime. And so as that becomes more available, we'll be building that into PresentMon."
Logically, AnimationTime should be the same as the moment the frame was born (CPUStartTimeInMs), but games can pull tricks to smooth animations so that AnimationTime for a frame doesn't line up with wall-clock time. Under normal circumstances it should be close enough, though.
As an example of an exception, PresentMon can monitor SimStart events when using Intel XeLL (and soon NVIDIA Reflex) and base AnimationTime on that instead. That's valuable because Reflex and XeLL clear the render queue and keep the CPU sitting around waiting for input until the last possible second, so there's a higher potential for differences between CPUStart and the true animation time.
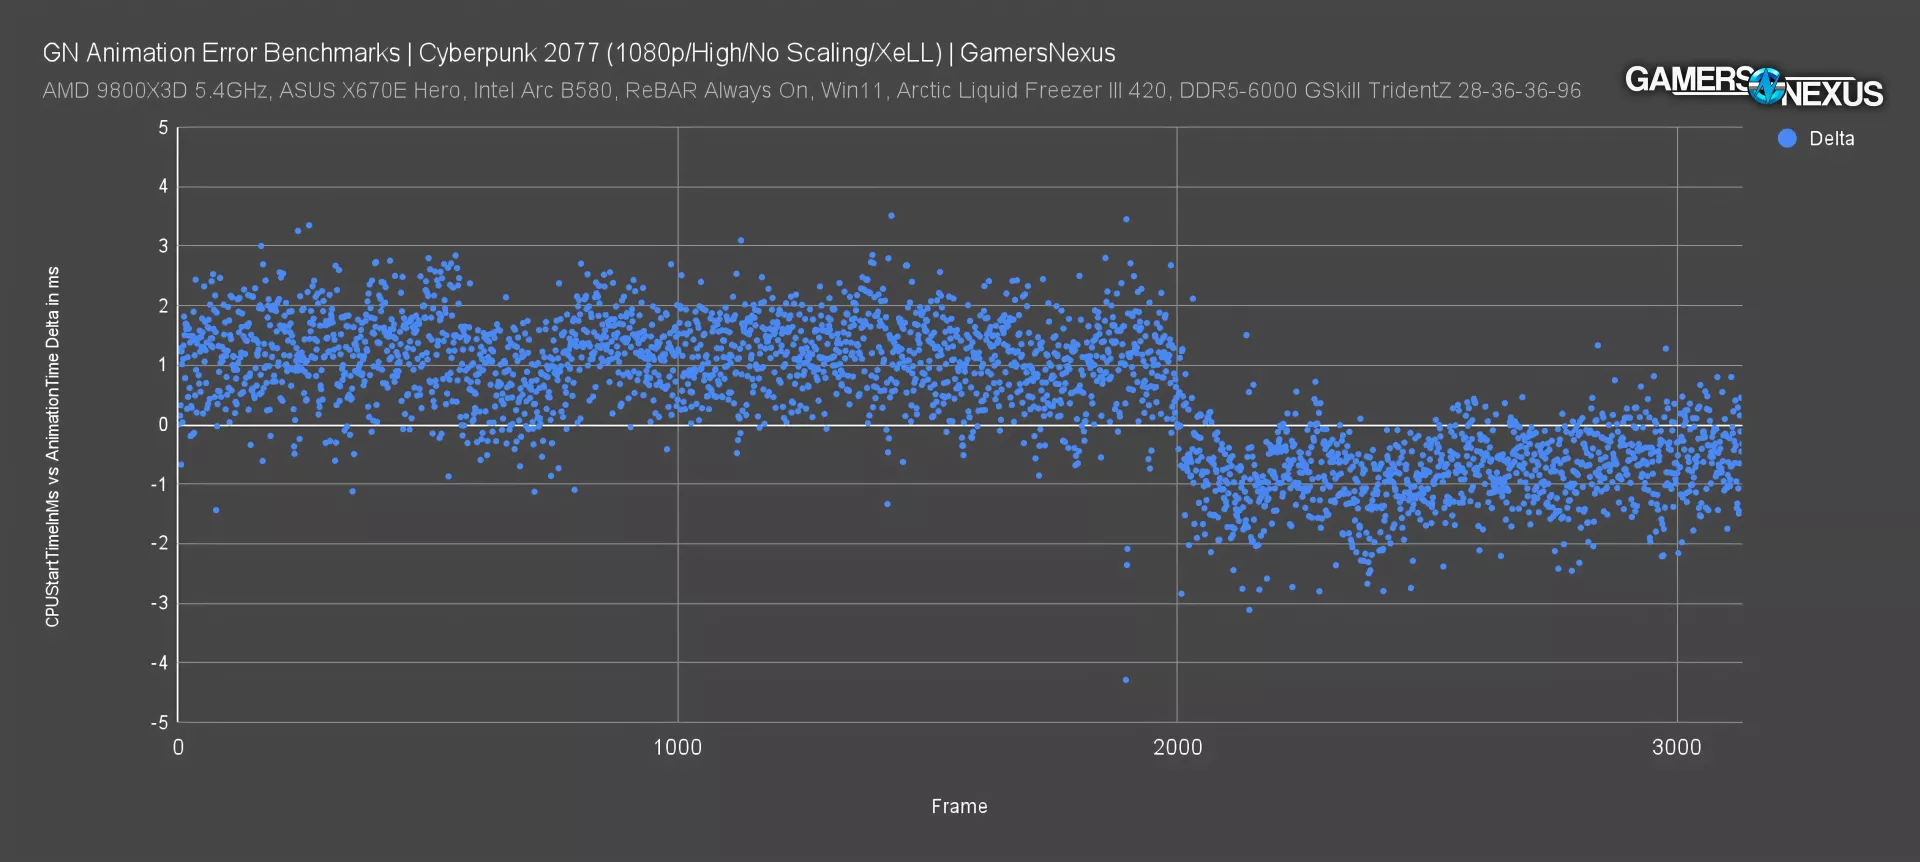
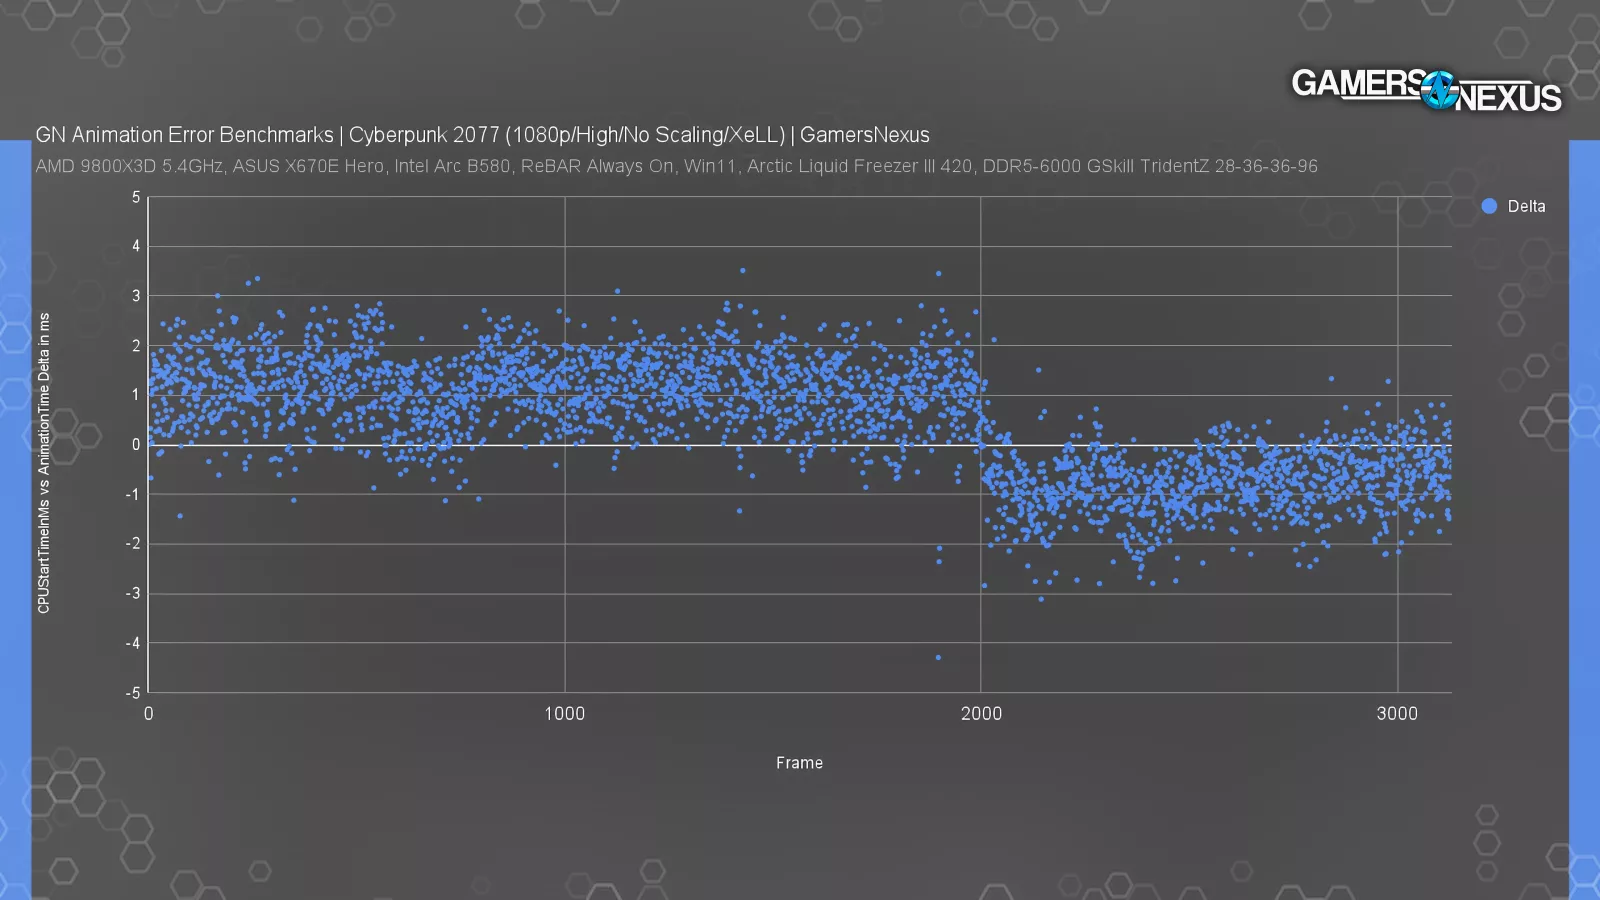
Here we have a PresentMon capture of Cyberpunk 2077. The X-axis shows individual, logged frames, and the Y-axis is the delta between CPUStartTimeInMs and AnimationTime for each frame. Normally, this would result in a perfectly flat line at zero, but since we have XeLL enabled, AnimationTime is based on SimStart instead. With XeLL there's a significant delta between the two values on nearly every frame, which shows that AnimationError would be incorrect if it were based on CPUStartTimeInMs when low-latency modes like XeLL, Reflex, and Anti-Lag 2 are enabled. AMD's Anti-Lag 2 doesn't generate SimStart events that PresentMon can grab, so (for now) we won't be able to accurately score AnimationError with that feature enabled.
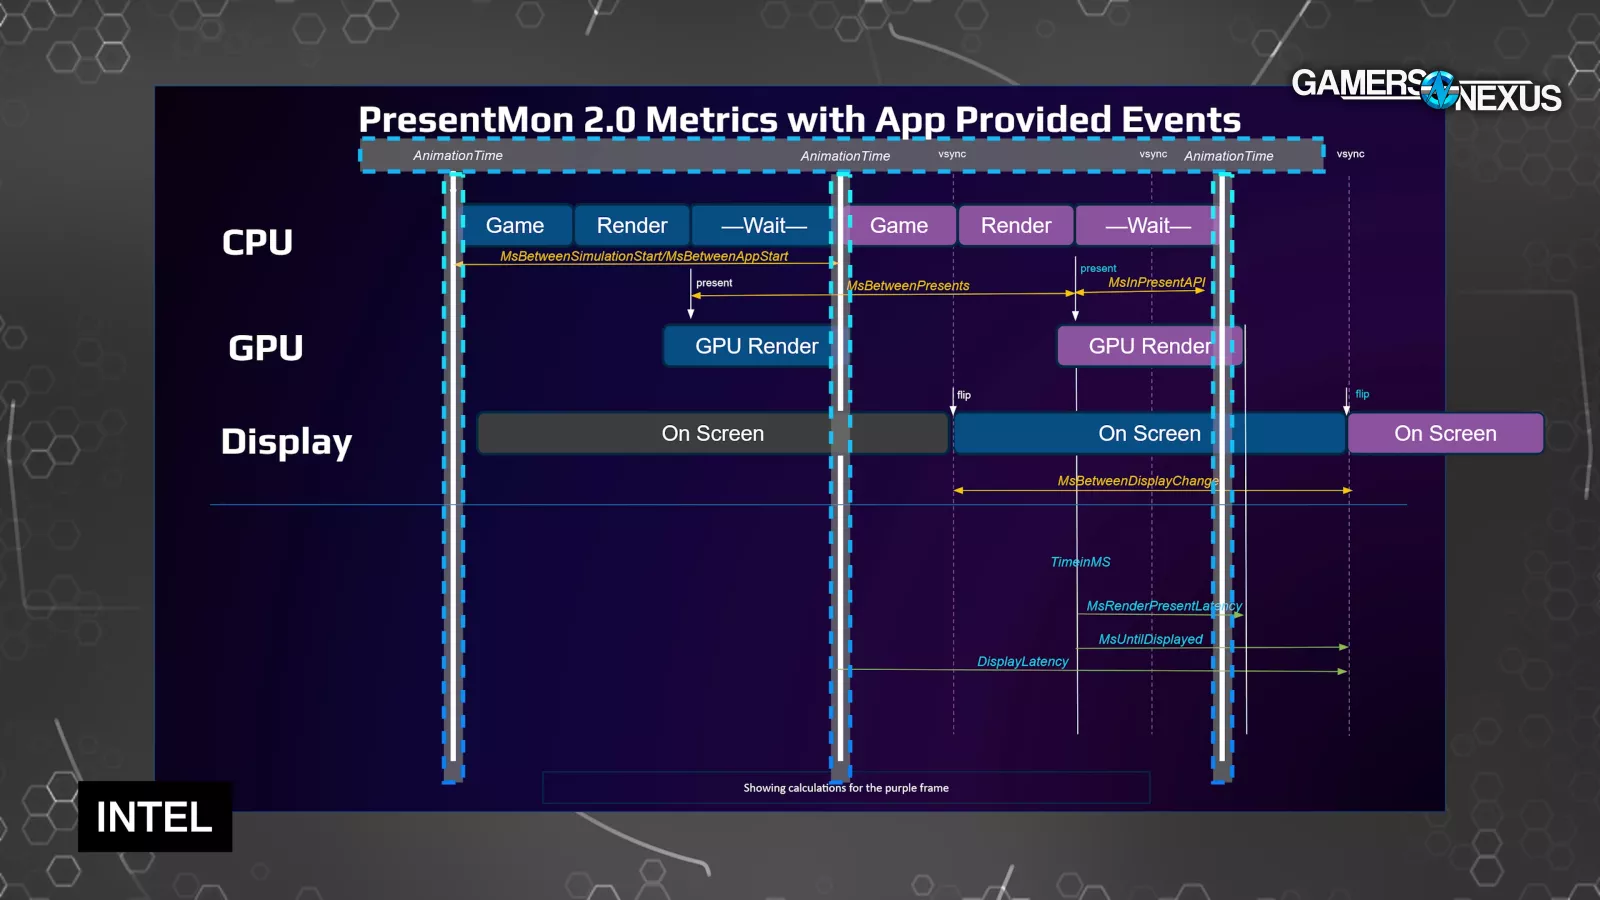
MsCPUBusy: This period begins at CPUStartTimeInMS and includes steps that Intel labels as Game and Render. "Game" is the time spent handling game logic and calculations for the frame, and "Render" is the time spent converting the results into API calls (DirectX, Vulkan, etc.).
The end of these CPU-specific tasks is marked by the Present() call, which signals to the GPU that it has everything it needs for rendering. Future versions of PresentMon may break this down further because CPU work is complex.
TimeInMs: This is the timestamp of the Present() call we just mentioned. It's important to remember that this call doesn't mark the beginning of the GPU rendering step, because the GPU can get a head start before the CPU is done generating API calls.
Usually the end of the Present() call is the CPUStartTimeInMS of the next frame.
MsBetweenPresents: The delta between this frame's Present() call (TimeInMs) and the previous frame's. In the old days, time between Present() calls was used as a (fairly good) approximation for frametimes, but it's technically a different thing. For that reason, MsBetweenPresents is unusable for per-frame calculations like animation error.
MsInPresentAPI: This is the same as MsCPUWait. This is the period between the Present() call and the moment when the CPU begins working on a new frame, meaning that there's nothing blocking further CPU work.
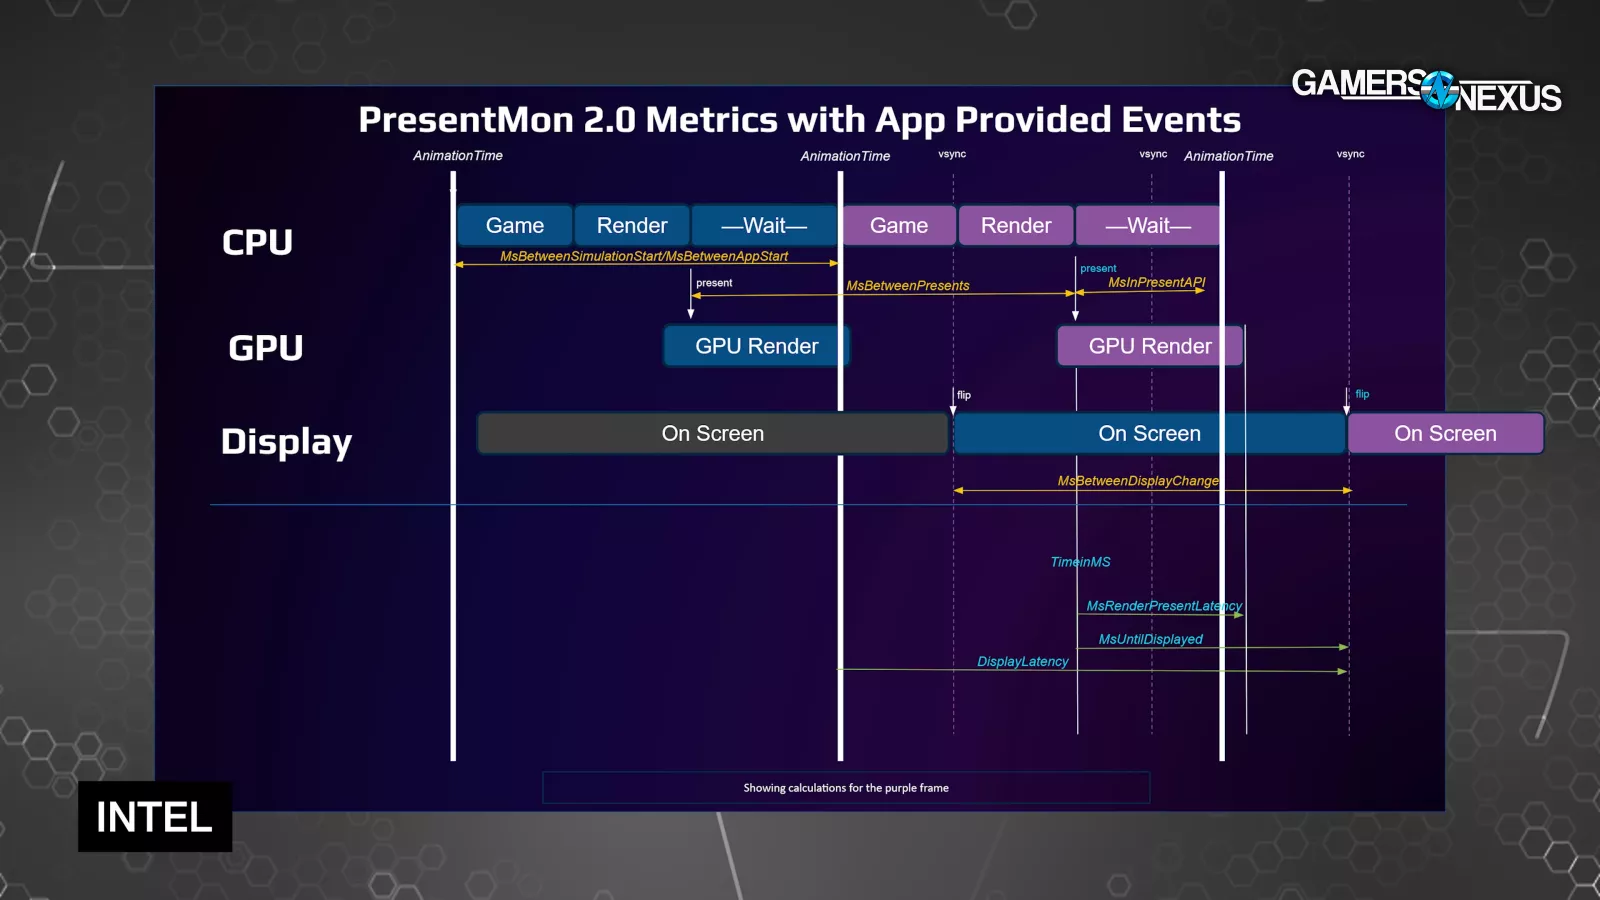
MsBetweenAppStart: PresentMon's best representation of the literal time taken to create an individual frame start-to-finish (an improvement over MsBetweenPresents). It's the delta between the CPU starting work on one frame and the next, so the difference between CPUStartTimeInMs for the current frame and CPUStartTimeInMs for the next frame (or MsCPUBusy plus MsCPUWait).
MsBetweenSimulationStart: This column would depend on SimStart events from Reflex or XeLL. In the current version of PresentMon, MsBetweenSimulationStart is "disabled until underlying event support is enabled."
PresentMon GPU Metrics: We don't need these numbers in order to calculate AnimationError, but we'll go over them briefly. They include:
MsGPUTime: The total GPU render period, comprising GPUBusy and GPUWait periods. This was formerly called msGPUActive.
MsGPUBusy: The portion of the render period "during which at least one GPU engine is executing work from the target process."
MsGPUWait: The portion of the GPU render period where the GPU was idle, potentially due to some codependency on CPU resources.
PresentMon Display Metrics:
MsUntilDisplayed: The time between the Present() call for the frame (TimeInMs) and the time at which the frame is displayed. You can calculate the timestamp at which the frame is displayed by adding these numbers, but it isn't logged directly. "Displayed" here means that a flip (pointing to a new frame buffer) is signalled to the operating system. This is different from new pixels literally showing up on the physical monitor, although the timing should be very close.
MsBetweenDisplayChange: How long the previous frame was displayed before the current frame started to be displayed. There's an argument to be made that this reflects the user experience more directly than MsBetweenAppStart, but MsBetweenAppStart is directly tied to performance, so that metric is still better for testing hardware. However, since display happens at the end of the pipeline, MsBetweenDisplayChange is the only way to include post-processing stuff like generated frames and RTX 5000 frame metering in results (if you want that).
Combined Metrics:
MsGPULatency: The period between the absolute start of work on the frame (CPUStartTimeInMs) and the point at which the GPU started working on it. The start of the GPU render period can be inferred from this.
MsRenderPresentLatency: This is the period from the Present() call at the end of CPU rendering to the end of GPU rendering. This is equal to MsUntilDisplayed unless VSYNC is enabled.
MsAnimationError: Here's how Intel represents the animation error formula for frame N:
(AnimationTimeN – AnimationTimeN-1) – MsBetweenDisplayChangeN
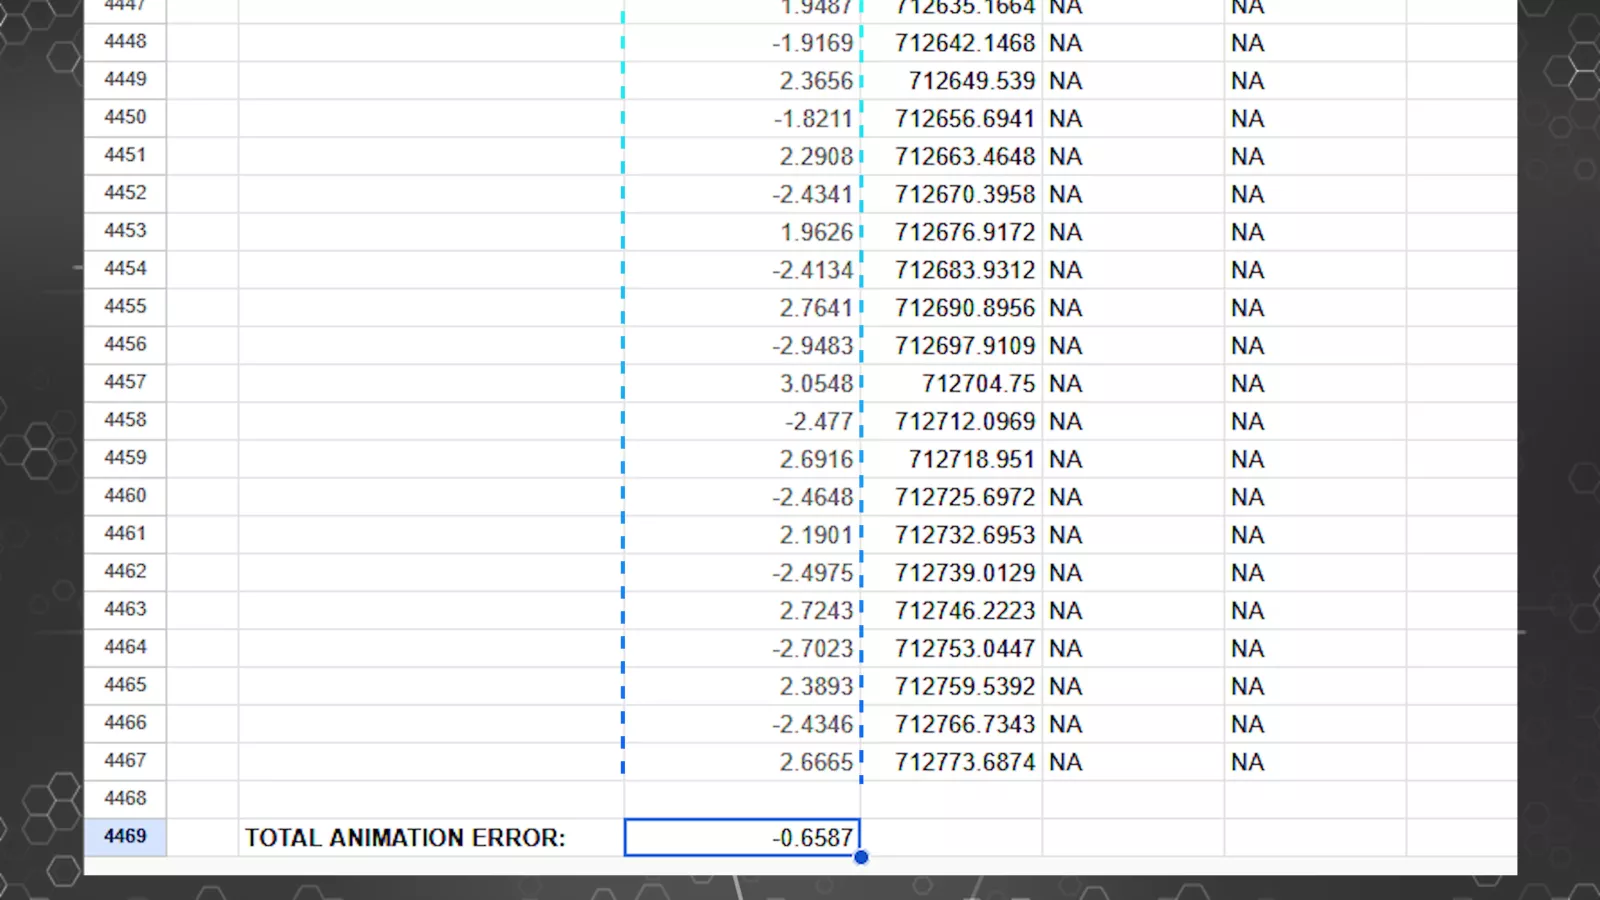
Again, the result of the formula can be positive or negative, but further away from zero is always worse. Adding together all the positive and negative animation errors for a logging period will typically cancel out, so to get a useful total we need to take absolute values.
In the words of Tom Petersen, "The animation step is basically equal to the frametime, mostly. There's some times where it's a little different. But what you need that for is to be correlated with the DisplayedTime step. Because if the DisplayedTime step is different from the animation time step, you'll get a simulation time error, which is measuring stutter directly for the first time."
We've established that AnimationTime is the in-game point in time that a given frame depicts. The delta between animation times for consecutive frames is the amount of in-game time that has passed between them.
We've also established that MsBetweenDisplayChange is the time that a frame is displayed before the next one shows up.
If a long time passes between taking snapshots of the game state, a long time should pass between displaying the snapshots. Even if the AnimationTimes are spiky and uneven, the DisplayedTimes should be matched exactly, or else you get AnimationError.
Conclusion

This doesn’t replace current testing or run instead of it. It’s another tool -- similar to frametime charts -- to help better understand what’s happening in a game. There’s also a lot of theoretical situations here, so it isn’t always practical.
1% and 0.1% lows as bars on a chart took on a life of their own over the last decade. They are still the fastest “glanceability,” and we’re glad we introduced them to our charts now 11 years ago, and we’re going to continue to use them. But it’s time to try and find new metrics, and we hope animation error can supplement the 1% and 0.1% average bar representations of frametime pacing as another means to determine why a game just feels bad sometimes.
But we don't want to oversell what this number actually means. In Tom Petersen’s words: this is a "how jittery am I" metric. Our work here on and off over the past couple years, and more seriously over the past month, has been trying to prove the concept and find a way to put it on a chart that makes sense to anybody.
We devoted a lot of time to explaining how and why it's different from the numbers that we already measure, but in practice and in most cases, we expect it to complement those numbers, not contradict them.
That also means we aren't necessarily expecting any huge upsets versus what we've already concluded in existing reviews.
That said, this is a valuable new tool that can do several other things for us: it can show us when we need to make a frametime plot more easily, it can show us when stuttering happens independently from frametime spikes (although that may be unlikely), it can (sort of) normalize for frametimes in a way that makes comparisons between different hardware easier, and it can deal with up-and-down frametime trends across test passes effectively.
Most importantly, animation error forces us to think about why we measure the things we do. We're now closer to discussing why stuttering feels bad, not just the fact that it exists.
We're still experimenting with ways to make it useful.
If you want to try it out for yourself, PresentMon is free and open-source, and it now has a GUI version available as well. If you’re a reviewer and you find this useful in developing your own methods, we’d appreciate you pointing back here.
We’ve been using PresentMon for years, and actually, most people who’ve tested game performance have -- they just often don’t know it.
PresentMon is wrapped by half a dozen other tools that reskin it or use it in some capacity and it’s an open source project with contributions from around the hardware community.
We use the command line version, but there’s also a user interface tool that you can see in our video where we introduced Jay to it previously. They sometimes have different features.
Because of that, a quick security warning first: do not visit PresentMon dot com or download anything from that site. PresentMon is hosted on GitHub and Intel.com and is an open source utility. Usually when someone pretends PresentMon is their own project and reskins it with an interface, they at least come up with a new name. For security purposes, we’d advise only downloading PresentMon itself from GitHub or the Intel site.
Testing animation error like this is exciting because we can finally directly score stuttering instead of simply deducing it. Big picture, this is similar to when PresentMon moved away from MsBetweenPresents: the numbers and conclusions may not change much, but the measurements are closer to what we're really talking about.
This isn’t the endgame of benchmarking. Hopefully there won’t be one, because that’d be boring. There’s a lot more to learn and this is exploratory and just us putting research out to the internet to experiment with. It’s also up to the vendors to play ball with open source tools like PresentMon. Experiment with the new ideas and point back to us if you find our work helpful as a foundation, and credit to Tom Petersen for opening up the tools to measure these metrics.