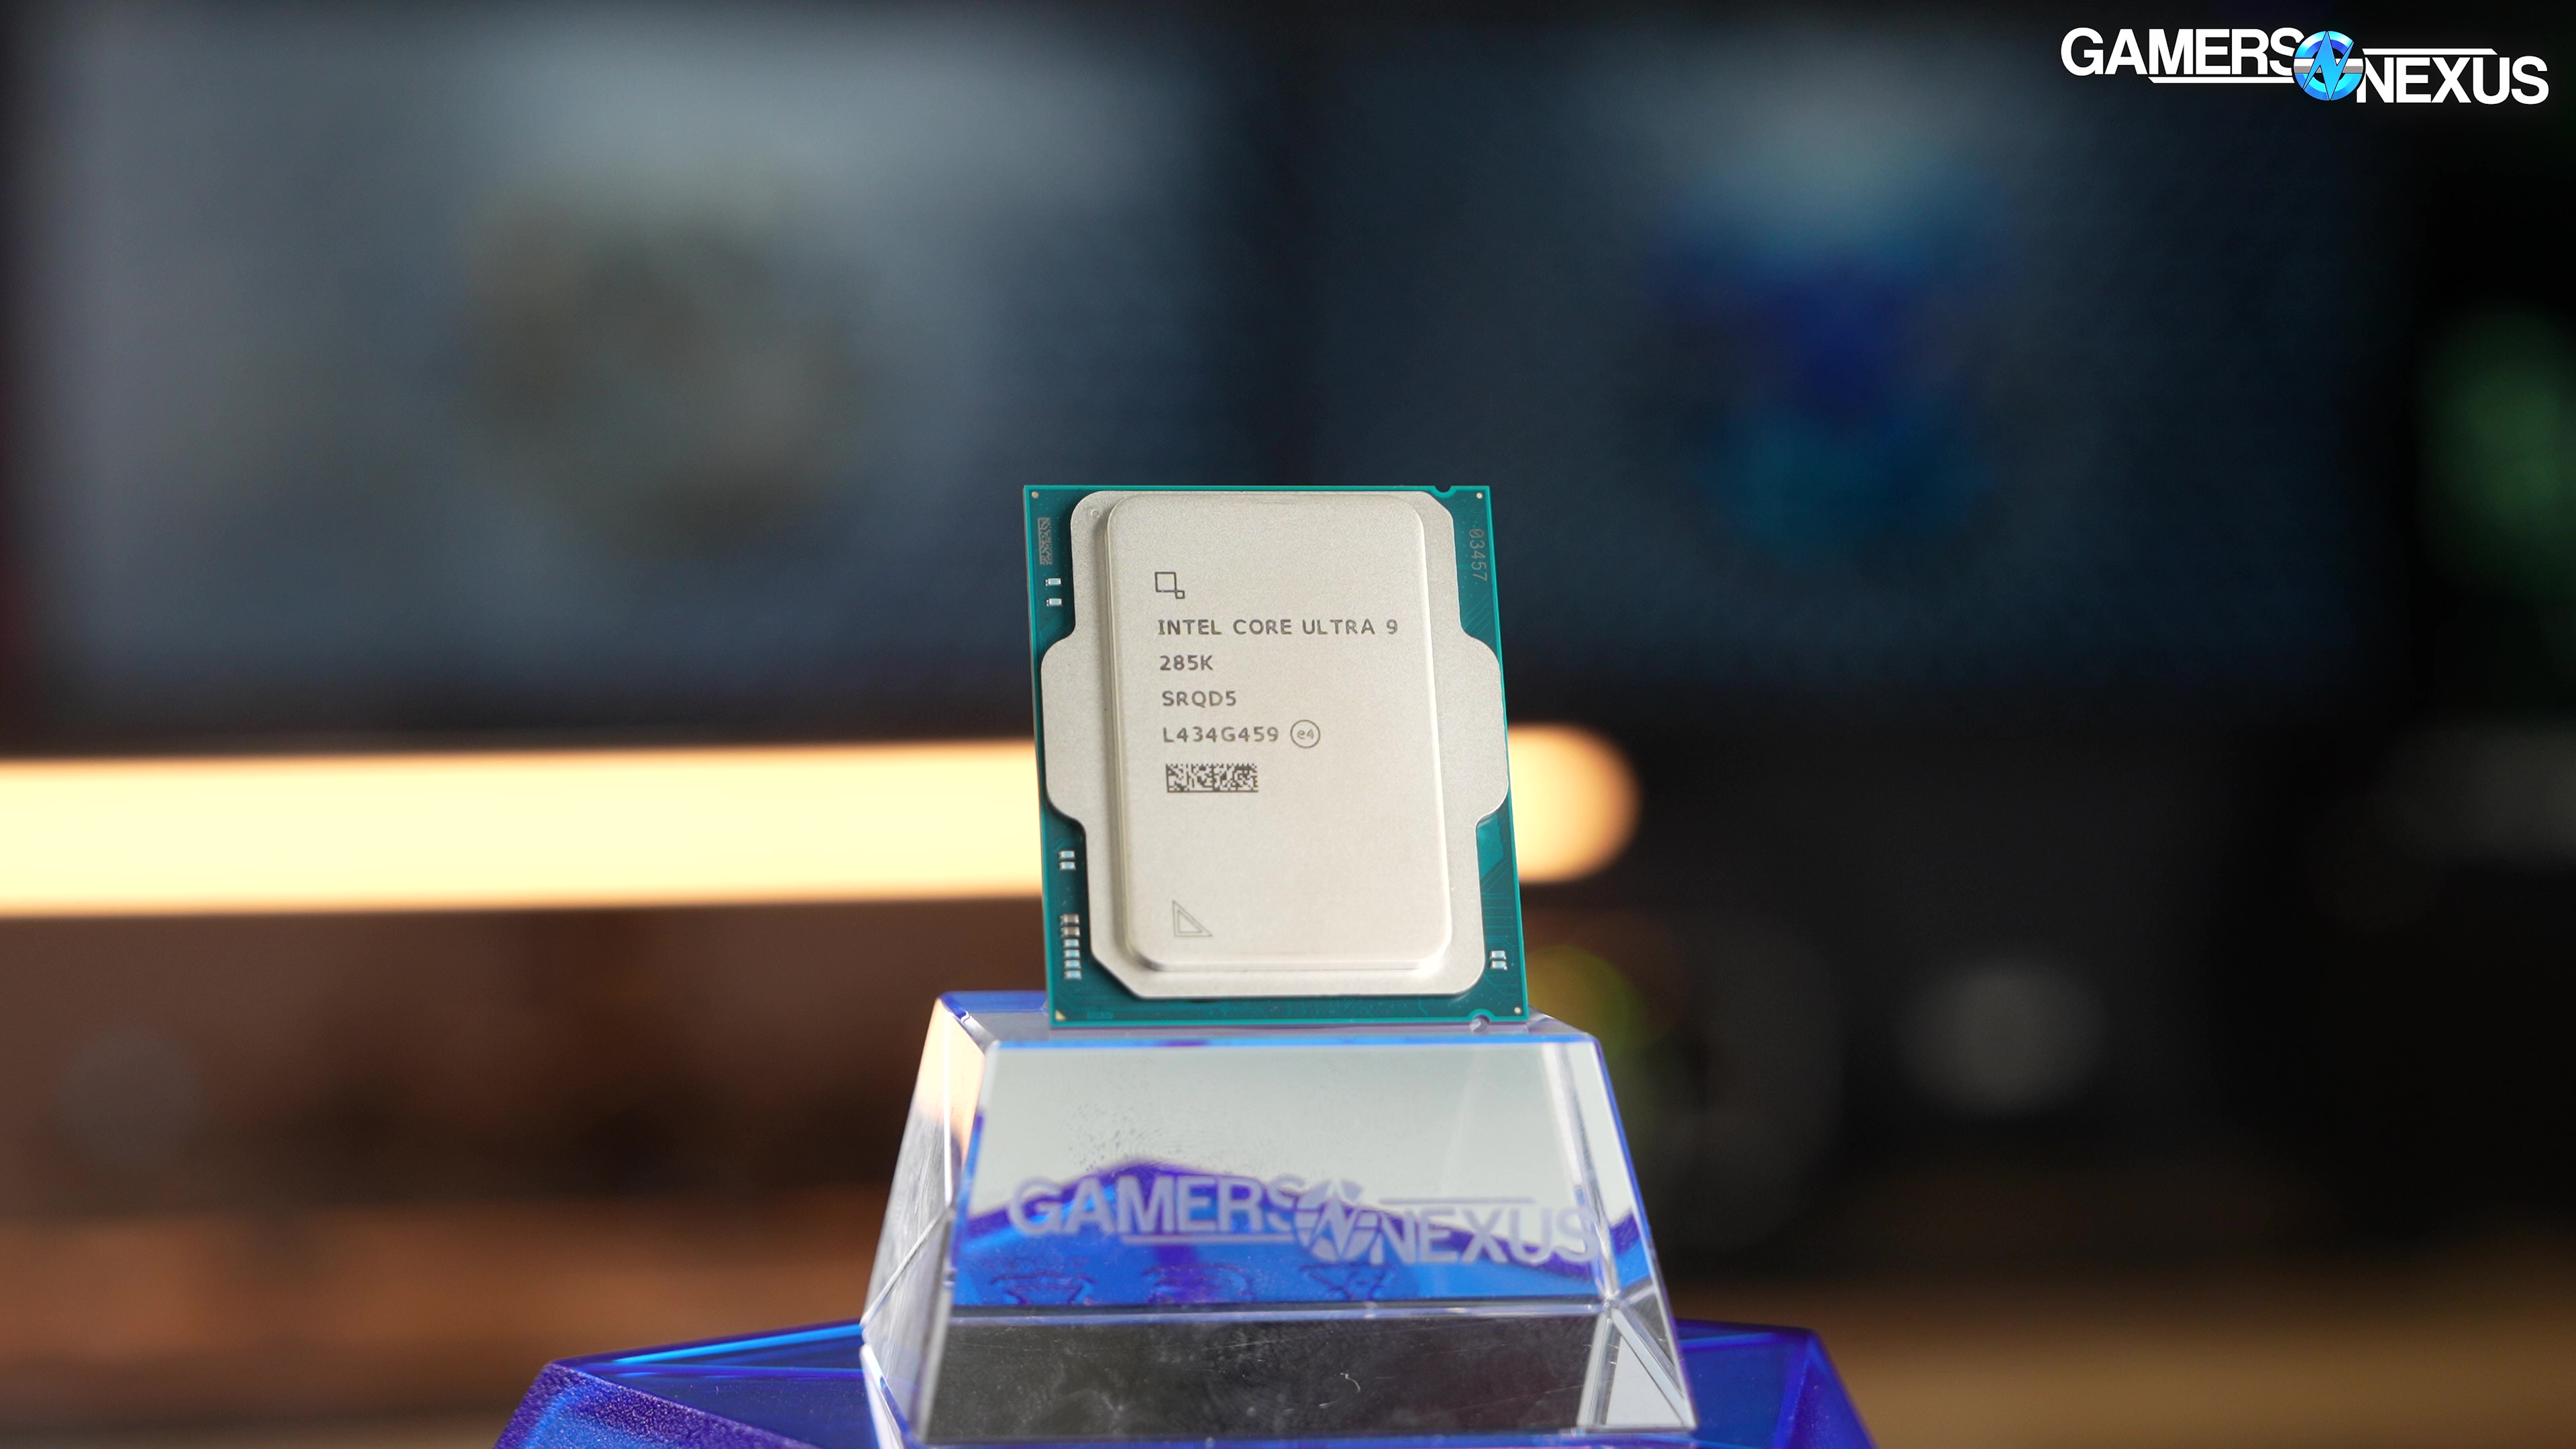
Get It Together, Intel: Core Ultra 9 285K CPU Review & Benchmarks vs. 7800X3D, 9950X, More
Last Updated:
We test Intel’s Core Ultra 9 285K CPU in a series of efficiency, productivity, and gaming benchmarks
The Highlights
- The 285K does away with hyperthreading and offers 8-P cores and 16-E cores
- For non-gaming applications, the 285K is interesting but its price isn’t justifiable
- AMD’s 7800X3D is far superior for gaming and efficiency
- Original MSRP: $590-$630
- Release Date: October 24, 2024
Table of Contents
- AutoTOC

Intro
We’re reviewing the Intel Core Ultra 285K CPU.
Take a look at the giant spiky ATX12V line for the 285K on the chart below compared to the 14900K ATX12V line. This is going to be a problem for testing power today and efficiency. It’s not as simple as just measuring the EPS12V cables anymore, at least not on ASUS.
Editor's note: This was originally published on October 24, 2024 as a video. This content has been adapted to written format for this article and is unchanged from the original publication.
Credits
Test Lead, Host, Writing
Steve Burke
Testing
Patrick Lathan
Testing, Editing
Mike Gaglione
Quality Control
Jeremy Clayton
Camera, Video Editing
Vitalii Makhnovets
Camera
Tim Phetdara
Writing, Web Editing
Jimmy Thang
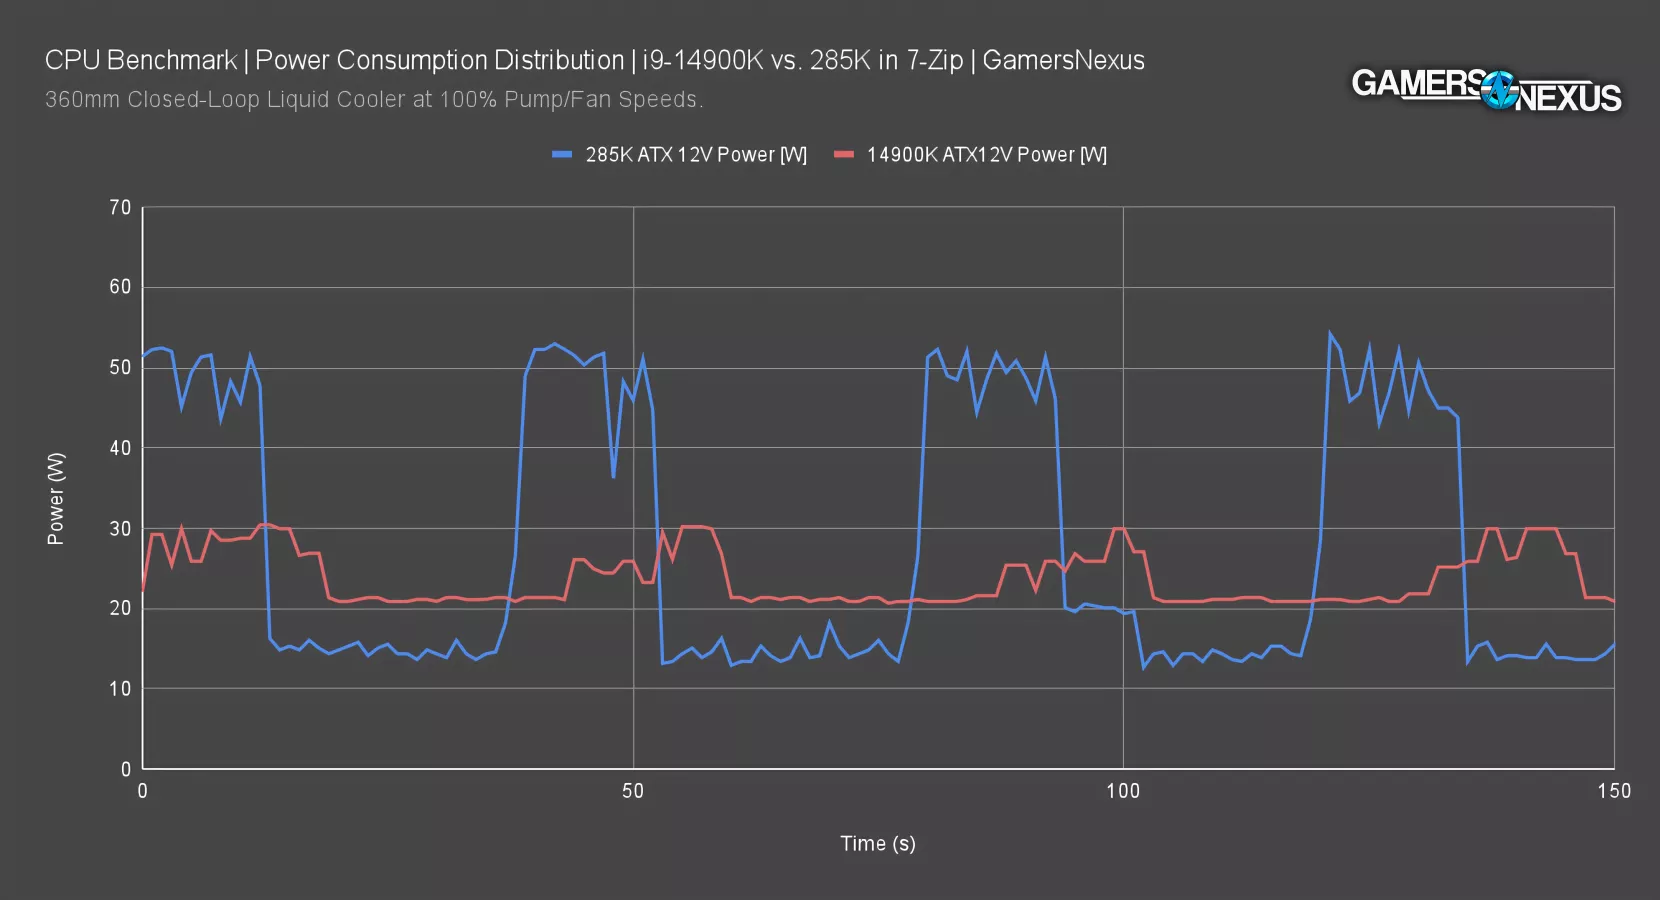
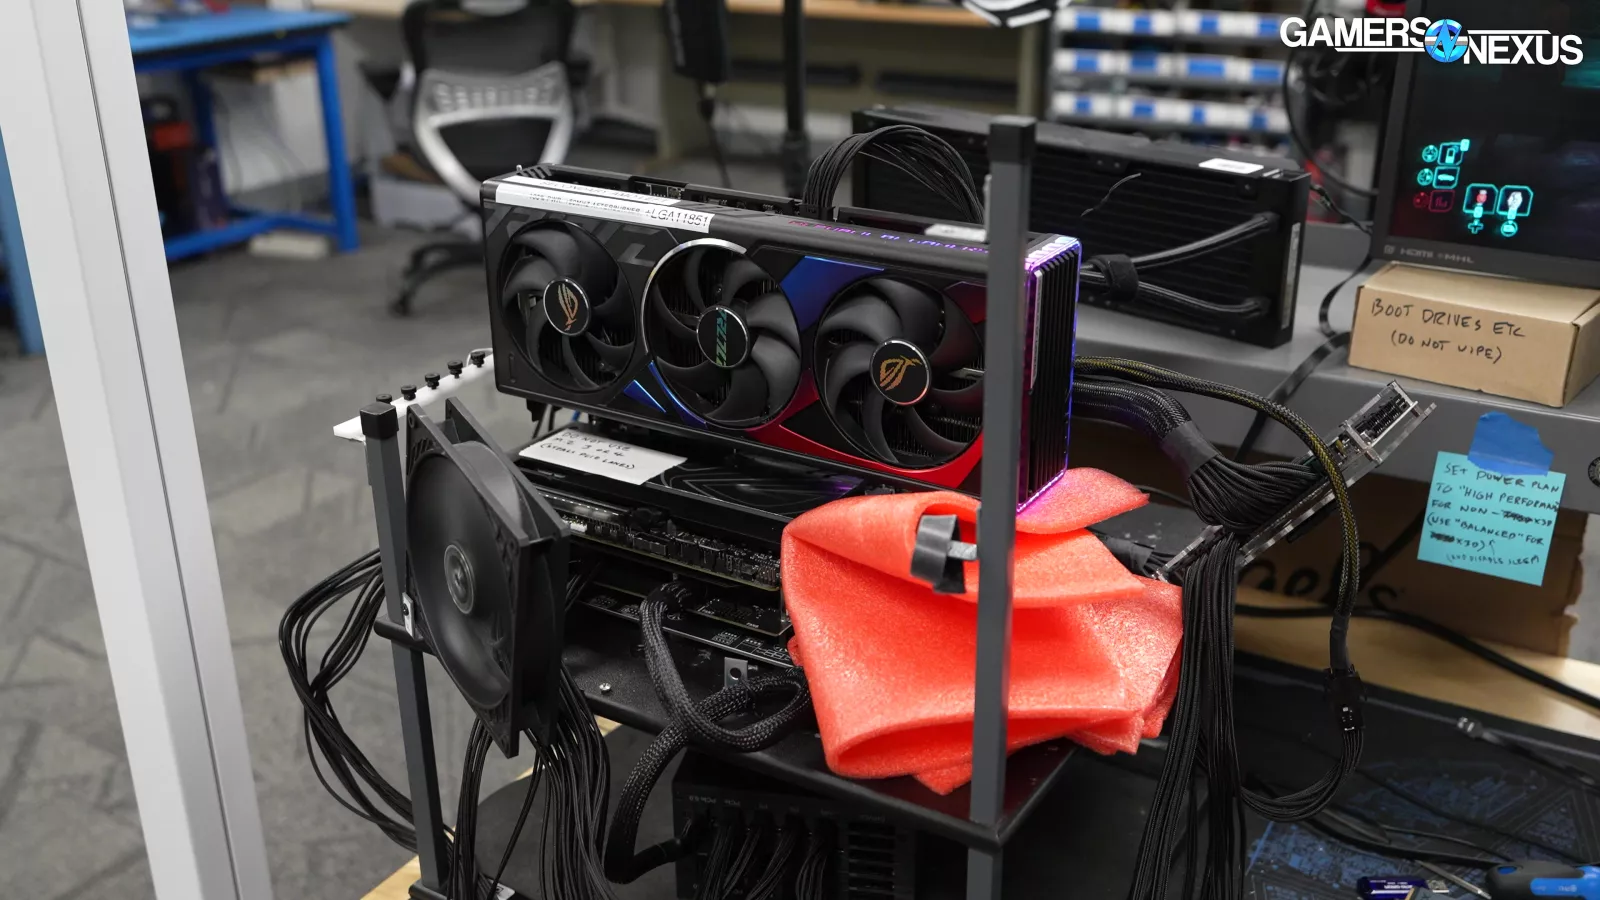
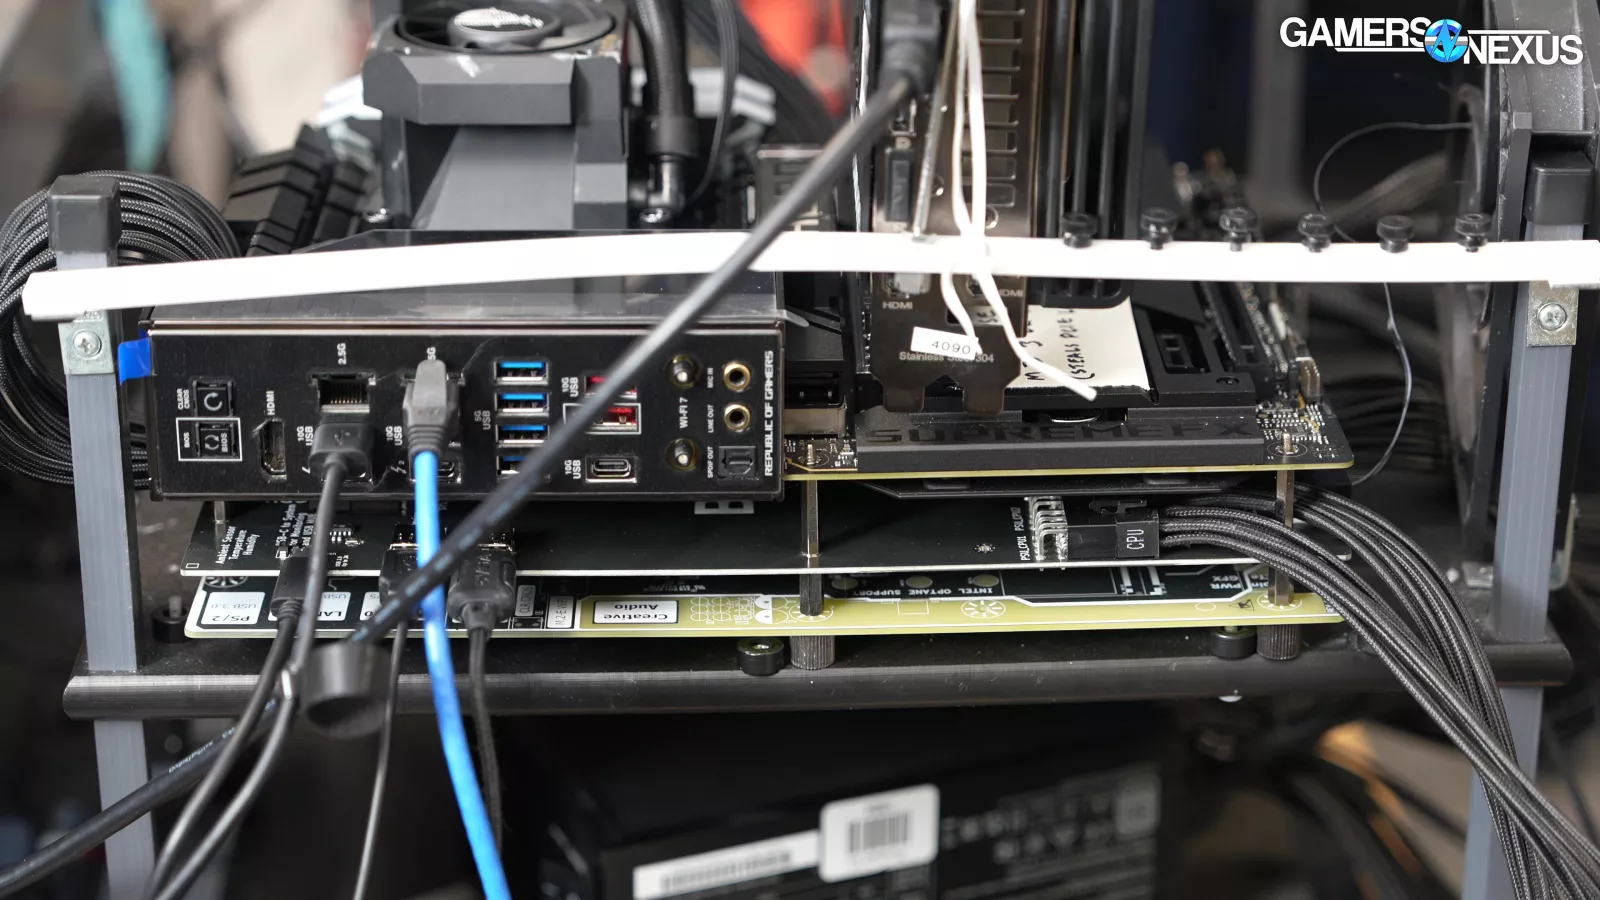
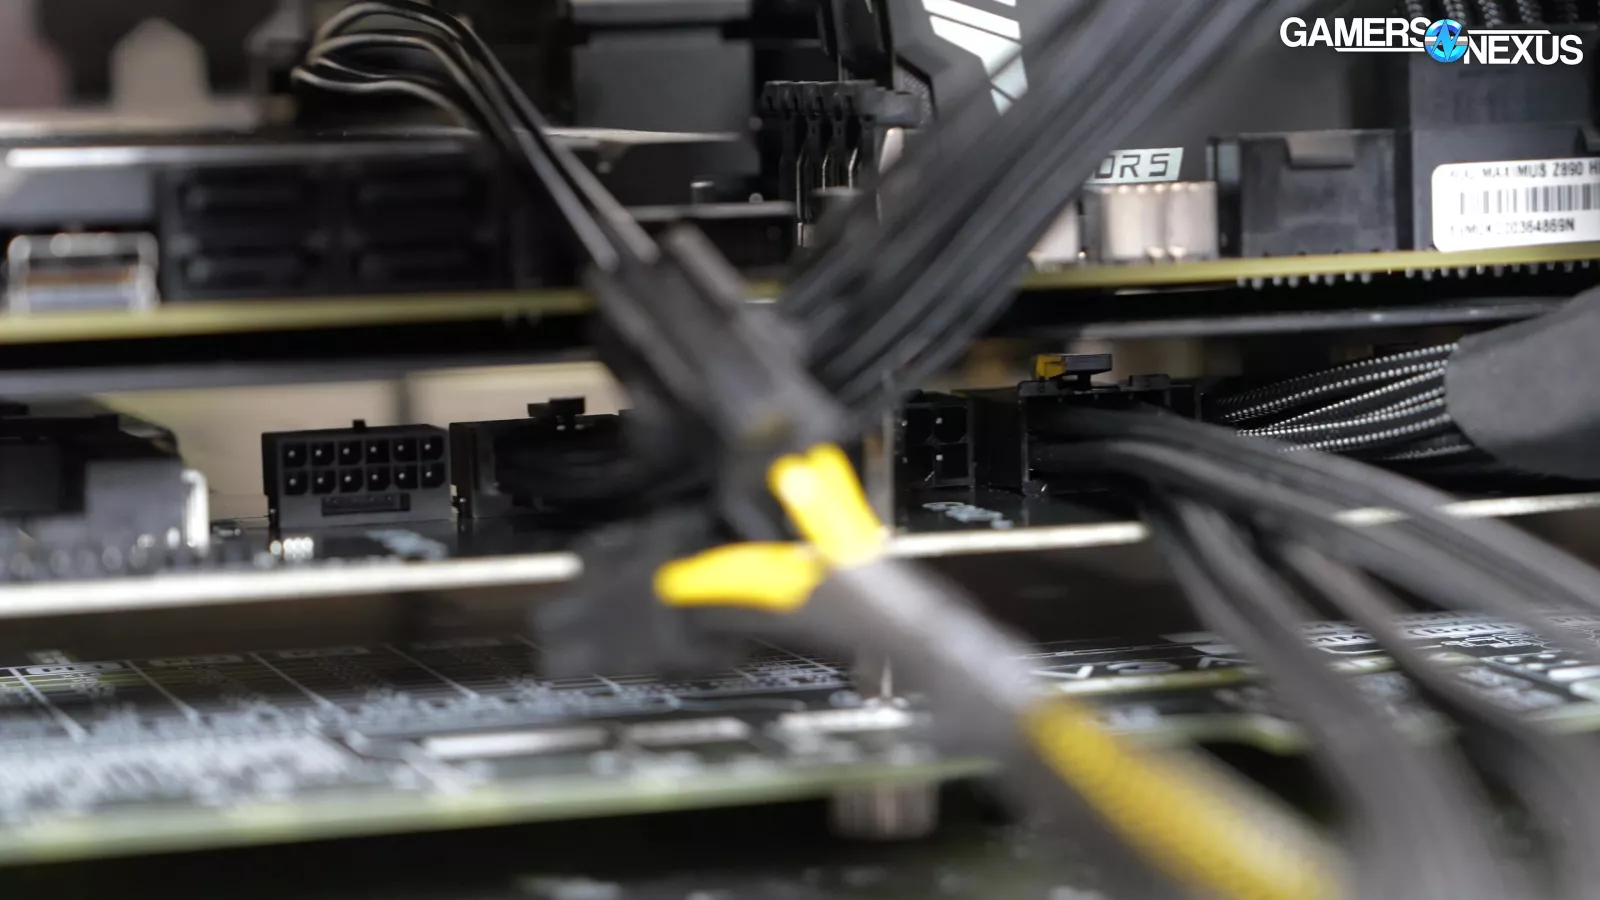
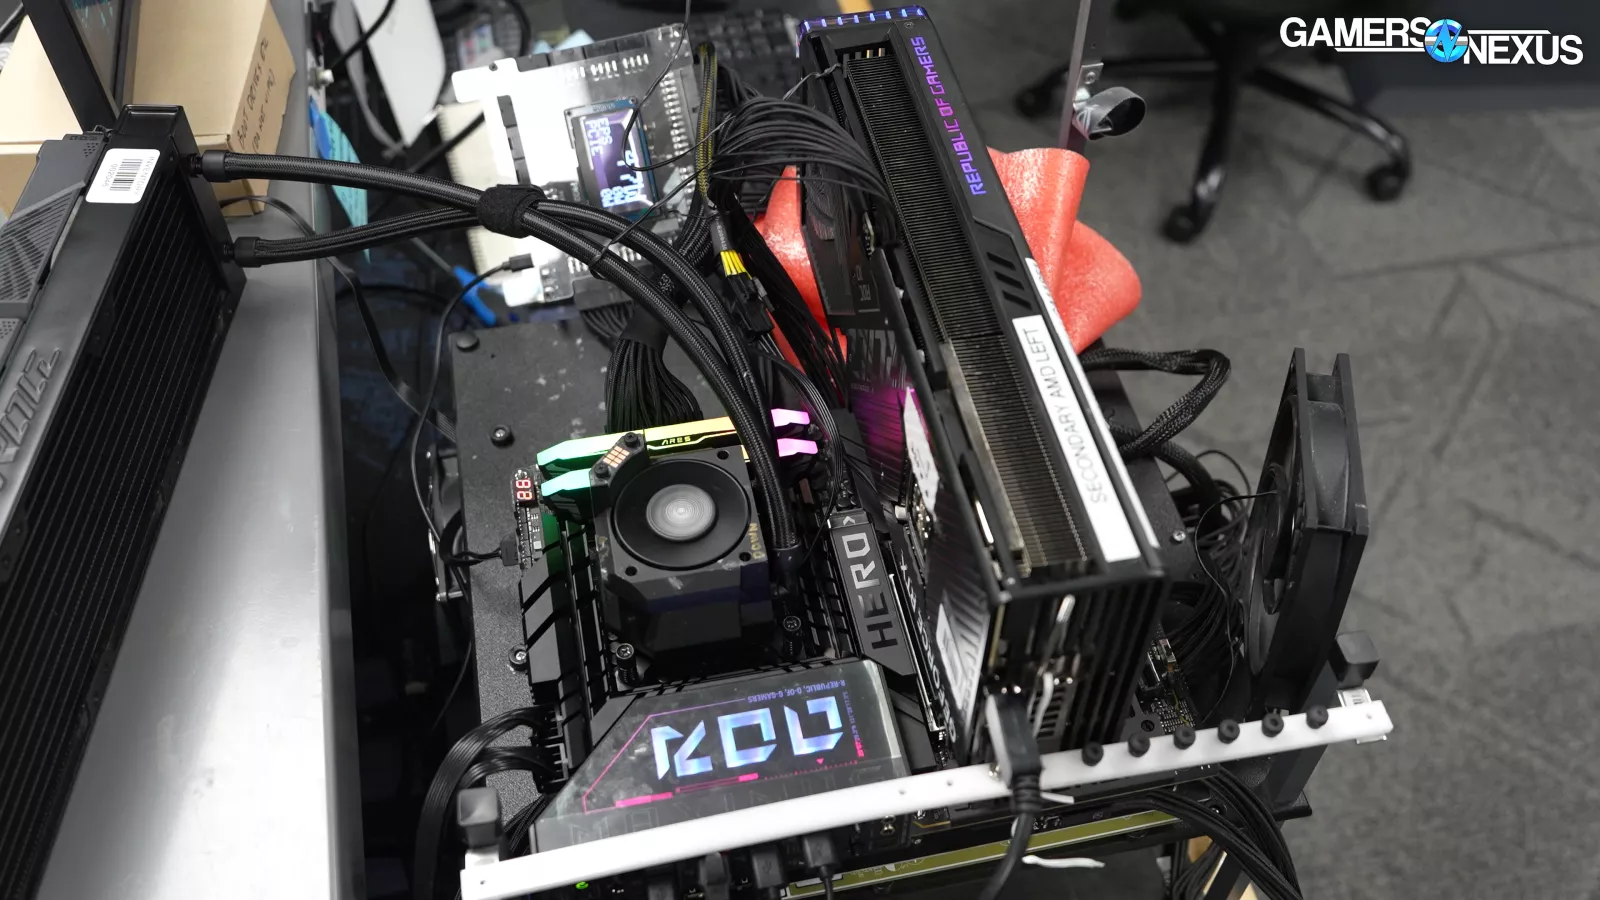
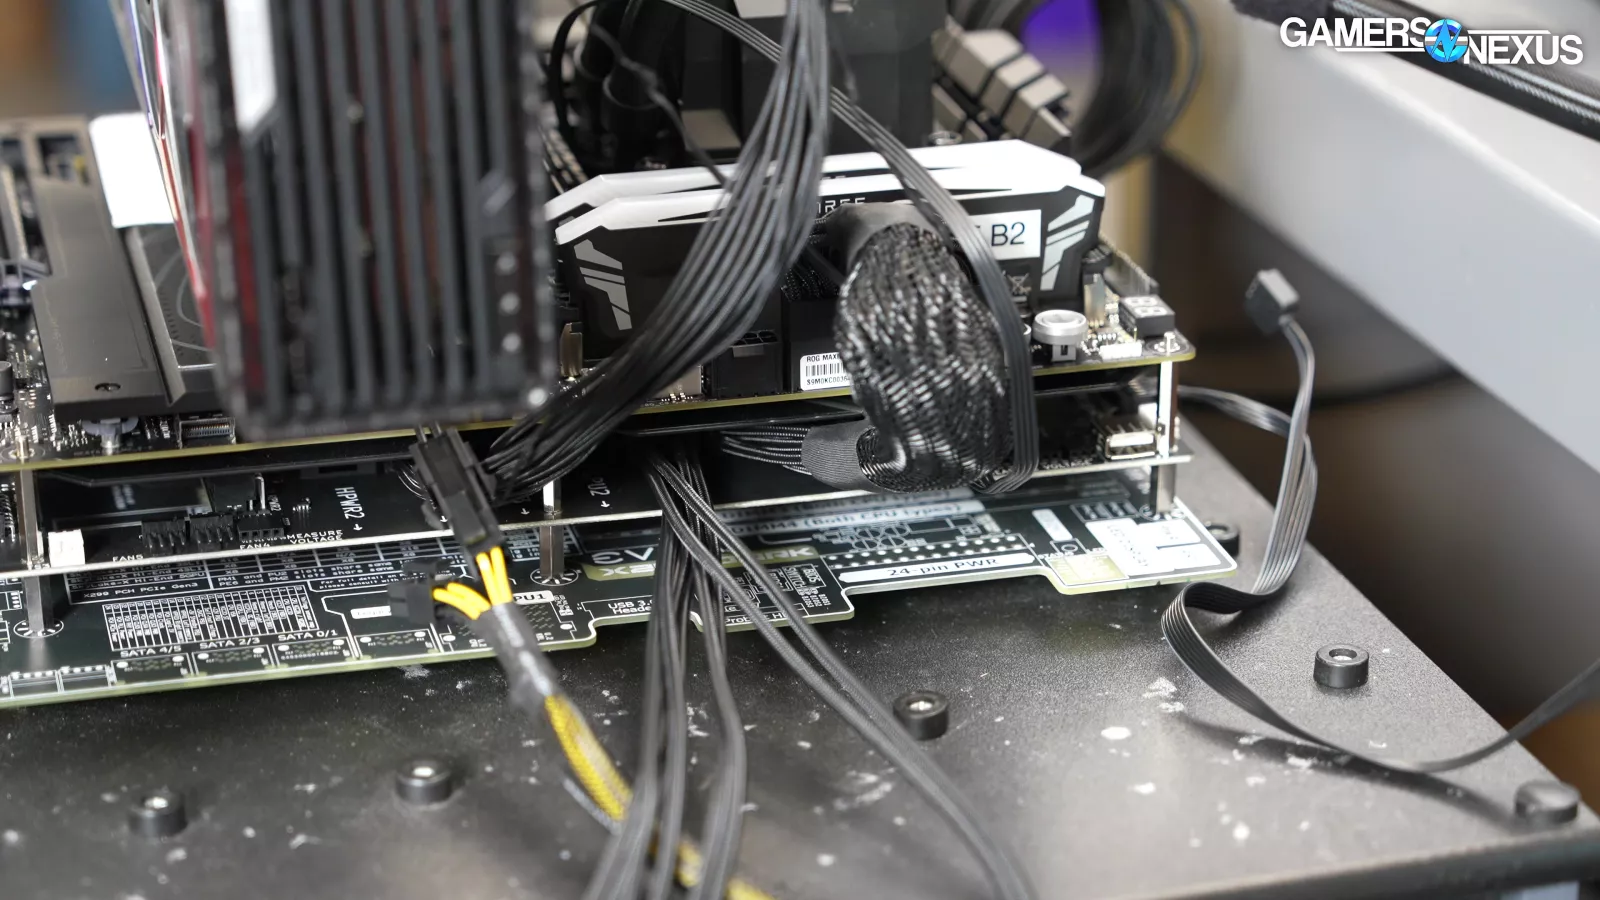
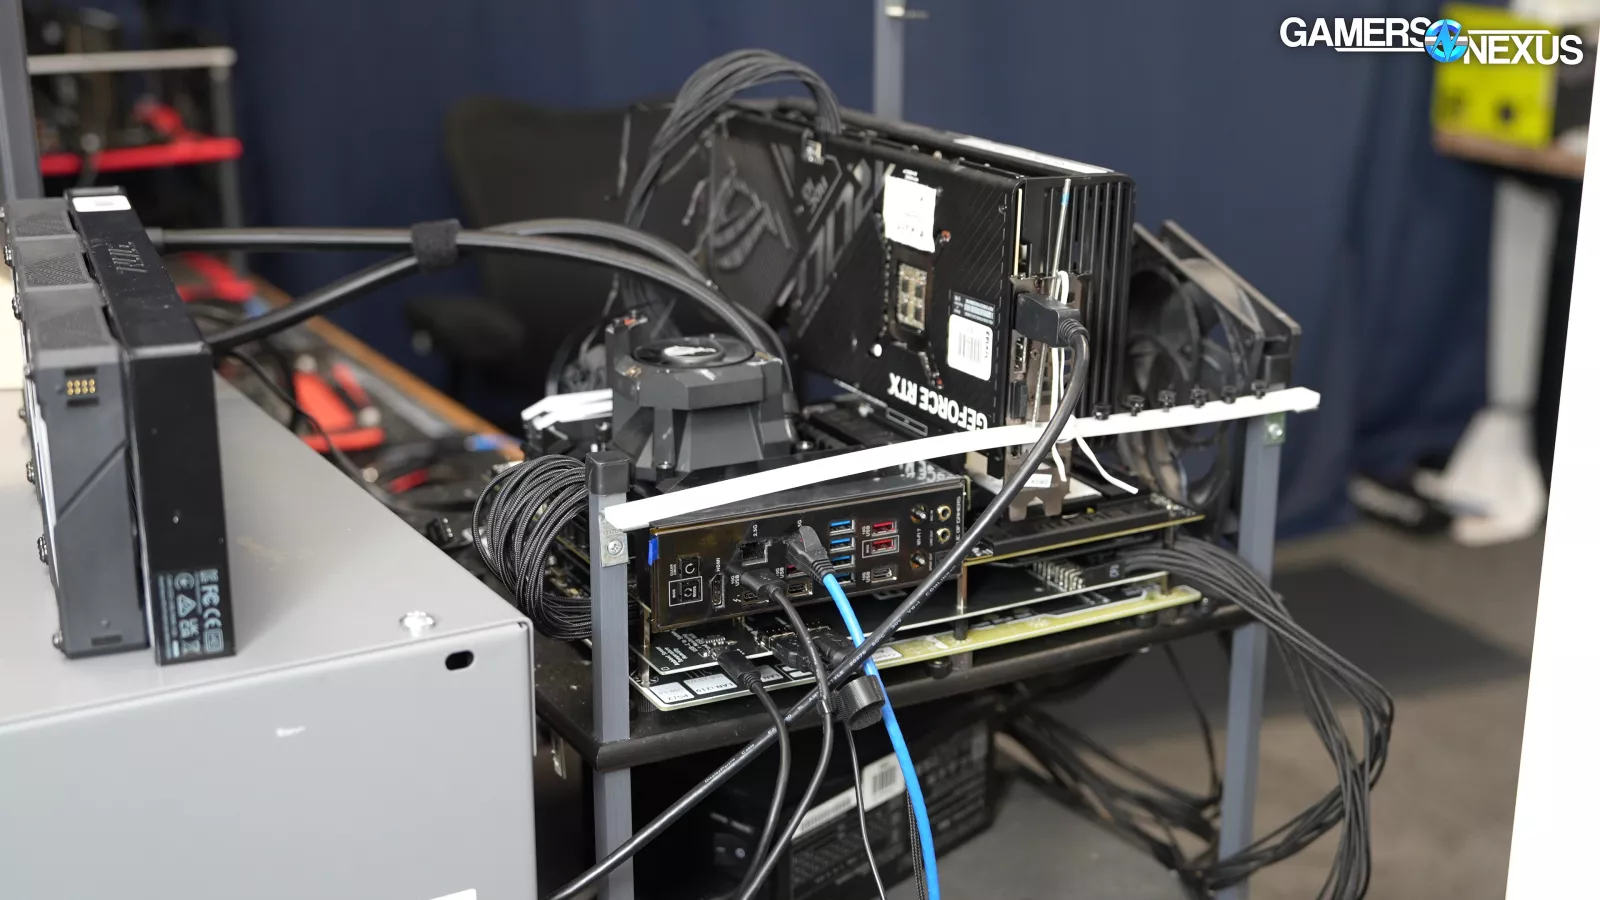
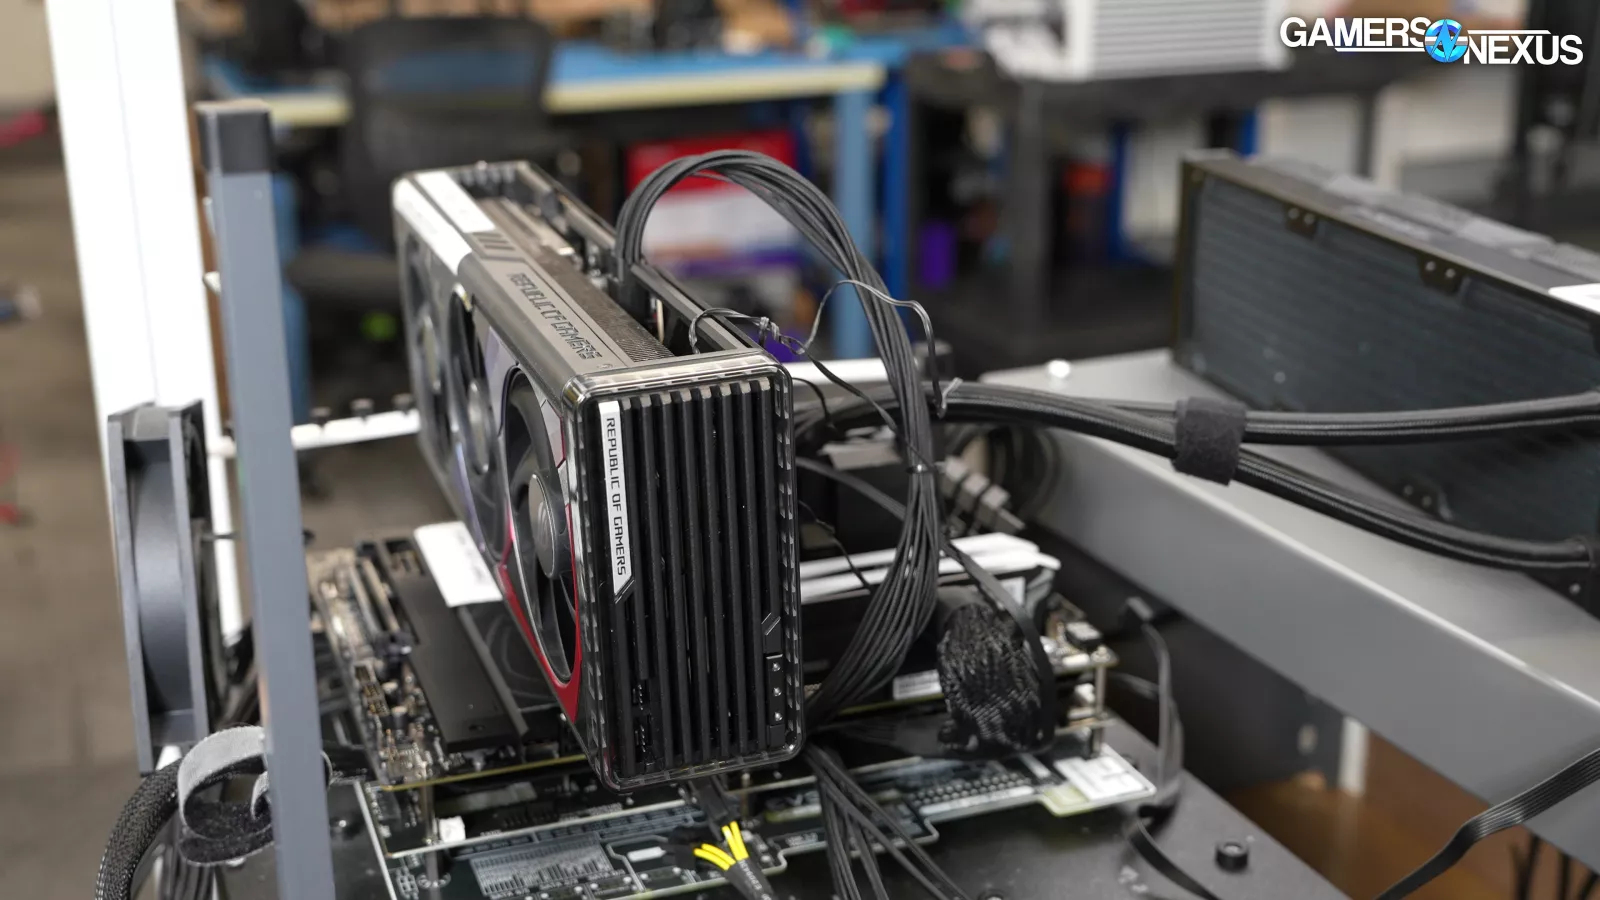
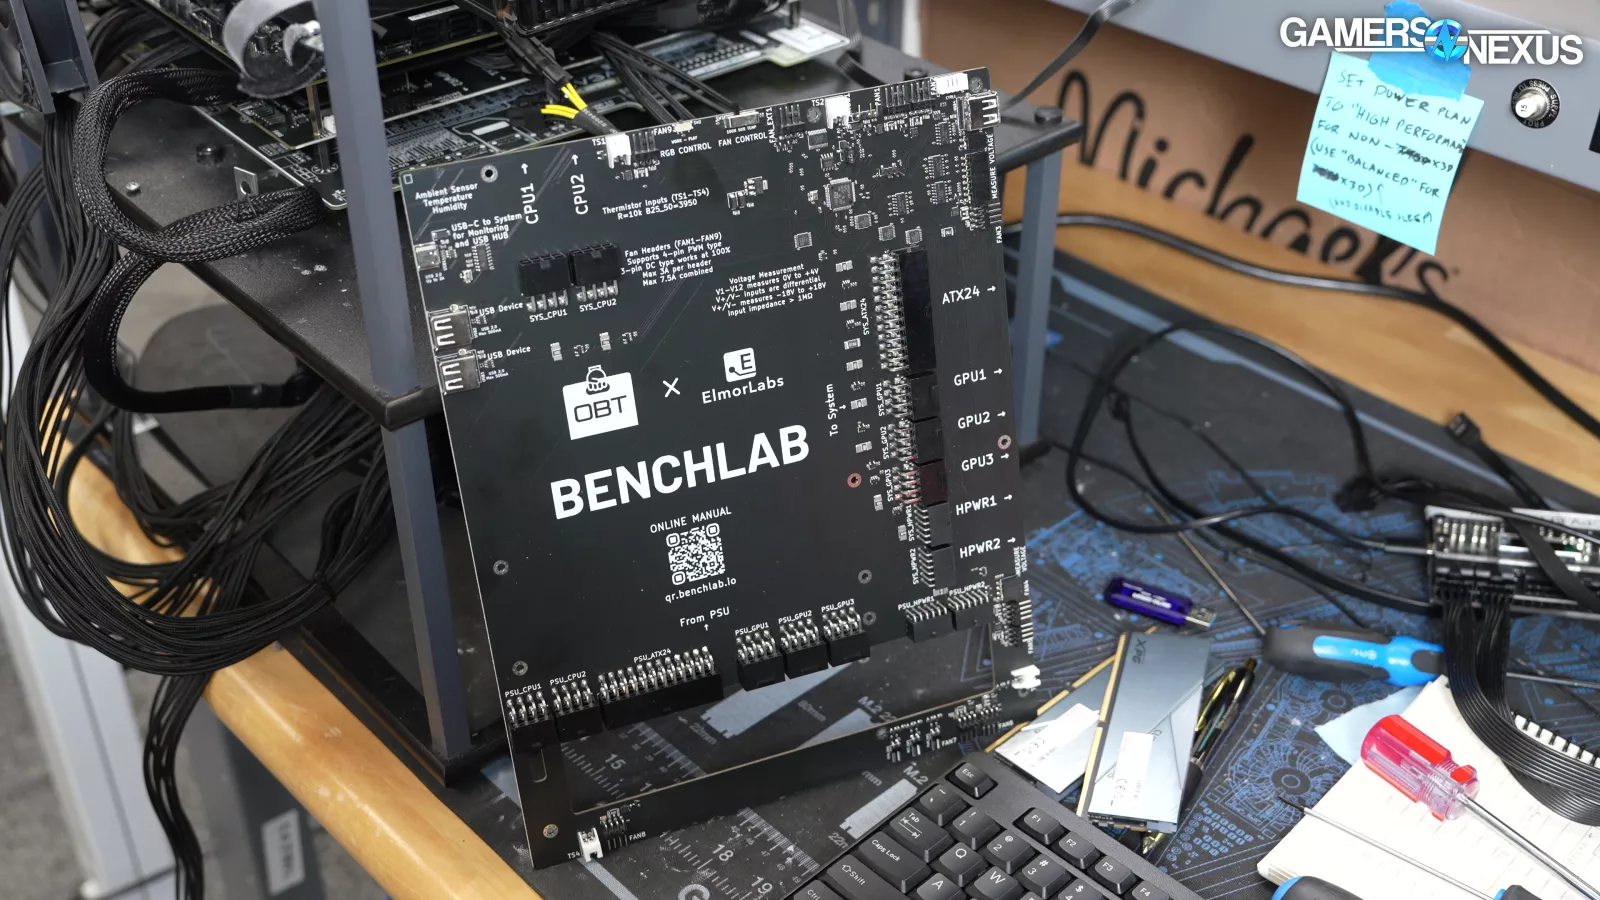
We had to build a monstrosity to isolate the power consumption to the CPU for Arrow Lake, because ASUS is pulling significant power down the ATX 24-pin connector and not just the EPS12V cables.
If we didn’t do all of this, we would have measured the 285K as the most efficient CPU possibly ever made, but that’s because the power has simply moved to split across 4 phases for the 24-pin and 18 for the rest.
If it’s been a while since you checked in, you can think of the 285K as the “i9-15900K,” except Intel stopped that naming.
Intel’s big claim is that power consumption is halved, so we’ll spend a lot of time validating that today. Let’s get started.
Intel Core Ultra 9 285K Pricing
We’ll start with a price round-up of the current landscape.
CPU Price Comparison | GamersNexusLate October, 2024
| Newegg Price | Amazon Price | |
| Intel 285K (MSRP $590) | $630 | N/A |
| Intel 14900K | $470 | $470 |
| Intel 14700K | $375 | $350 |
| Intel 13900K | N/A | $415 |
| Intel 13700K | $350 | $290 |
| Intel 12900K | $300 | $280 |
| Intel 12600KF | $160 | $160 |
| AMD 9950X | $600 | $710 |
| AMD 9900X | $430 | $430 |
| AMD 9700X | $330 | $330 |
| AMD 7950X3D | $600 | $600 |
| AMD 7950X | $510 | $510 |
| AMD 7900X | $400 | $400 |
| AMD 7900 | $370 | $370 |
| AMD 7800X3D | $480 | $480 |
We put this table together a few days before launch, so the exact prices may be different when this story goes live; however, as Chronomancers haven’t been a core D&D class since AD&D 2e in 1995 with TSR’s publication of the Chronomancer handbook, we haven’t had a way to time travel for a couple decades and regretfully can’t review future prices anymore.
The 285K is $630 with the pre-order pricing, or $160 more than the 14900K (read our review). We don’t care about the launch MSRP of prior parts, only what they’re available at today since that’s when people buy things.
The 14700K is $350-$375, the 13700K is $290 in some places, the 12900K is down to $280, and the much weaker 12600KF is now $160. Buying into these dead platforms isn’t a great feeling, though.
AMD’s direct alternatives include the $480 7800X3D with a rumored 9800X3D in a week, so if that’s true, we’ll have more to say soon. The 285K is 31% more money than the 7800X3D. The 9950X is also cheaper than the 285K’s current pre-order price.
The new 285K is flanked by the best gaming CPU with the 7800X3D (watch our review) -- which is also the most efficient CPU we’ve tested recently -- and the 9950X and 7950X for production.
Intel Core Ultra 9 285K Specs & Basics
For the absolute barebones basics, the main thing you need to know is that Arrow Lake and the Core Ultra 200 lineup (so far) move away from monolithic silicon and toward a tile-based approach, including manufacturing from Intel competitor TSMC.
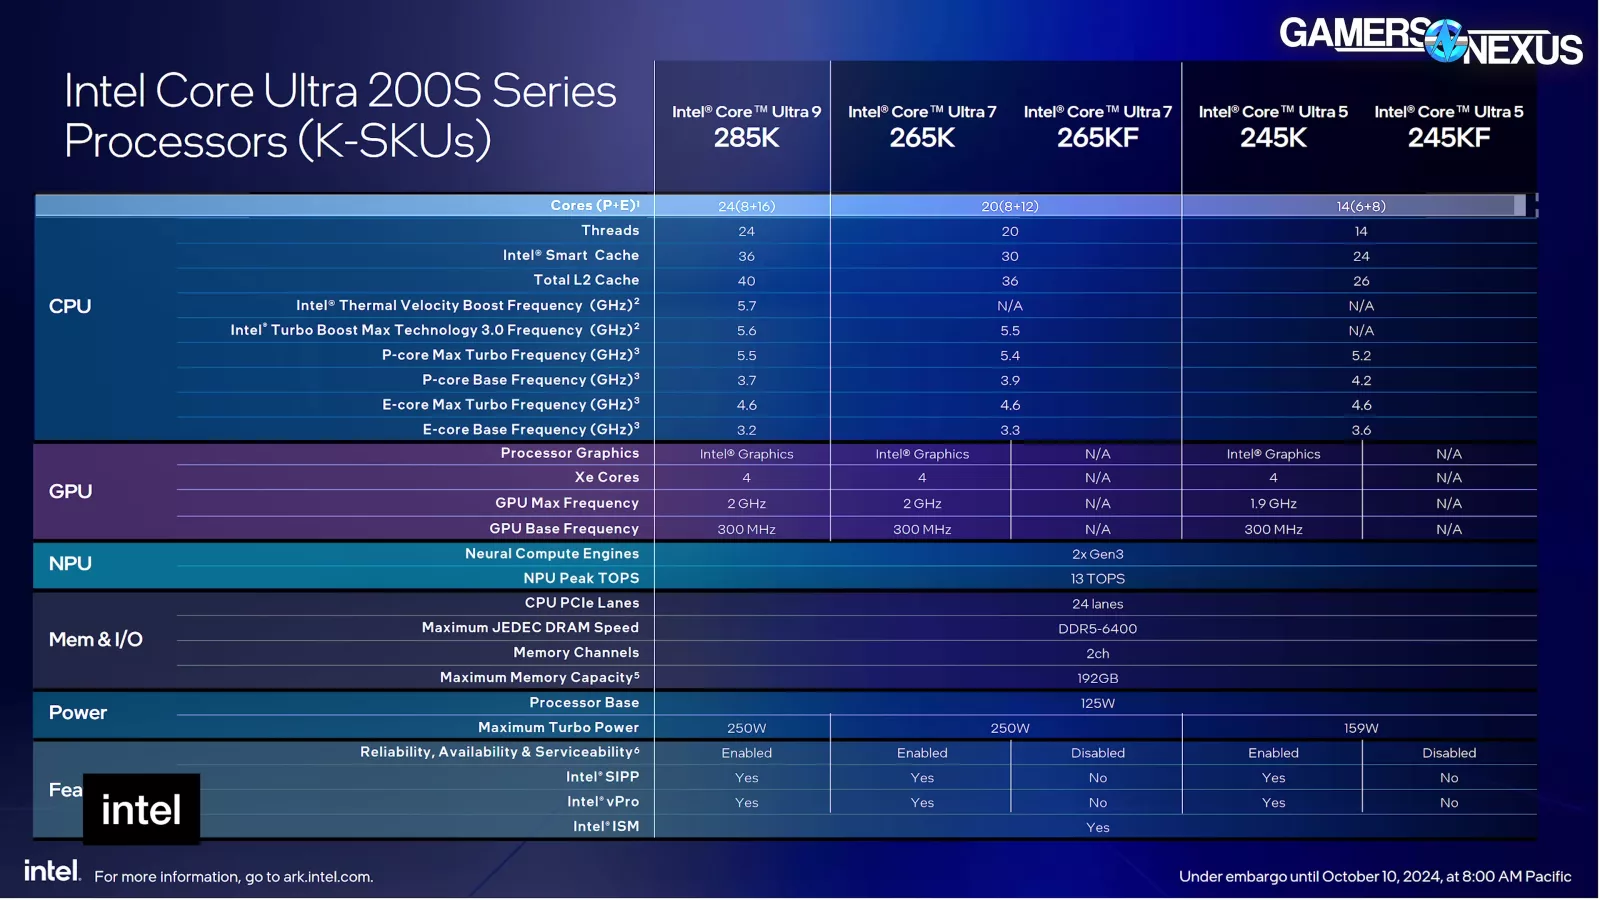
Intel has gotten rid of hyper-threading and is instead moving to just P-cores and E-cores with these CPUs, so the 285K has 8-P cores, 16 E-cores, and 24 threads against the 14900K’s 32 total threads. Frequency is also down, now at 5.7GHz advertised but because the architectures are different, you can’t directly compare the frequency numbers. We’ll review the 245K next, but that one’s at 6 P-cores and 8 E-cores.
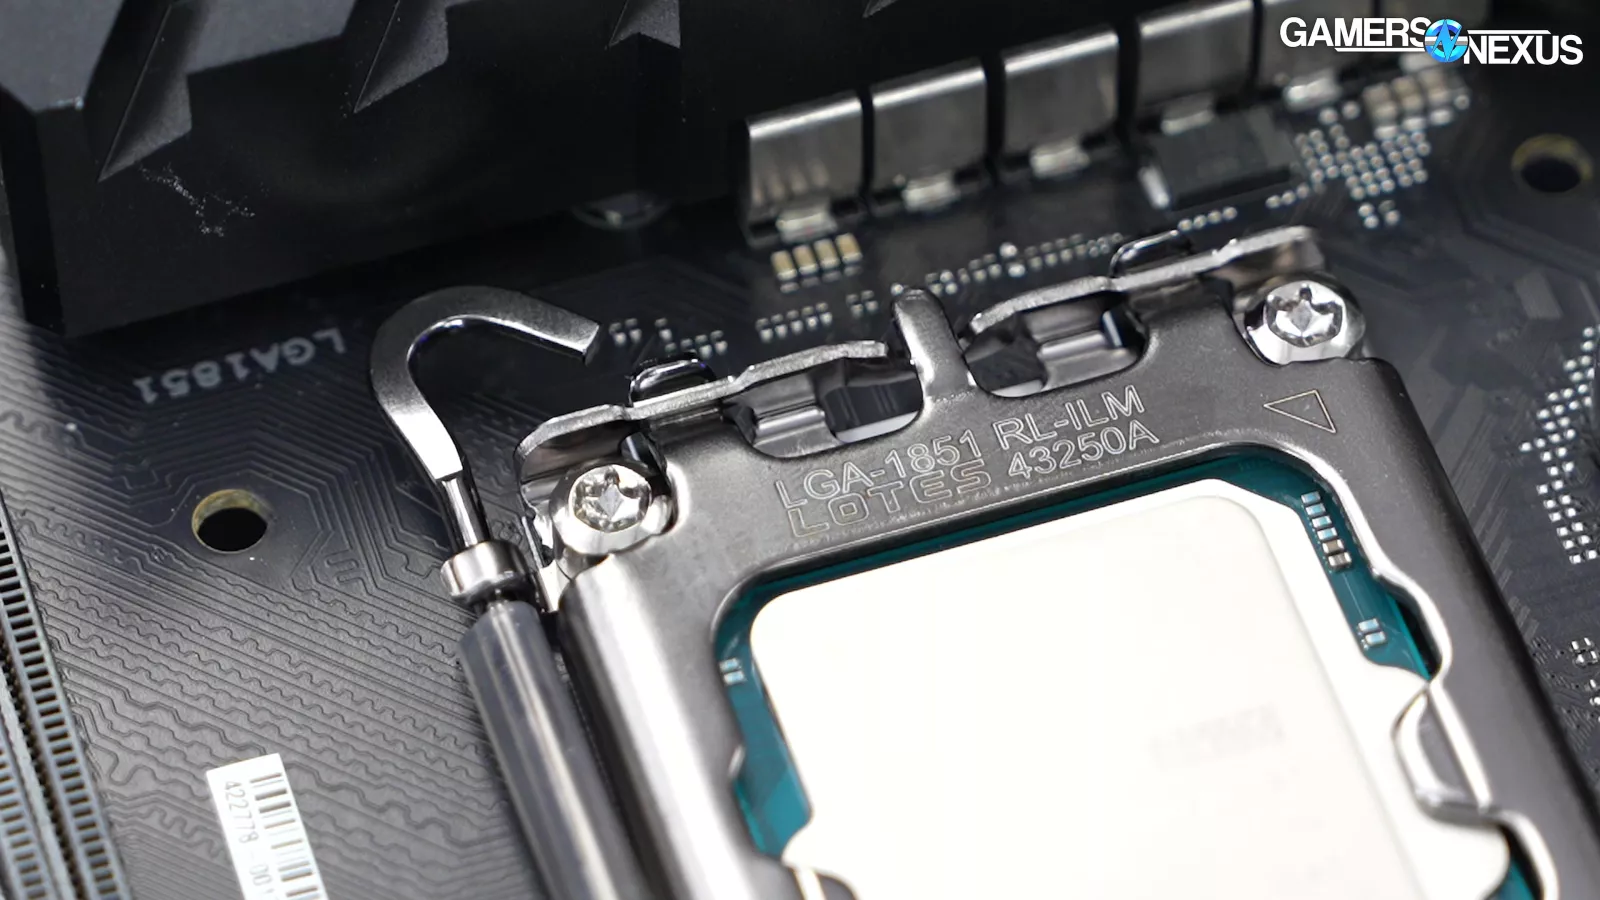
The new platform is LGA 1851 and requires new motherboards. These will not work in LGA 1700 motherboards, and LGA 1700 CPUs will not work in LGA 1851 motherboards. There are also multiple independent loading mechanism options chosen by motherboard manufacturers -- we’ll have a separate video shortly with laser scans and pressure maps of those. More specs can be found in our Arrow Lake announcement coverage.
Not Ready for Launch
First off: Arrow Lake really doesn’t seem ready for launch. Intel told us this about Arrow Lake in a briefing:
“The big change is that every ODM now, without fail, every ODM ships with this [APO] enabled. In the BIOS, the Camarillo device is turned on, there’ll be a yellow bang, the driver will install, and APO will be enabled by default. That’s the out-of-box-experience everybody is going to have. You’d want to mimic what folks are going to see.”
“This is going to be something that is going to be probably just as important as the hardware improvements. [...] All your ODMs, the board vendors, it’s all enabled by default and should auto-install, 13th Gen onward.”
This is important because we don’t test with APO so we had to consider it for this review.
Intel presented first-party benchmark slides with APO enabled and emphasized with us that not only would it be on by default with Z890, but that it would also be on by default with Z790. Neither was true. We discovered this issue and brought it to Intel only because we weren’t sure if it was our fault, and it wasn’t. The company seemed totally unaware of this failing and, after some back-and-forth, eventually realized it had simply screwed up. As a result of our findings, Intel is moving to publish a list of motherboards that support APO out of the box on by default in BIOS going forward.
While that’s great for consumers so that it clears up the misleading nature of the original claims, this product is clearly not ready if we’re the ones beta testing such strong statements as “without fail” for a feature that wasn’t present, as pointless as it often is.
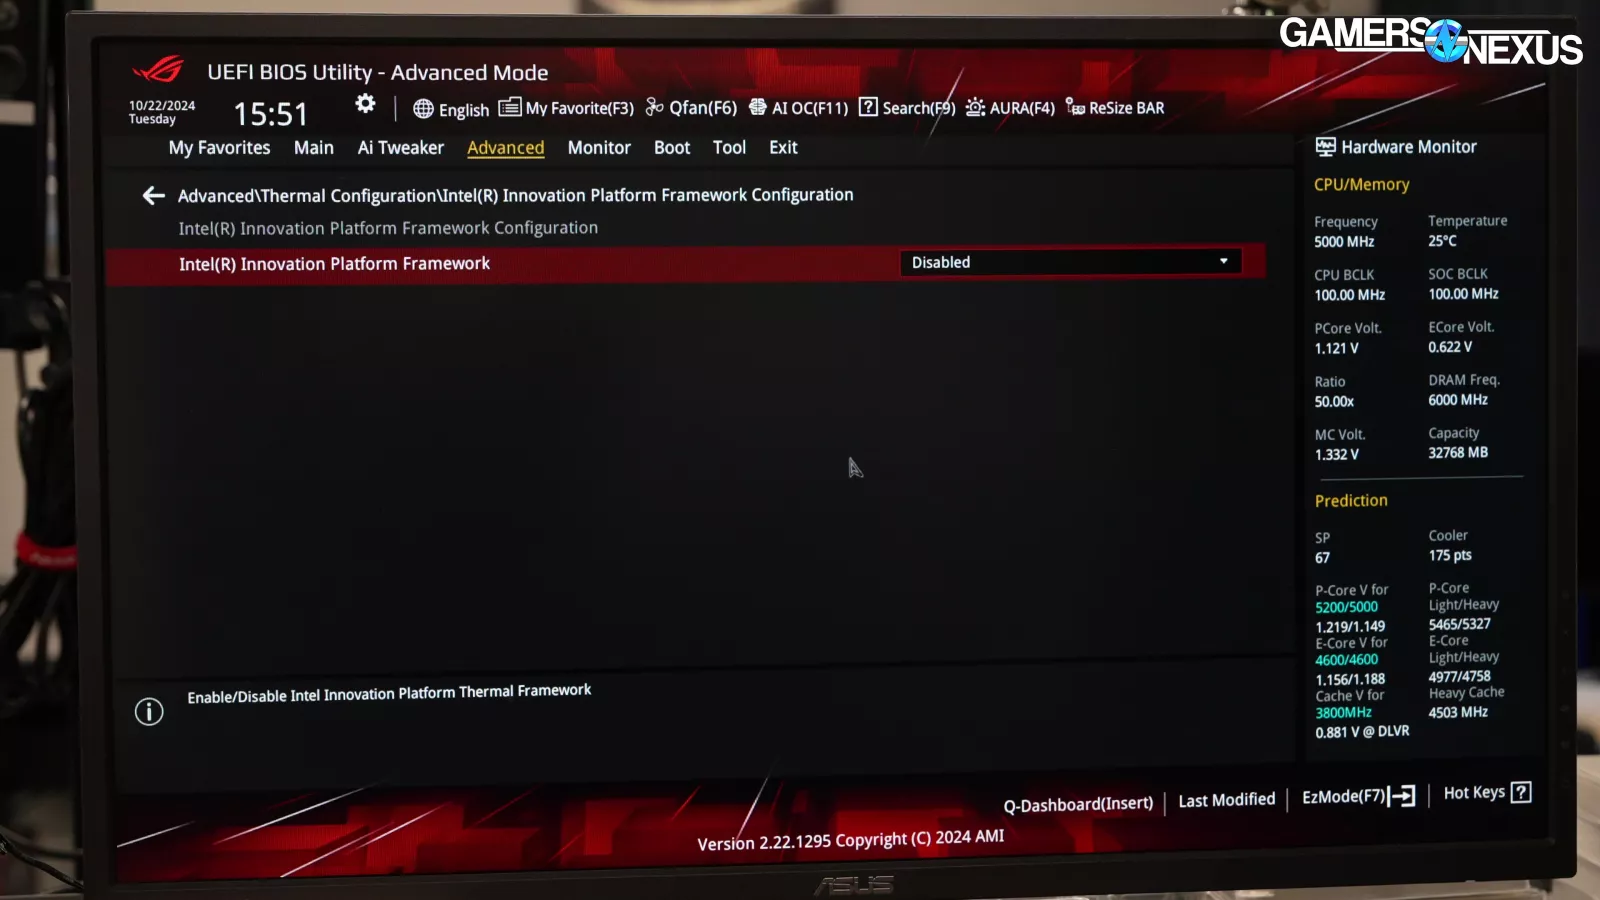
Dynamic Tuning also no longer exists on our board, despite Intel telling us that it should be present and enabled. The option has been renamed to Innovation Platform Framework and was off by default, which meant APO was off.
With the latest microcode and BIOS on Z790 for these reviews, we also found that APO was off by default for those platforms as well.
We consider APO off the default user experience for the product as Intel shipped it to us; however, we tested with both. APO was ultimately irrelevant in our test suite.
This was one of many unforced errors from Intel, with others including BSODs on Windows install due to a driver conflict with NVIDIA devices when the IGP is enabled. This issue did not exist on prior architectures and seems to be a combination of the new IGP claiming the PCIE resources and of NVIDIA’s driver code not having an error handler for 0 PCIE resource availability. You can bypass it by disabling the IGP, but for a lot of people, this will be frustrating.
The platform also has some issues with Easy Anti-Cheat, which Intel will soon be publishing a statement about, but we’ll leave that to Wendell’s coverage, but basically, if you disable security features, you’re able to work around the issue. We just wouldn’t recommend it.
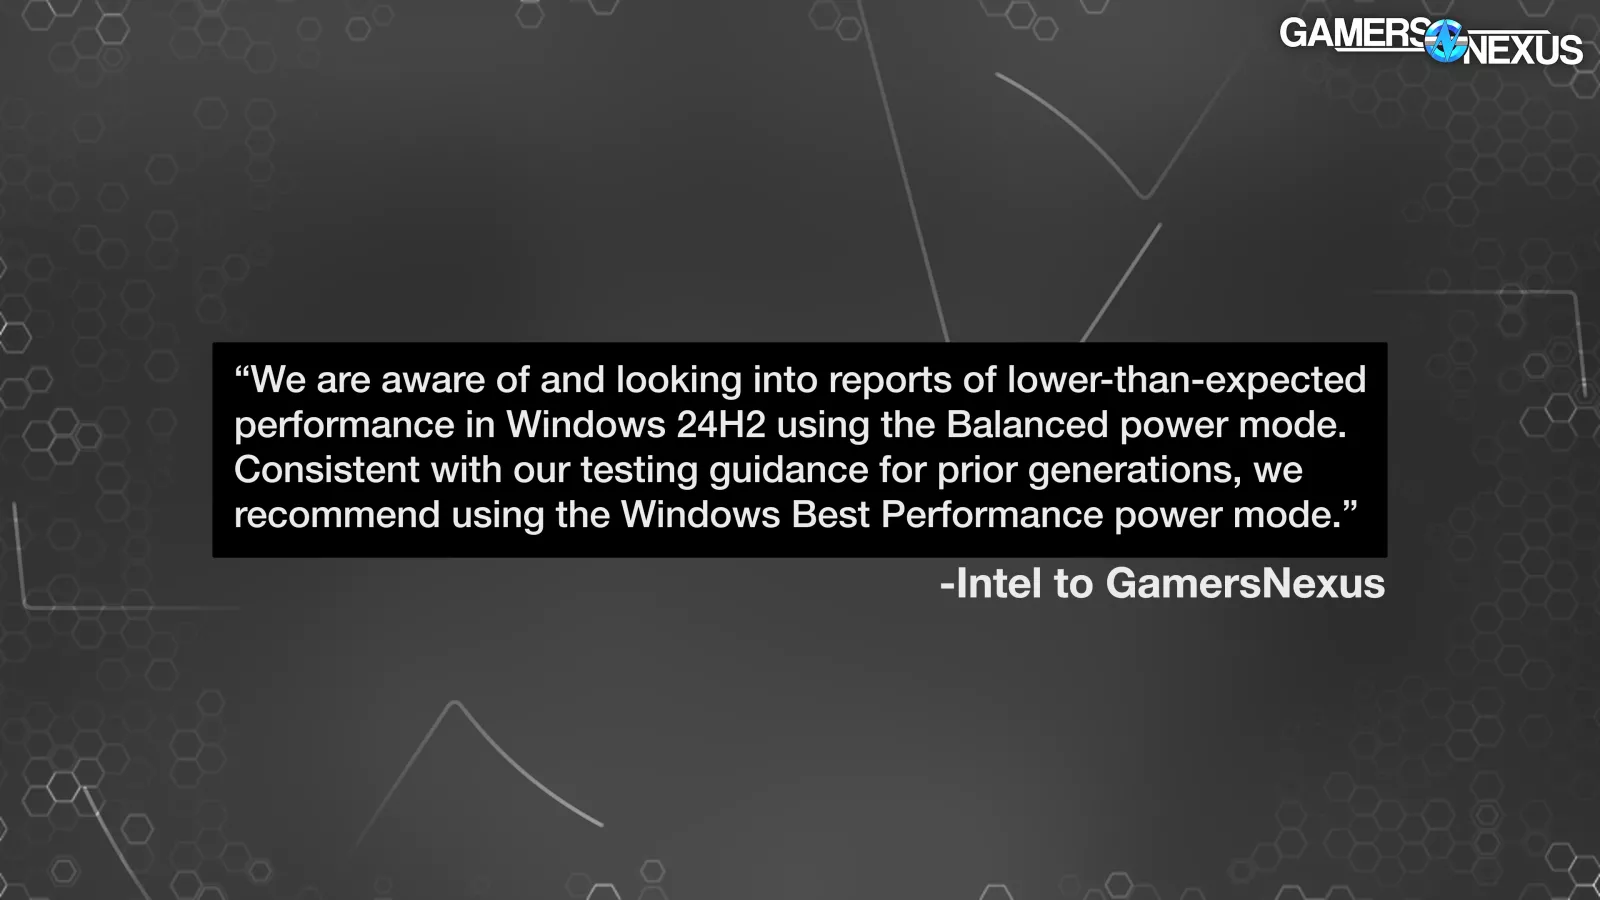
Additionally, Intel sent a statement about power profiles where balanced power on 24H2 results in uncharacteristically bad performance. We test with high performance except where we’re specifically required to use balance in some X3D situations so this didn’t affect us but does represent one of Intel’s launch problems.
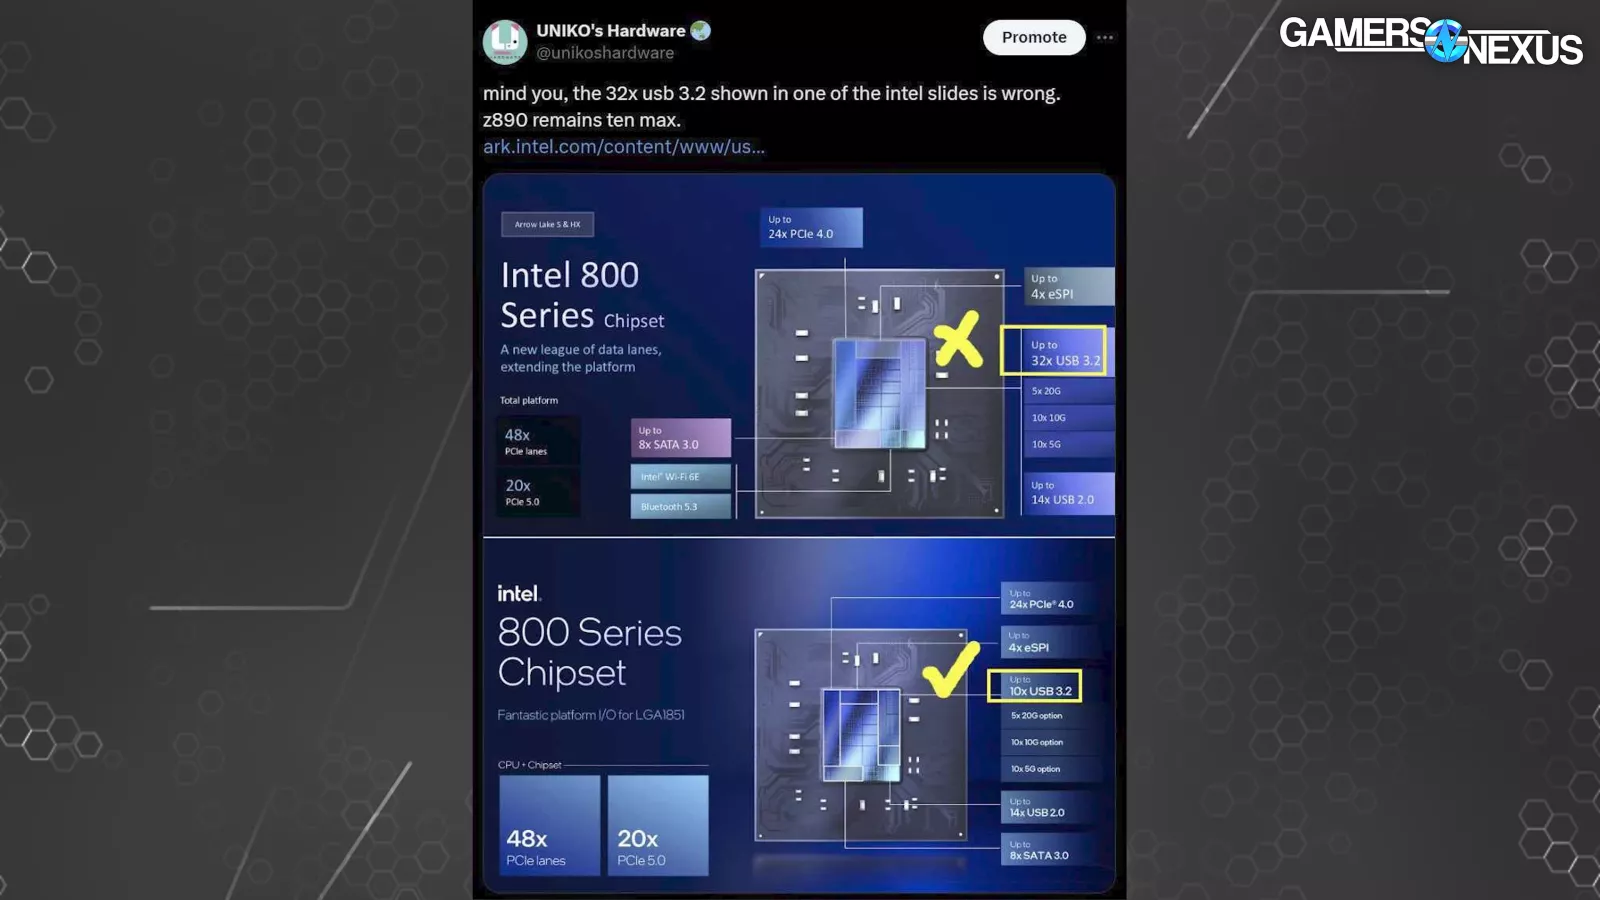
Intel even got its own specs wrong on the slide above where it said the chipset can support up to 32 USB 3.2 devices but actually it’s supposed to be 10. This is all to point out that Arrow Lake is really just not ready for launch.
Efficiency Testing
Power at 24-Pin & Raw Power Draw (Blender)
Let’s get into the efficiency testing.
This is really important, but we’ll try to keep it short: On at least the ASUS Z890 motherboard we have, the 24-pin is doing disproportionate work. This is likely a board-to-board thing, not Arrow Lake as a whole.
24-Pin & EPS12V Power: 14900K (Baldur’s Gate)
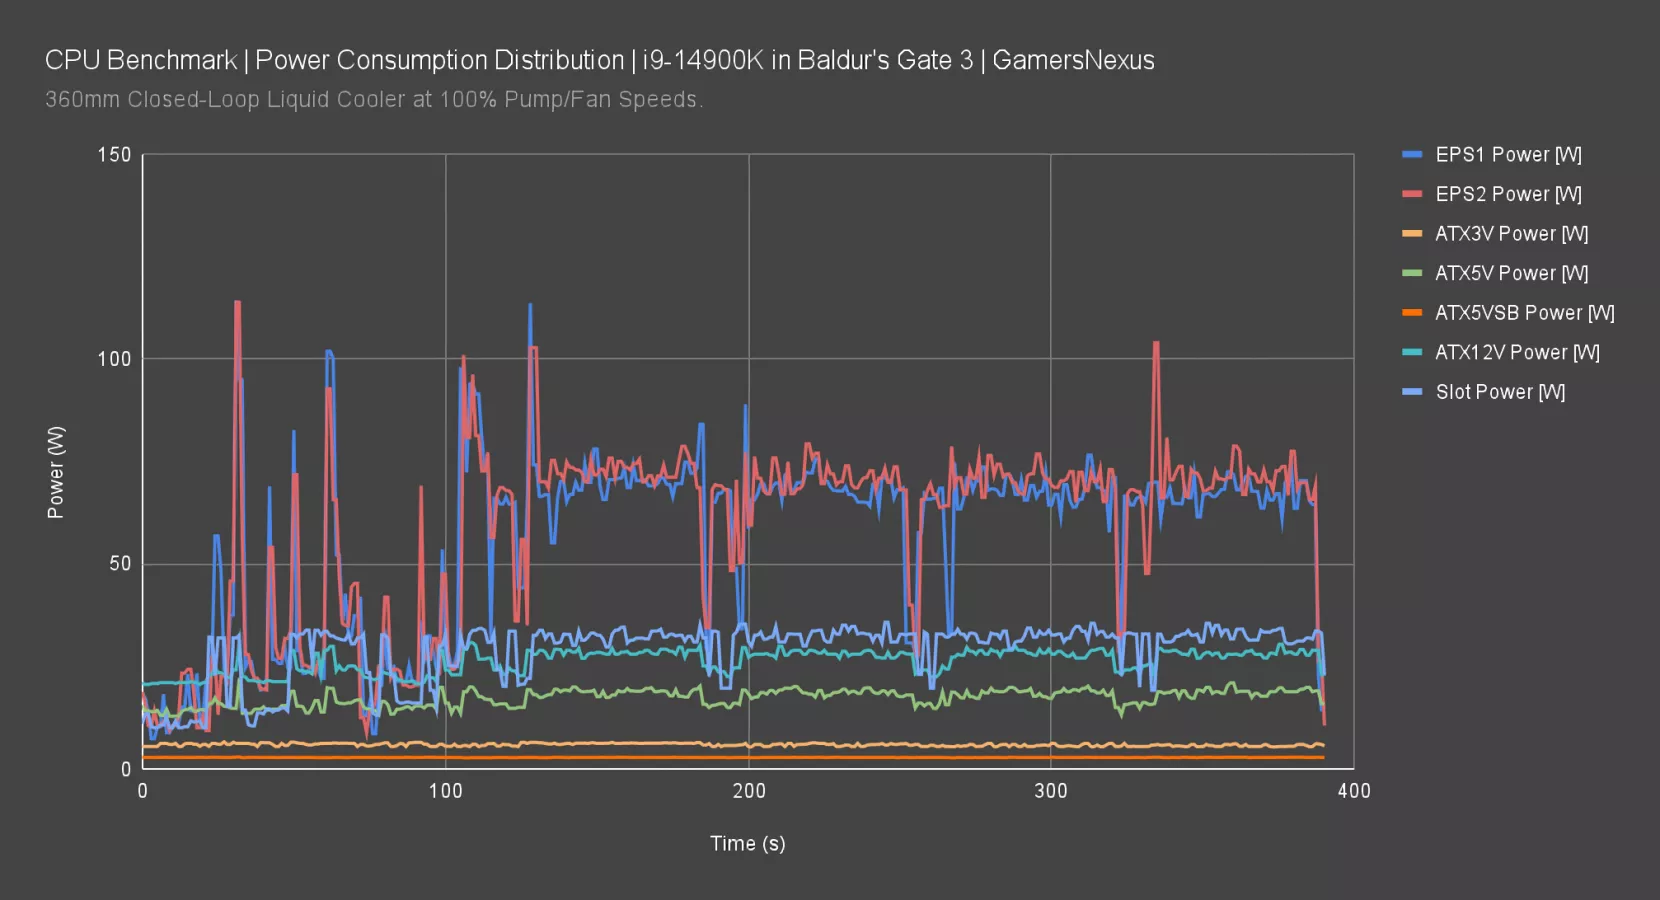
Proving our work: This plot shows the 14900K’s power draw in a known workload spread across multiple rails. You can see that EPS1 and EPS2 power is similar, both at around 70-80W in this lighter weight gaming workload. The 24-pin has several voltages, including 3.3V, 5V, 5VSB, and 12V shown here.
The ATX12V rail includes things like fans, the CPU, and if we hadn’t isolated it, slot power, among other miscellaneous controllers on motherboards.
Slot power is around 30-35W, which is why it’s important to isolate it if capturing 24-pin power.
Slot Power Problems
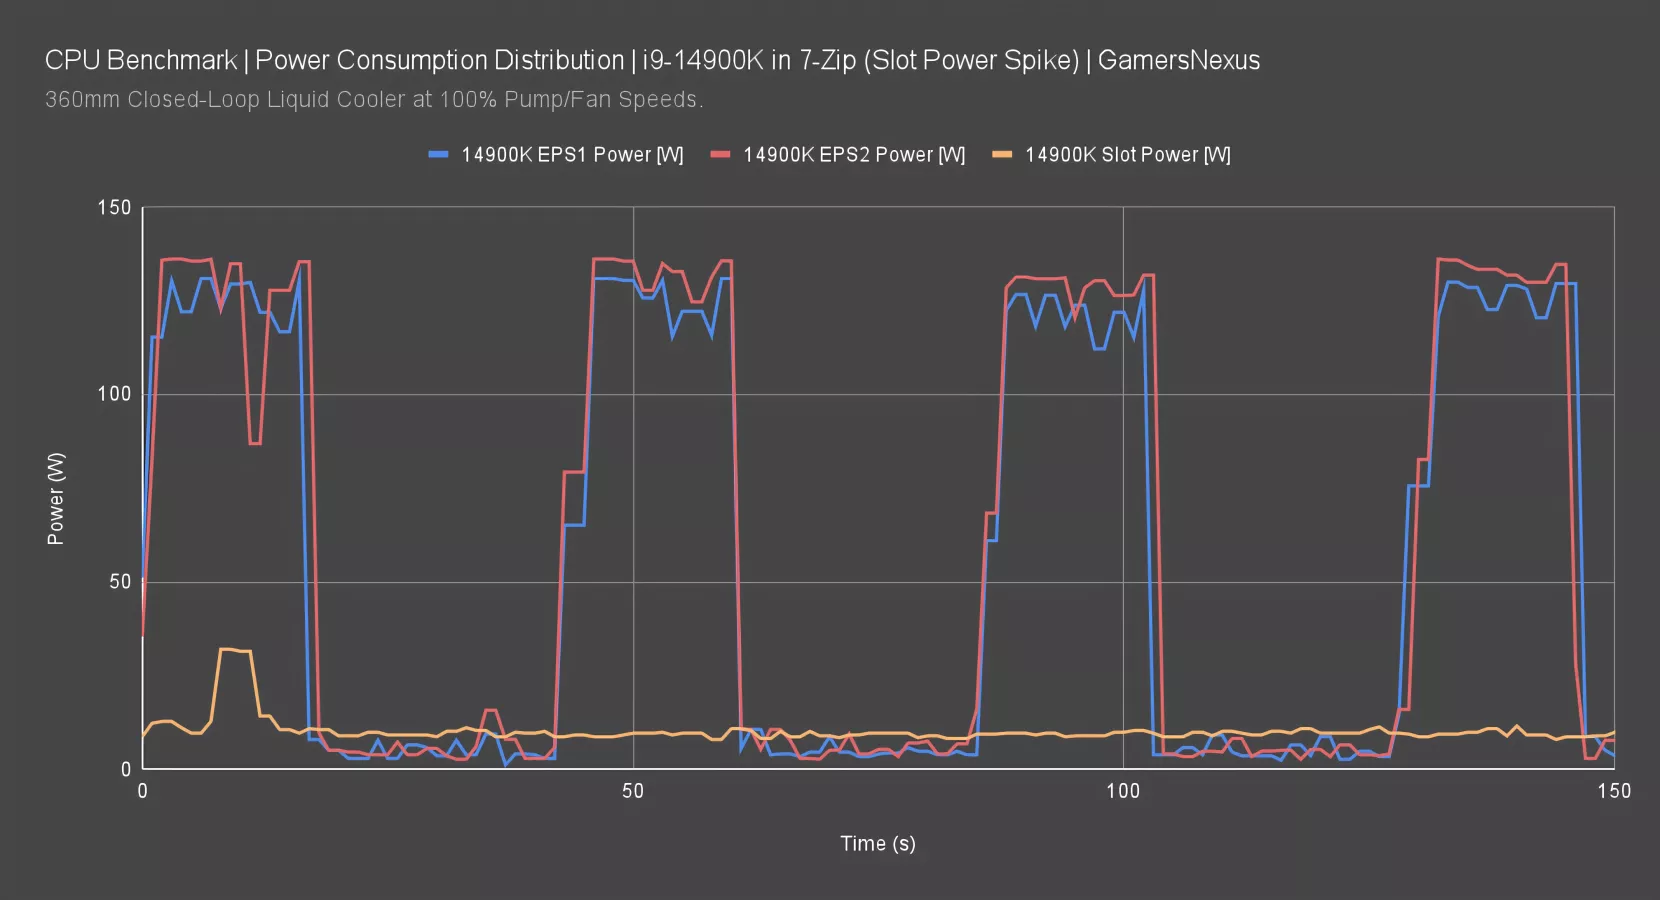
Here’s why we isolate slot power: This benchmark was for 7-Zip on the 14900K. The GPU does literally nothing in this test except spit out the display. It does not engage in the test. However, occasionally in any test, we measure seemingly random spikes to slot power. This could be for a number of unpredictable reasons, including innocuous ones like Windows background tasks or NVIDIA’s drivers doing something in the background, such as telemetry.
24-Pin & EPS12V Power: 14900K vs. 285K
Here’s the comparison we’ve wanted:

In 7-Zip, ignoring EPS12V, we noticed that the ATX12V power was exceptionally high on the 285K and Z890 Hero combination compared to the 14900K and Z790 Hero. It’s at about 50W here, whereas the 14900K had ATX12V down around 30W.
ATX3V power is comparable on both and within 2W. ATX5V power isn’t easy to call a simple average since it fluctuates so much: The range is 14-30W on the 285K+ASUS combination and similar on the 14900K, with peaks about 3-5W lower than the 285K. We don’t know if any of that power is getting used for regulators that might feed the CPU, but if any of it is, it’s not much. A lot of it is driving other components, like I/O.
The ATX12V line is clearly important though, as not factoring-in that 20-30W difference in this test would mean representing the 285K as artificially efficient because the power is sort of “hidden” in a cable where it’s not typically meaningfully high. ASUS’ reasoning for this is theoretically better power regulation. We don’t know if anyone else is doing this.
24-Pin Power: 7800X3D vs. 285K ATX12V
Finally, as an example of AMD, here’s the 7800X3D and 285K.
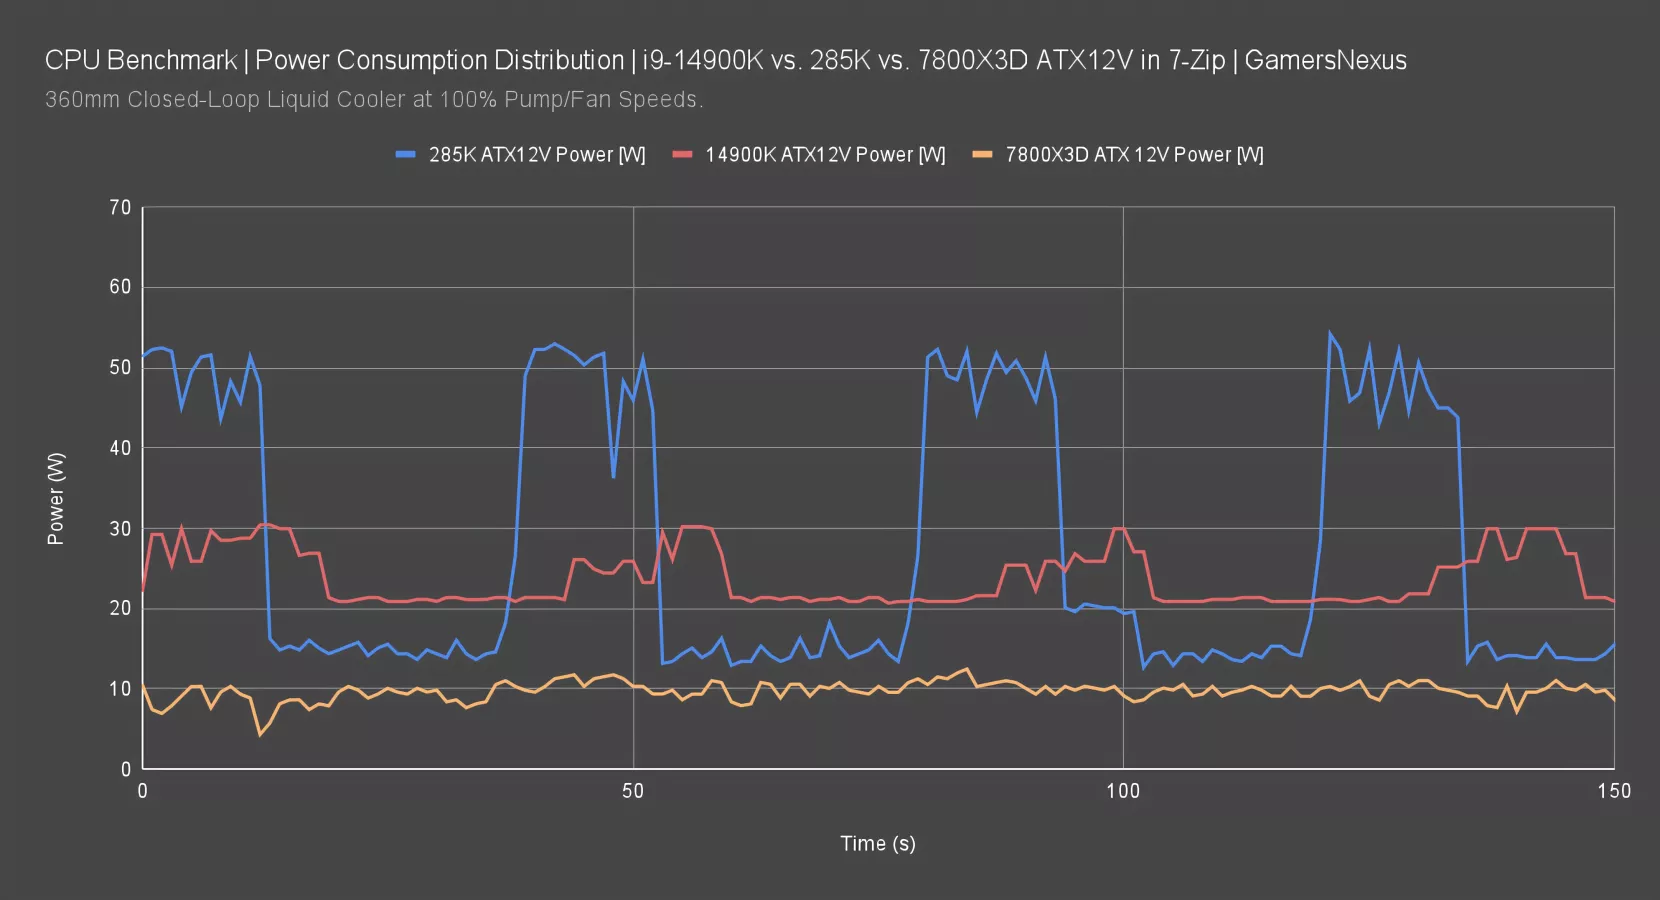
The 285K and 14900K ATX12V remains from last time. The 7800X3D was pulling about 12W ATX12V fixed during this test and didn’t seem to fluctuate based on load at all. It appears fairly isolated. Typically, this gap of 10W comes out in the wash when you’re talking a 280W 14900K versus an 80W 7800X3D, so it’s just part of the usual margins. In this scenario, however, the difference against the 285K really starts to show.
24-Pin Power: 7800X3D vs. 285K ATX3V
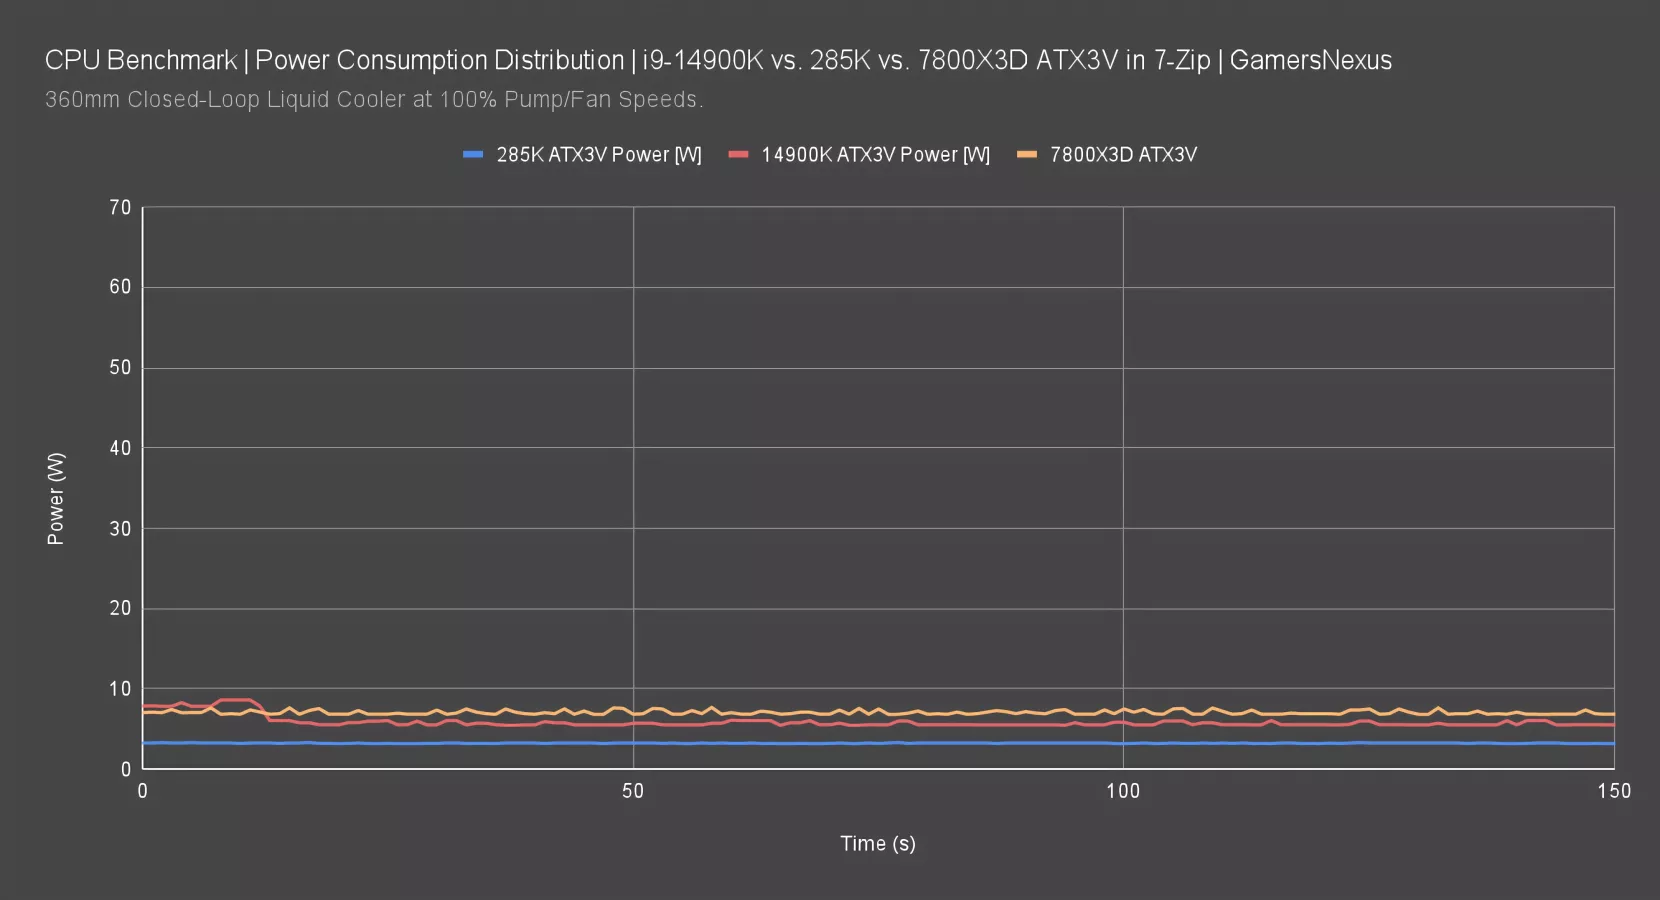
Here’s ATX3V. The 7800X3D platform is marginally higher here -- we’re using an ASUS board for this also. This is part of why 5V normally comes out in the wash: Some rails are a few Watts higher, some a few Watts lower. There is always going to be error.
24-Pin Power: 7800X3D vs. 285K ATX5V

ATX5V is about the same between them all. There is possibly spikier behavior on the 285K from the I/O, but that’s about it.
Software Readings
All this is done with hardware. We also can’t trust various software readings because they can be manipulated heavily by software or motherboards. Years ago, there was an issue where AMD motherboards were underreporting the power in a way that allowed boards to pull more or less power while hiding it in software, thus manipulating the report. We also spoke with Der8auer about his experiences, and he noticed that CPU Package Power is calculated based on VID, so if anything is wrong with voltage, it will manifest in erroneous software readings.
And that leads us back to our monster we’ve built. We are fairly confident in the results, but we have to caveat that this is a very opaque platform currently and it’s not fully clear how all the power is routed. For the most part, it should be proportional to the VRM split of 18:4 of the 22 phases total, so we were able to use that as a guidepost.
Finally: You might be asking “who measures the measurers,” and the answer is... us. Working with Elmor, we hooked up other current monitoring devices in series to monitor the current monitoring devices, and we also clamped the cables to monitor the monitoring of the monitoring devices while monitoring the software of the monitoring-monitoring devices and the CPU-monitoring software monitor.
Once that was all done and we had tested against calibrated Fluke meters with known current loads, we proceeded with the most accurate combination of monitoring.
Let’s get into the efficiency testing.
Efficiency: 7-Zip Decompression

7-Zip decompression efficiency is measured in MIPS/W, or millions of instructions per joule.
In this test, the 285K ended up in the lower-third of the chart. Intel’s 14900K pulled 273W in this test, with the 285K now at 162W for ATX12V and EPS12V without slot power, or 175W with ATX12V, ATX5V, and EPS12V. We think the 162W number is more accurate, but want to transparently present both since the power split is still not fully clear.
Because performance is lower and the formula relies on both, the efficiency increase isn’t as impressive as the power drop. The 285K runs with an efficiency of 1101 MIPS/W decompression with the reading that includes 5V, or an improvement of 29% over the 14900K. The reading without 5V is 40% improved over the 14900K, which we think is the more accurate one. Whether 30% or 40% is closer, the point is that it’s a big uplift. AMD still dominates here, holding the entire top-third of the chart, though. The 7950X in ECO mode sets a seemingly untouchable score at 1936 MIPS/W. The 7800X3D, which is much slower than the 285K in 7-Zip decompression, is more efficient thanks to its 70W power draw.
Efficiency: 7-Zip Compression

Here’s the 7-Zip compression result. Power consumption is measured across compression and decompression in the same test suite, so those figures are unchanged.
The 285K scored 1051 MIPS/W with ATX12V and EPS12V, an improvement over the 14900K’s 672 MIPS/W of 56%. This uplift versus decompression comes from the higher performance in 7-Zip compression relative to its scaling in decompression.
AMD’s 7800X3D is at the top here. Again, it’s not the best performer, but its 70W power is impressive and allows it to remain the true most-efficient CPU we’ve tested lately.
Efficiency: Baldur’s Gate 3

Baldur’s Gate 3 could get more complicated, but we’ve isolated out the PCIe slot power by using an interposer to power the video card instead.
The entire X3D lineup continues its domination in this game, and most others. The high framerate and low power land the 7800X3D at 2.3 FPS/W, as it’s pulling only 55W during this gaming workload. The 5700X3D is about the same, with the 5800X3D (watch our review) slightly less efficient. Intel’s new 285K isn’t remotely close to these numbers.
The 285K with ATX12V and EPS12V ran at 1.1 FPS/W, so the 7800X3D is creating over 2x as many frames per Watt of power. The 14900K ran at 0.7 FPS/W here. Looking at just Intel, the 1.1 result of the 285K has at least improved substantially over the 14900K, with an uplift of 57%; if we include the 5V power, since we’re not certain if any of it is being used for the CPU, that would be a 29% uplift.
Efficiency: Starfield

Starfield is a heavier workload from gaming.
In this one, the 7800X3D is again the most efficient. Its result was 2.1 FPS/W, holding a large lead over the next closest CPUs. The next closest CPU is the 5700X3D, also at about 70W. The 5800X3D, 9700X, and 7700 non-X follow this. We eventually hit the 3700X (read our revisit), then the 285K.
With the ATX12V and EPS12V measurements and without PCIe slot, we end up at about 147W for a 1.0 FPS/W rating with the usual rounding.
The 14900K ran at 0.7 FPS/W here, so Intel has improved by 43%. Its Ultra 9 is now about where the 14600K was previously. Measuring 5V as well had it at 172W, or 0.8 FPS/W. That would instead be an improvement of 14%. As before, we believe the 1.0 figure is closer to reality, but it likely falls in between.
Efficiency: Stellaris

The next game is Stellaris, where we measured simulation time in seconds and power. In order to make this as easy to follow as possible, we’ve done some simple arithmetic to convert this into “simulations per watt-hour,” meaning that a bigger number is better despite the base metric result being lower-is-better.
The 7800X3D has an impressive score here, at 2.7 simulations per watt-hour. The next closest is down at 2.4 with the 5700X3D (read our review).
The 285K ran 1.5 simulations per Watt-hour. That means for each watt-hour, the 7800X3D is able to complete 1.2 more simulations, or about an 80% increase.
The 14900K completed 0.9 simulations per Watt-hour. That means the 285K’s best entry is an improvement of 67% in efficiency. Remember: Most of Intel’s presented numbers were only for power reductions, not necessarily for efficiency. The 285K’s simulation performance is better than the 14900K’s in this benchmark, so its combination of higher performance and lower power (which was reduced by 46.6W from the 14900K) yields this huge increase in efficiency.
Efficiency: Final Fantasy XIV

Finally, Final Fantasy 14 for efficiency. In this one, the 7800X3D led with an impressive 42.5W power draw while spewing hundreds of frames per second, allowing it a result of 8.3 FPS/W. That’s great. The 5700X3D keeps its second-place spot at 7.7. The 14900K ran at 3.1 FPS/W, so the 285K is 32% improved by these numbers. This is one where the 285K was regressive in performance against the 14900K -- and by sort of a lot, but we’ll come back to that. The result is reduced efficiency gains.
Frequency Testing
Single-Core Frequency Comparison (14900K vs. 285K)
Next, we’ll validate the frequency behavior to establish how the CPUs behave out of the box.
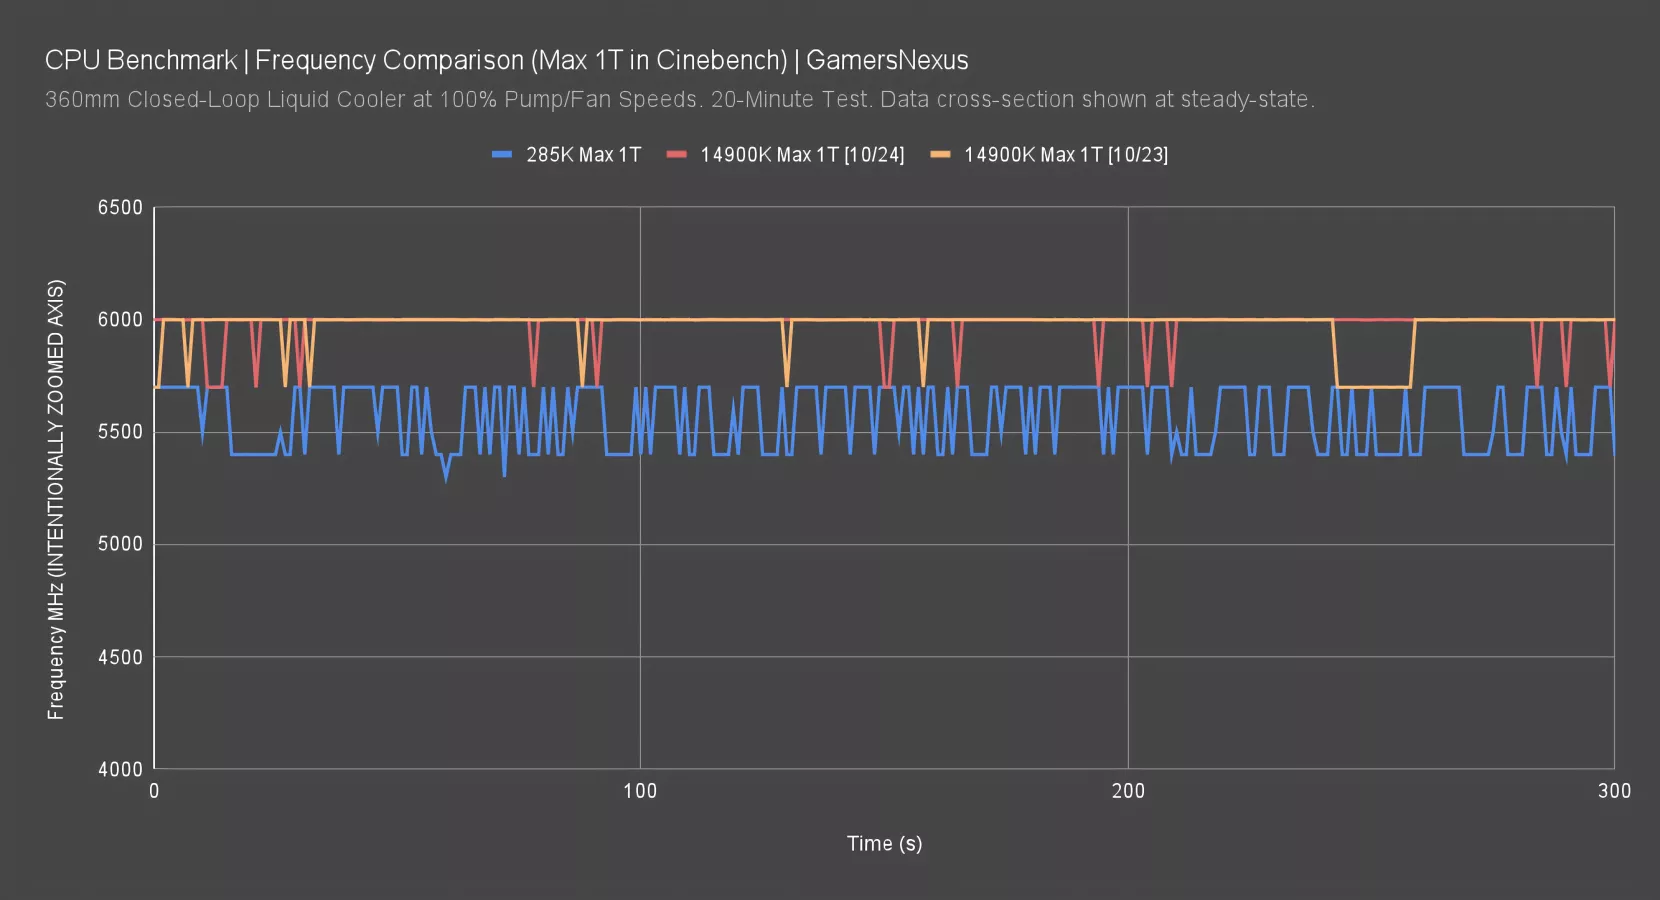
This chart plots the highest single core frequency per interval during a single-threaded Cinebench workload.
With the 285K, the max single-core frequency is 5700MHz during testing, with frequent drops to 5400MHz. These drops are abnormal on Intel during this test.
The 14900K with the latest microcode held 6000MHz. These are different architectures, so it’s not as simple as stating that higher is better; however, it helps at least illustrate where some of the performance losses are coming from.
The original launch microcode had it at the same frequency.
P-Core Frequency Comparison

This chart looks at P-core frequency averages during a Blender workload.
The 285K maintains an average P-core frequency of 5400MHz in this testing. It’s relatively flat. That has it higher than the 2024 ASUS test entry, which is what we used for our review comparison today, at around 5100-5220MHz. The 2023 launch entry was higher, at 5280-5400MHz on average. The microcode changes may have affected this since launch. The MSI 0x11D microcode entry had the CPU at around 5000MHz from the same window as the ASUS 2023 entry. The most up-to-date frequency entry sits between the two flanks of early 14900K tests.
All-Core Frequency Comparison
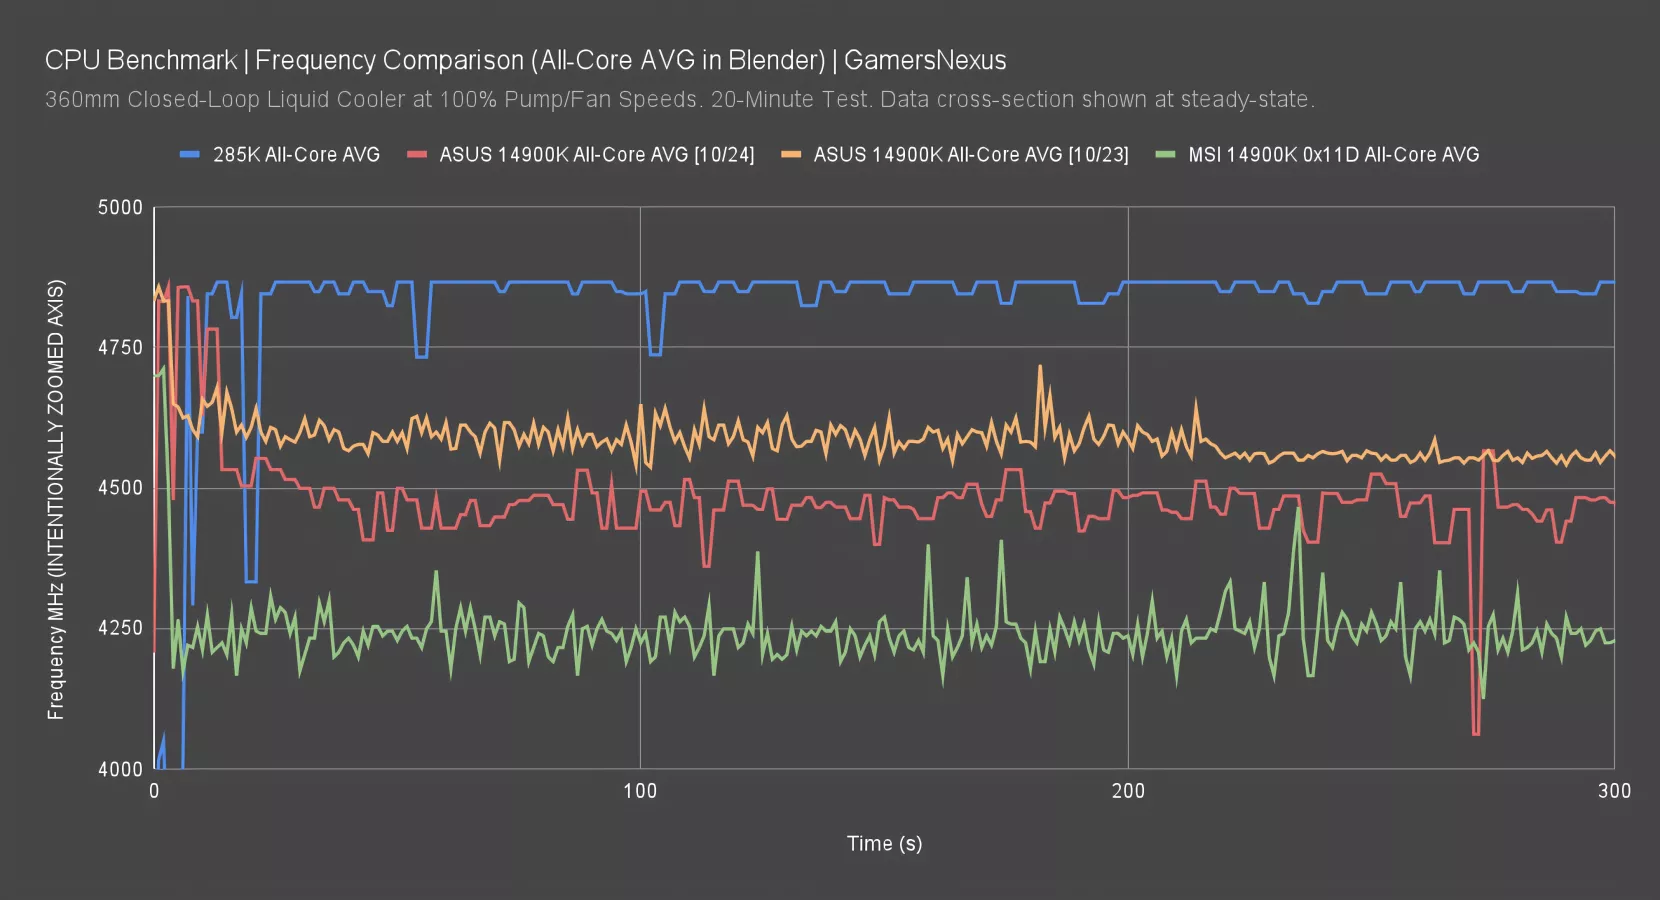
Finally, this chart shows the all-core averages in the same test. The 285K averaged 4867MHz when factoring-in the E-cores, with the modern 14900K just below 4500MHz and flanked by the two older entries.
Intel Core Ultra 9 285K Gaming Benchmarks
Now we’re going to get into gaming benchmarks. We have a lot of 2023 and 2024 games in our test suite along with mainstays from the past.
Dragon’s Dogma 2

Dragon’s Dogma 2 is up now. This is one of the 2024 titles we added to our suite last time. It’s had updates that affect performance since our last round of benchmarks. APO doesn’t do anything in this benchmark and isn’t supported. We tested with it on and off for both the 14900K and 285K and its performance was the same, so we removed the redundant entries here since they have no impact.
The 285K landed at about 104 FPS AVG, with lows at 64 FPS and 51 FPS.
This allows the AMD 7800X3D at $480 to lead the $590 285K by 6.1%, with the 14900K at 5% ahead. The lows between these 3 CPUs are functionally identical. The 14700K and 13700K also lead the 285K here, with the 14700K (read our review) far cheaper at $350. The 5700X3D and 5600X3D (read our review) are effectively tied, with the 5700X3D at $230, or sometimes down closer to $200.
F1 24 - 1080p

In F1 24, which, for hopefully obvious reasons, is a 2024 title, we end up with this set of results when fully retested in 24H2 and with new microcode and AGESA.
The 7800X3D sets a high ceiling and establishes a 28% lead over the more expensive and higher power-consuming 285K, at 438 FPS to 344 FPS AVG. The 14900K is also advantaged, this time by 12% with a 385 FPS result. The lows for the 285K were 186 FPS 1%, which is a worse entry than the 14900K’s 250 result. The frametime pacing appears better, in-step with the average, on both the 14900K and 7800X3D.
Looking now at the APO results, toggling APO does appear to do something in this game: The 285K gained 1.3% with APO on. How very exciting -- we can hardly contain ourselves. You’ll surely notice the extra 3-4 frames per second on top of the other 343 before them. We’re so glad we spent half a day troubleshooting Intel’s fumbled pre-launch settings to gain those frames back... Whatever would we have done without the extra 0.0369 ms reduction in frame time?...
The 14900K also gained about the same amount. It’s irrelevant on both.
Using DDR5-8600 on the 285K with Gear 2 and blasted VDIMM boosted it to 359 FPS AVG, a 4.5% like-for-like lead over the 344 result. This is almost enough to get the 285K tied with the two-generation-old 13700K (watch our review) from 2022, but not quite. It does, however, tie it with the AMD’s 2020 architecture found in the cache-bolstered 5700X3D with its lower power.
F1 24 - 1440p
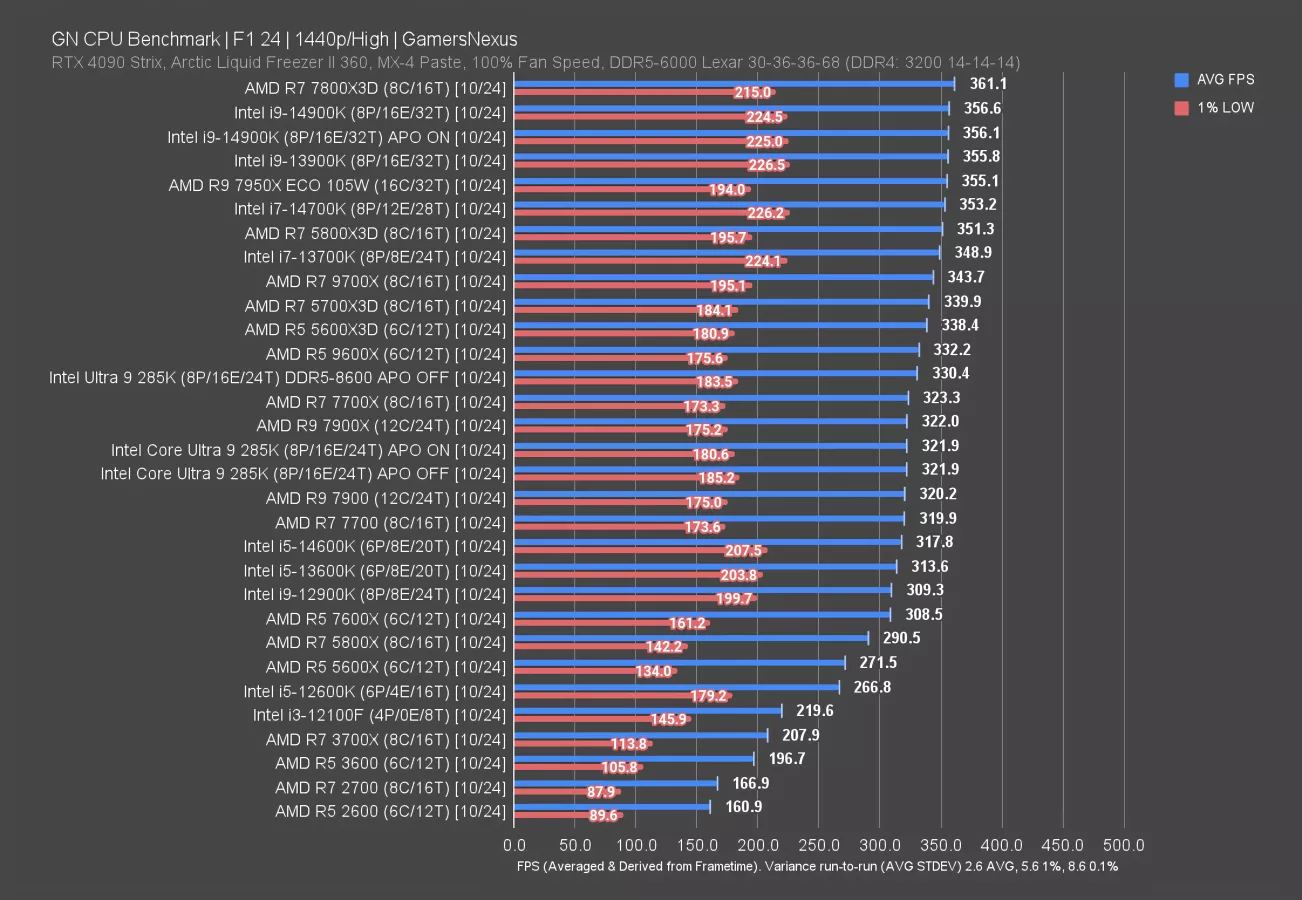
1440p results are mostly uninteresting: The top is truncated heavily by the increase in resolution. Even still, the new Ultra 9 ends up in the middle. It’s fitting that the Core Ultra 9 is in the middle of a cluster.
FFXIV Dawntrail - 1080p

Final Fantasy 14: Dawntrail is up now. This is another 2024 addition to our testing.
The 7800X3D again establishes the ceiling. It leads the 285K by 31% in this game, at 353 FPS to 270 FPS AVG. The 14900K’s 310 FPS AVG establishes a 15% lead over the 285K, marking one of the largest declines of Intel’s performance in our gaming suite.
The 5800X3D and 5600X3D are also at the top here, showing that Dawntrail just generally really likes cache, at least on these CPUs. The 5700X3D is a little lower down since its frequency is 300MHz below that of the 5600X3D, so these results make sense.
The 285K ends up below the 14700K and 13700K, with APO doing nothing on the 285K. It’s within error. Final Fantasy 14 is officially supported by APO though and is on the games list, and we do see a slight uplift on the 14900K of 1%, basically error. Switching to DDR5-8600 on the 285K provided an uplift of 4%, with it still below the 13700K after that. Of course, the same memory treatment would lift others up also.
FFXIV Dawntrail - 1440p

At 1440p, the limited ceiling is shuffling the stack as a result of the framerate bouncing off of other limits. We saw a 1.9% uplift from APO on the 14900K. The 285K, again, did not benefit from APO, with both entries at 255 FPS AVG +/- 1FPS.
Baldur’s Gate 3

Baldur’s Gate 3 is up now, a 2023 title that we added to our permanent suite this year. We test in Act III in a densely populated city area for a heavy CPU load.
The 7800X3D establishes a 26% lead over the 285K, at 126 FPS to 100 FPS AVG. The 14900K leads the 285K by 4.5%, at about 105 FPS AVG.
The 5800X3D, 5700X3D, and 5600X3D also lead the 285K, as do the 13900K, 13700K and 14700K.
Toggling APO did nothing here and was within variance for both the 14900K and 285K. Swapping to DDR5-8600 memory boosted the 285K by 7.6%, allowing it to pass everything except the X3D CPUs (this also perfectly aligns with why X3D does so well here). Of course, shoving better memory into the 14900K or 9000-series AMD CPUs would also boost them fairly proportionally.
Stellaris Simulation Time
Stellaris is up next.
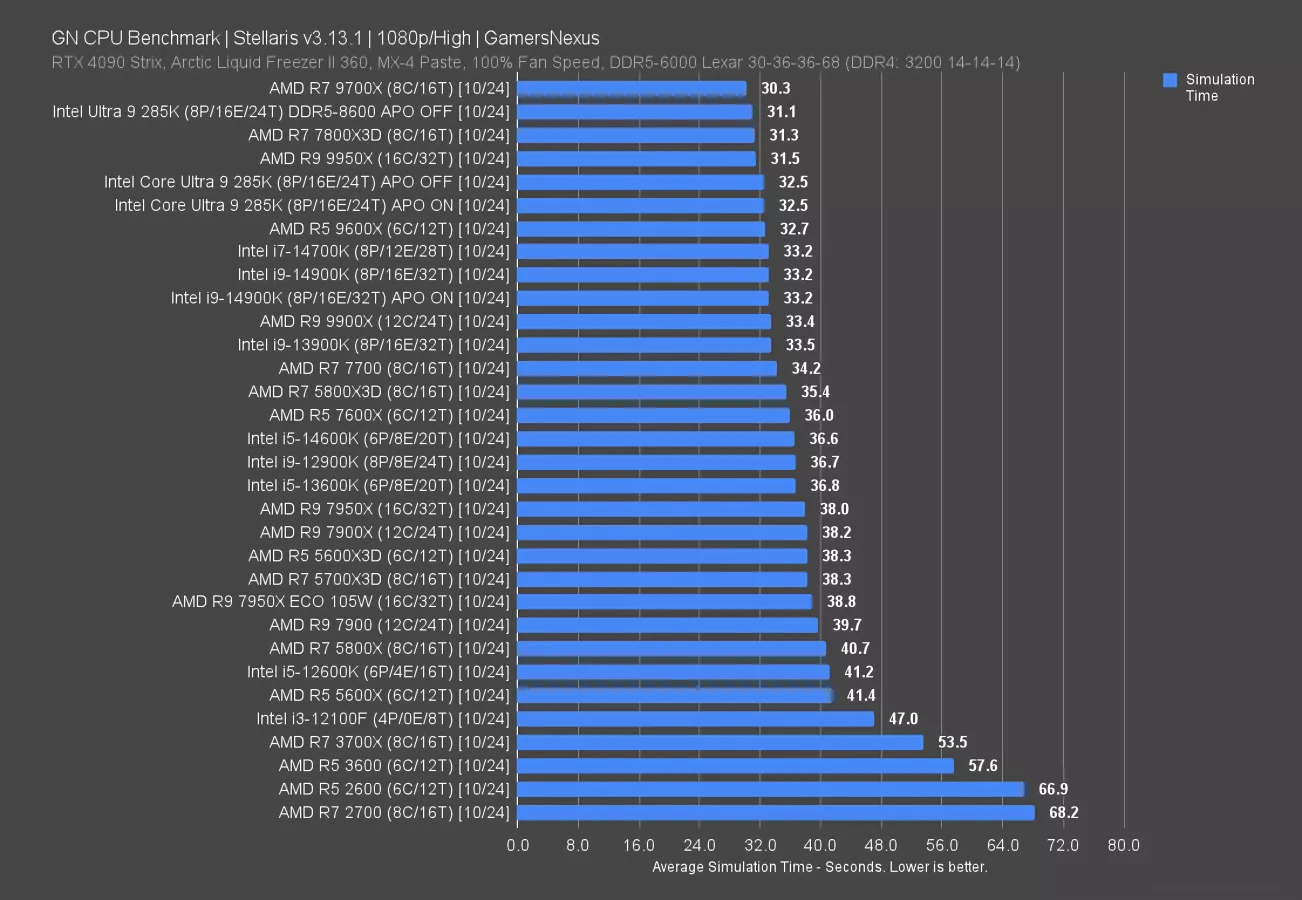
APO has no impact on this game.
The 285K required 32.5 seconds for the simulation, finally putting it ahead of the 14900K. The 285K requires about 1-2% less time than the 14700K and 14900K CPUs.
The 7800X3D outranks the 285K again and requires about 3.7% less time for the work. The 9700X remains the fastest here, which is consistent with our last round of data.
Boosting memory helps in this game, so the 285K benefited from a 4.3% reduction in time to complete the simulation.
Rainbow Six Siege
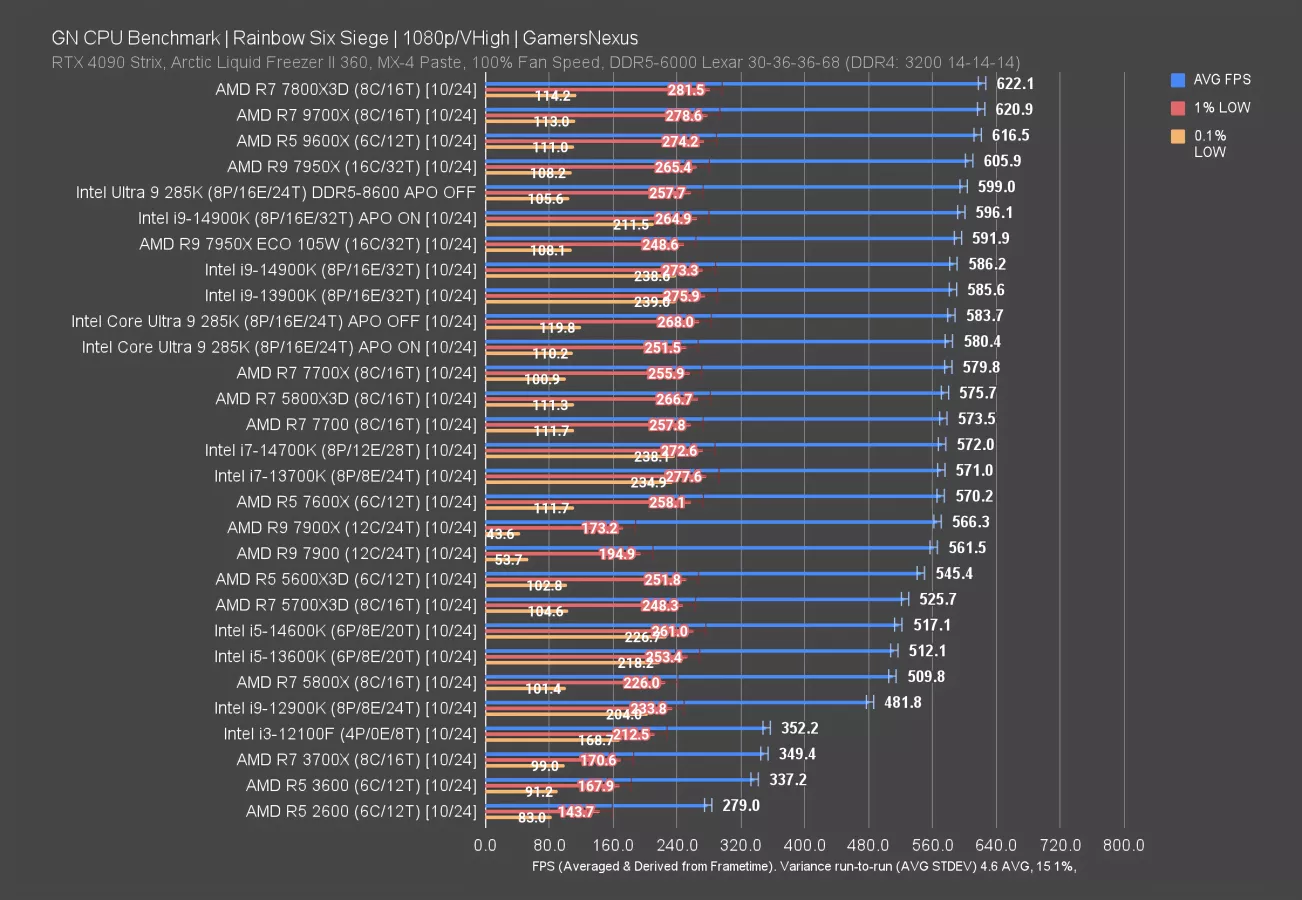
Rainbow Six Siege is up. In this one, the 7800X3D leads by a much smaller amount, at only 6.6% for 622 vs. 584 FPS AVG when APO is in its default off position that this board shipped in. The 14900K was tied. Enabling APO did nothing on the 285K. The result was within error when considering we’re almost at 600 FPS. Enabling it boosted the 14900K by 1.7%, and this is with Intel’s sh*tty Microsoft Store App confirming that it’s enabled for both CPUs. This boost is reduced for the 14900K versus APO’s launch because Rainbow Six has updated the code that was causing problems.
Going to DDR5-8600 increased performance over the 584 result by 2.6%.
The 285K is at least better than the 14700K in this one, with an uplift of 2%. It’s also about 1.8% ahead of the 7700 non-X, which has been $280-$290 lately when you can still find it.
As a general note, this game has some serious 0.1% low consistency issues. We noticed that the 12-14 Series CPUs have significantly higher 0.1% lows than AMD’s options and than the 285K alike. It’s easier to look at a frametime plot.
Rainbow Six Siege Frametimes

Here it is. Because Intel noted that Rainbow Six had specifically tuned to reduce reliance on APO, and because of the low advantage of Alder Lake onward, we’re assuming that Rainbow Six Siege has specific and manual tuning for the Alder Lake architecture and its more recent derivatives.
This frametime plot shows the 14900K is overall highly consistent frame-to-frame, with most of the intervals deviating at most by 2ms. There are a few spikes, but only one notable spike to 6ms -- which is a 4ms deviation, and thus wouldn’t be noticed by the vast majority of users.
Adding the 285K, we see several spikes to 10-11ms. By themselves, these frametimes aren’t bad. 60 FPS would be 16.667ms, so this isn’t a huge stall. But it is a big change from Raptor Lake and is objectively worse.
Starfield

In Starfield, another 2023 game, the 7800X3D maintains a 2% advantage over the 285K, at 145.4 to 142.5 FPS AVG. We’re bound elsewhere -- and that elsewhere is obvious: The DDR5-8600 result jumps to the top of the chart, illustrating that at least some of our limit is memory. As a reminder, applying the memory tuning treatment to everything would boost all numbers, so looking at baseline will give you an idea for their headroom.
The 14900K actually falls behind for once, at a slight loss to the 285K. We think this corresponds with the cache changes, based on the memory performance we just saw.
APO, once again, does nothing between the two main 285K entries.
Total Warhammer 3

Total War: Warhammer 3 is up now. The 7800X3D led the 285K by 7.2%, with the 14900K leading by 2.8%. Total Warhammer 3 is on the APO list, so it’s supported. On the 14900K, we saw an uplift of about 1.2%. On the 285K, we measured an improvement of 0.6% -- basically error.
Lows in this game have been historically awful on Intel’s i9 CPUs, which we previously proved is due to scheduling challenges with the thread count. The 285K at least seems to somewhat improve here, possibly by the reduction in threads.
Intel Core Ultra 9 285K Production Benchmarks
We’re getting into production benchmarks now.
Blender
Blender is up first. We’ve updated it, so it’s not comparable to prior results.
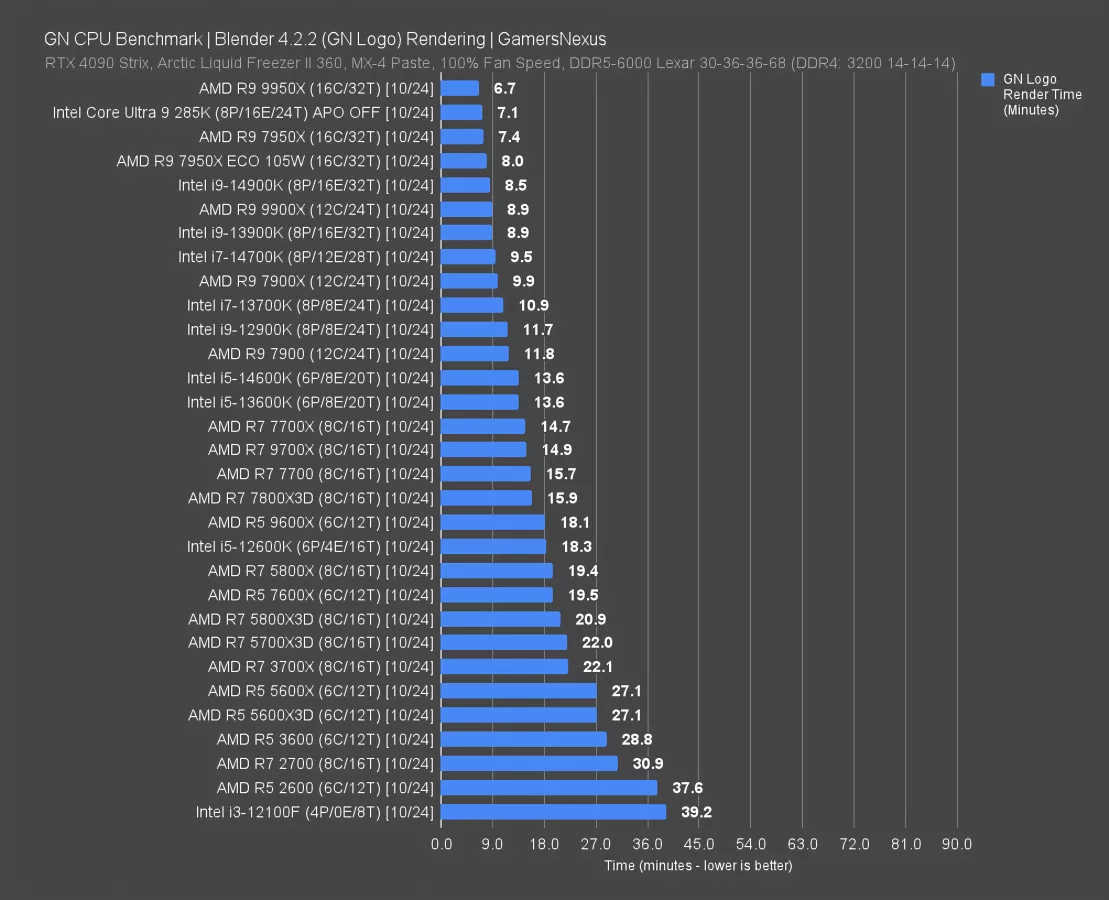
The 285K is our second-highest performer on the charts for desktop-class CPUs. The 9950X (read our review) benefits from a render time requirement reduction of 5.6%, while the 285K reduces render time from the 14900K by 16.5%. That’s finally some uplift.
These types of tests are also where AMD’s 7800X3D and 5800X3D show their limits as 8-core CPUs, both falling far down the charts. That’s a known quantity. If you’re only gaming, they make the most sense. If you mix in a good amount of heavily threaded software for work, it may make sense to buy something else on this list.
7-Zip Compression
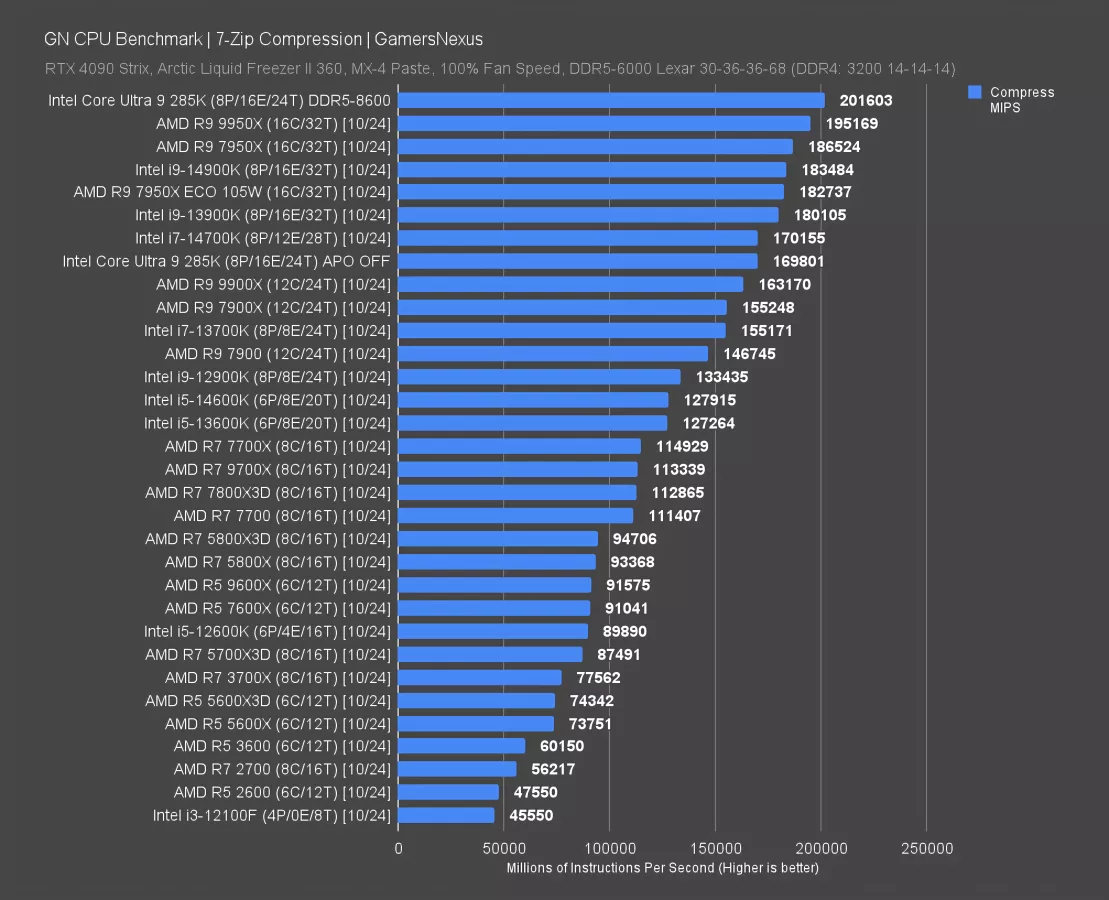
In file compression with 7-Zip, the 285K completed 170K MIPS and roughly tied the i7-14700K. The 14900K holds an advantage of 8%. The 9950X and 7950X (watch our review) outperform the 285K significantly, with the 9900X just behind. Memory seemed to really help in this test, pushing the 285K up by a gargantuan 18.7%. That’s a huge uplift.
7-Zip Decompression
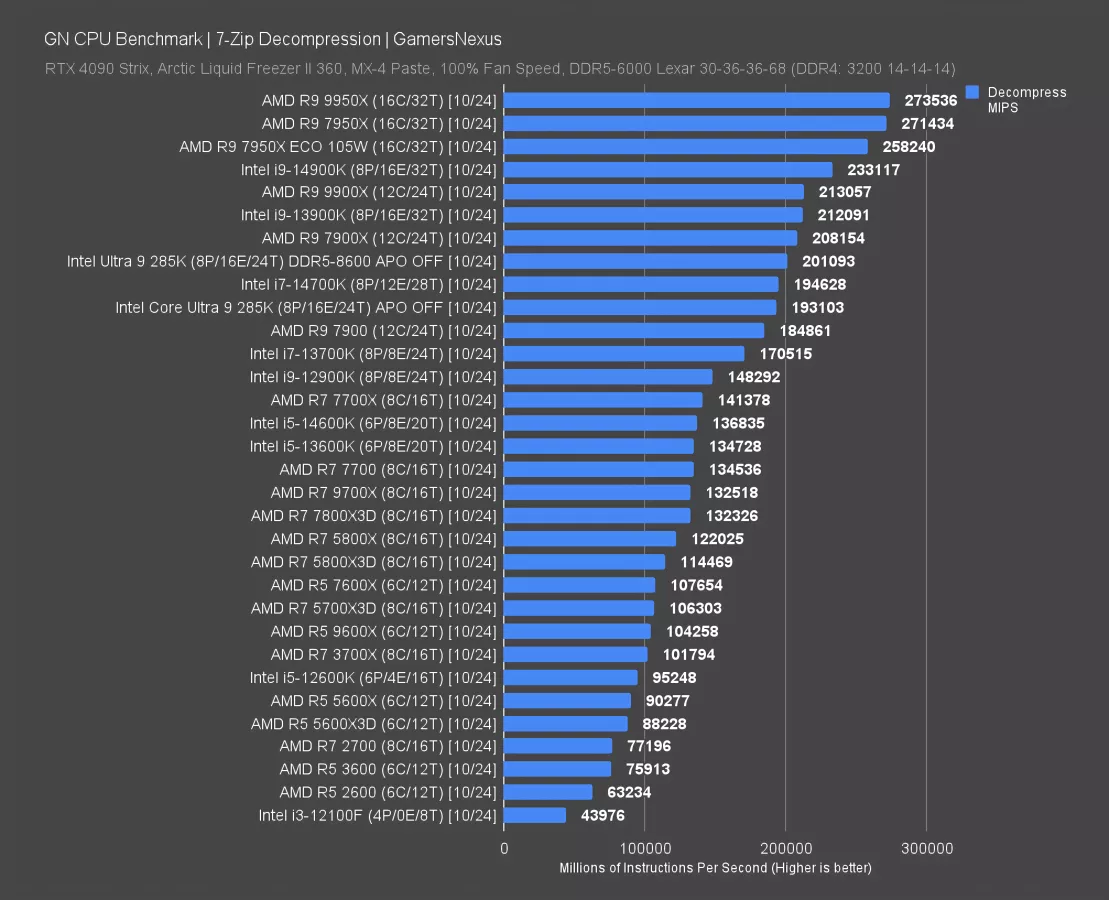
Decompression doesn’t benefit as much, posting a 4% improvement. The stack also shuffles, with the 9900X and 7900X both surpassing the 285K here. The memory subsystem benefits don’t translate as much as they did in compression, both stock and with the better RAM.
The 14900K leads the 285K by a staggering 21% in this benchmark, benefitting from its extra threads. The 9950X establishes an impressive ceiling, at 42% ahead of the 285K.
Chromium Compile
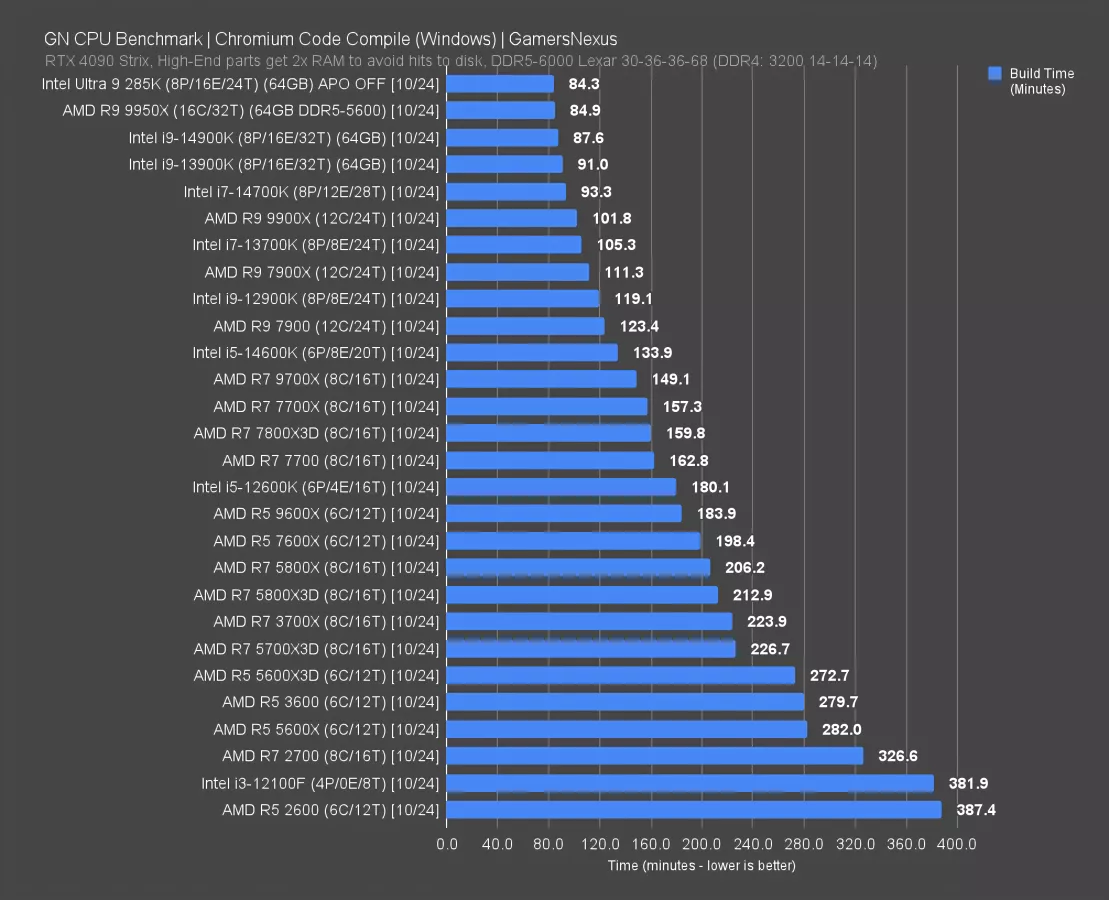
Next is our Chromium code compile test. For this test, we double the RAM capacity on some CPUs when they page-out or otherwise fail to complete the compile. This only occurs with the highest-performing few CPUs. This test has been updated since last round, so load on CPUs has slightly changed.
In the situation of the 9950X, there is one disclaimer here, we were not able to get it stable at DDR5-6000 with 64GB when running our usual tighter timings. We experimented briefly with reducing the timings, higher voltages, and altered infinity fabric, but ultimately had to call it for now and run it at DDR5-5600 to accommodate 64GB. That makes the 9950X an imperfect comparison. With that limitation disclosed due to stability issues, the 9950X and 285K are roughly equal. That may change if we can rerun the 9950X and find stability.
For direct comparisons, the 285K leads the 14900K by only about a 3-minute time reduction or a total compile time requirement reduction of 3.8%. As usual, the 8-core X3D parts are lower down the stack, like the 7800X3D and 5800X3D.
Adobe Premiere
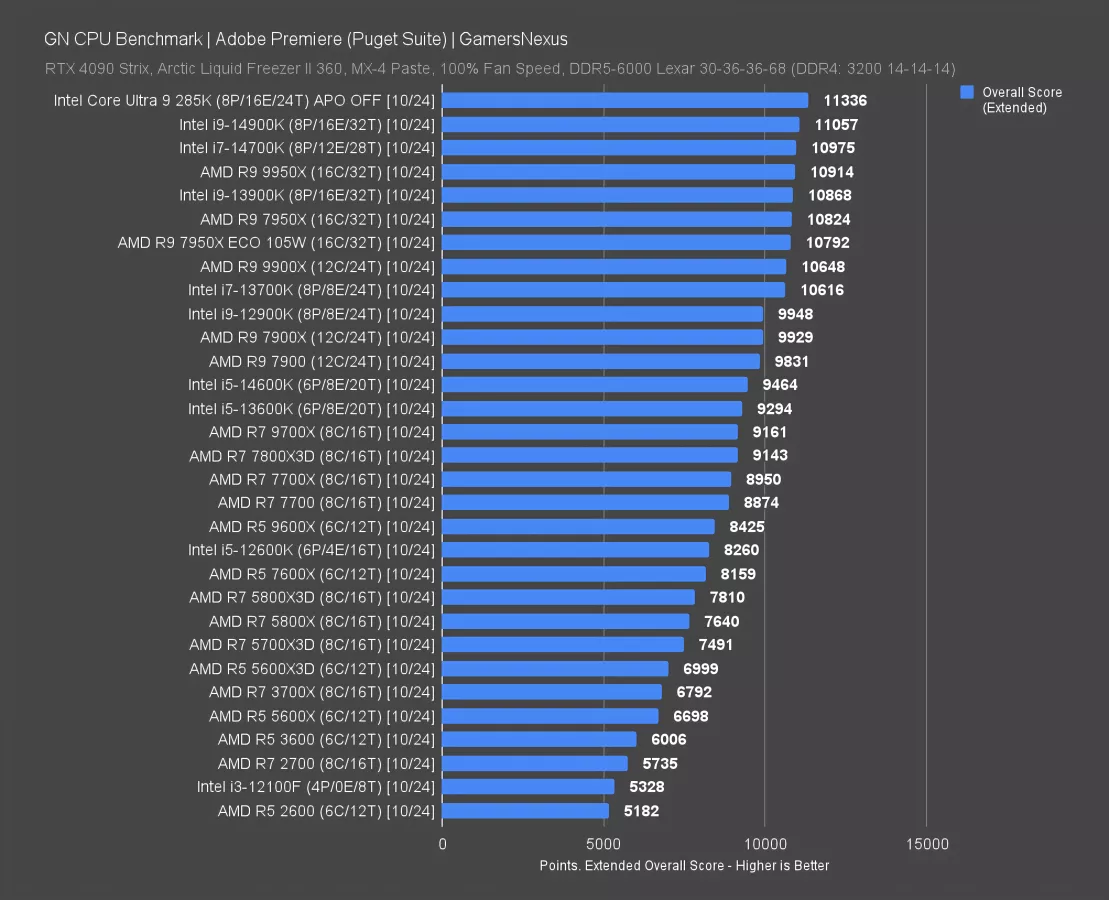
Now for the Adobe software, tested with the Puget Suite.
Premiere has the 285K as the new chart-topper, at 11,336 points. That’s how this whole review should have been, especially with a power reduction. Unfortunately, it wasn’t this way.
The lead over the 14900K is small, at 2.5% uplift in aggregate. The 9950X is AMD’s top CPU here, at 10,914 points. The 285K has a 3.9% lead.
Adobe Photoshop

In Adobe Photoshop, AMD has a clean sweep of the entire top half of the charts. Those of you who’ve been watching us for at least 5 years will remember an era where it was the opposite. The first Intel entry doesn’t appear until below the 7600X, and that’s the 14900K.
The 9950X leads the 285K by 22% here and the 14900K leads it by 3.5%.
Intel Core Ultra 9 285K Conclusion

Simplifying all of this, our current conclusion is this:
The 285K does not have a particularly strong place in any one market.
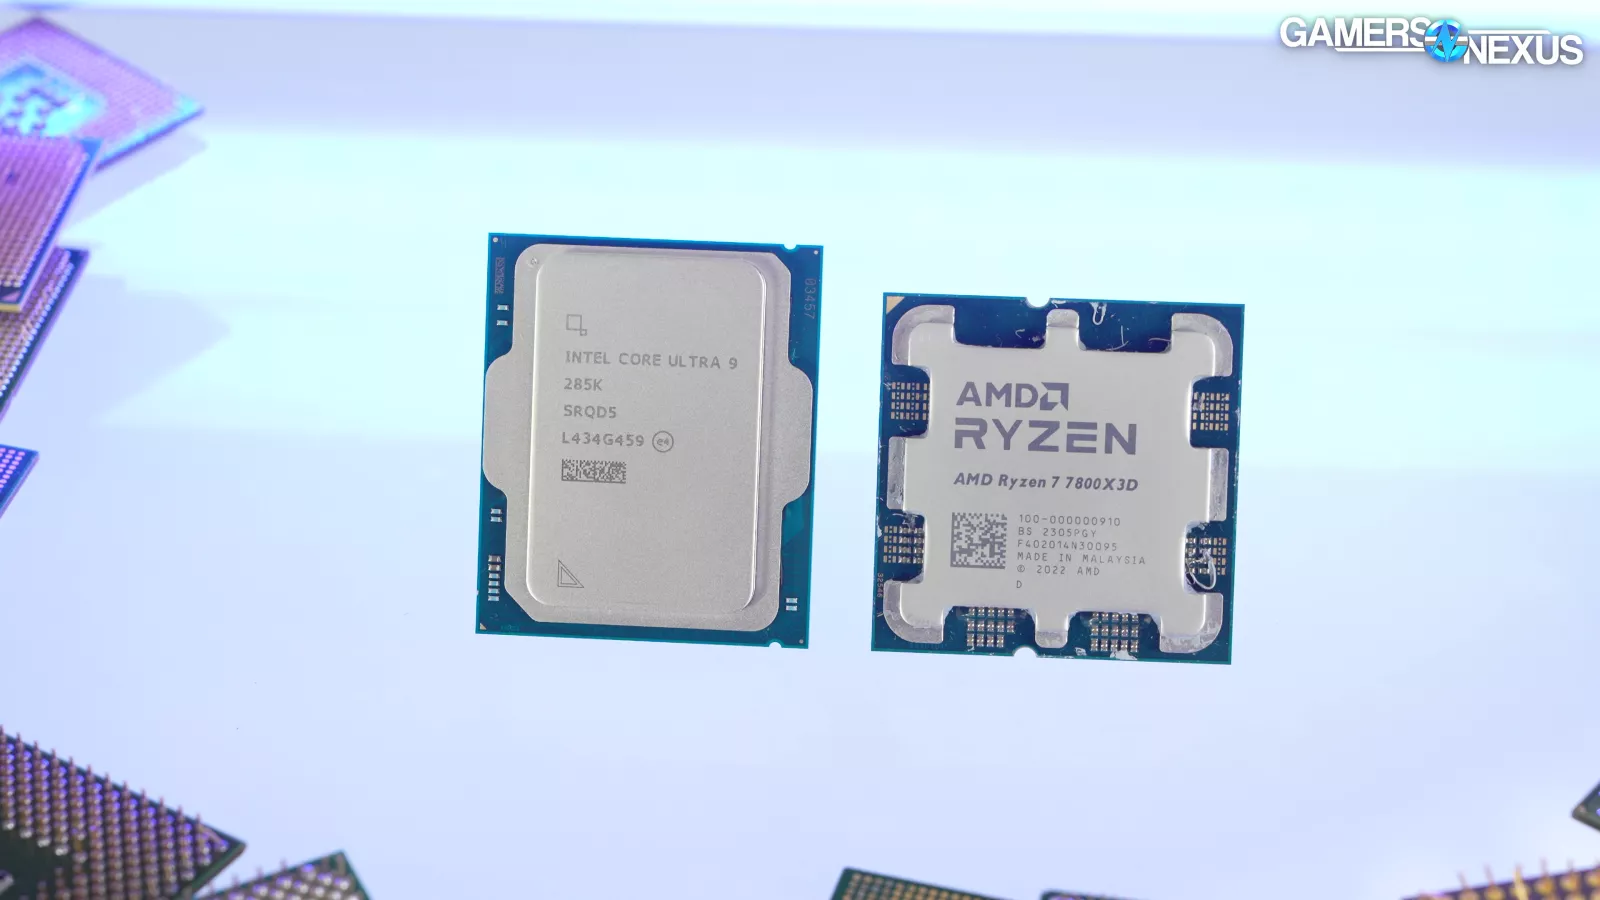
The 7800X3D is far superior in both gaming and efficiency. The 285K can hardly make sense against even the 5700X3D, and AMD’s 9800X3D is days away at this point. For non-gaming, the CPU is more interesting but we still don’t think it is broadly justifiable at the current CPU and platform costs.
Even Intel’s prior-gen parts are far cheaper right now, like the 13700K and 14700K, which theoretically have been fixed with microcode. If you were to argue that the inefficiency of the prior gen parts counters some of the savings in the form of lower power, it’s just not a strong argument. The 14700K is $350 now, so it’s $280 cheaper than a 285K.
Power Value - Cheap Power
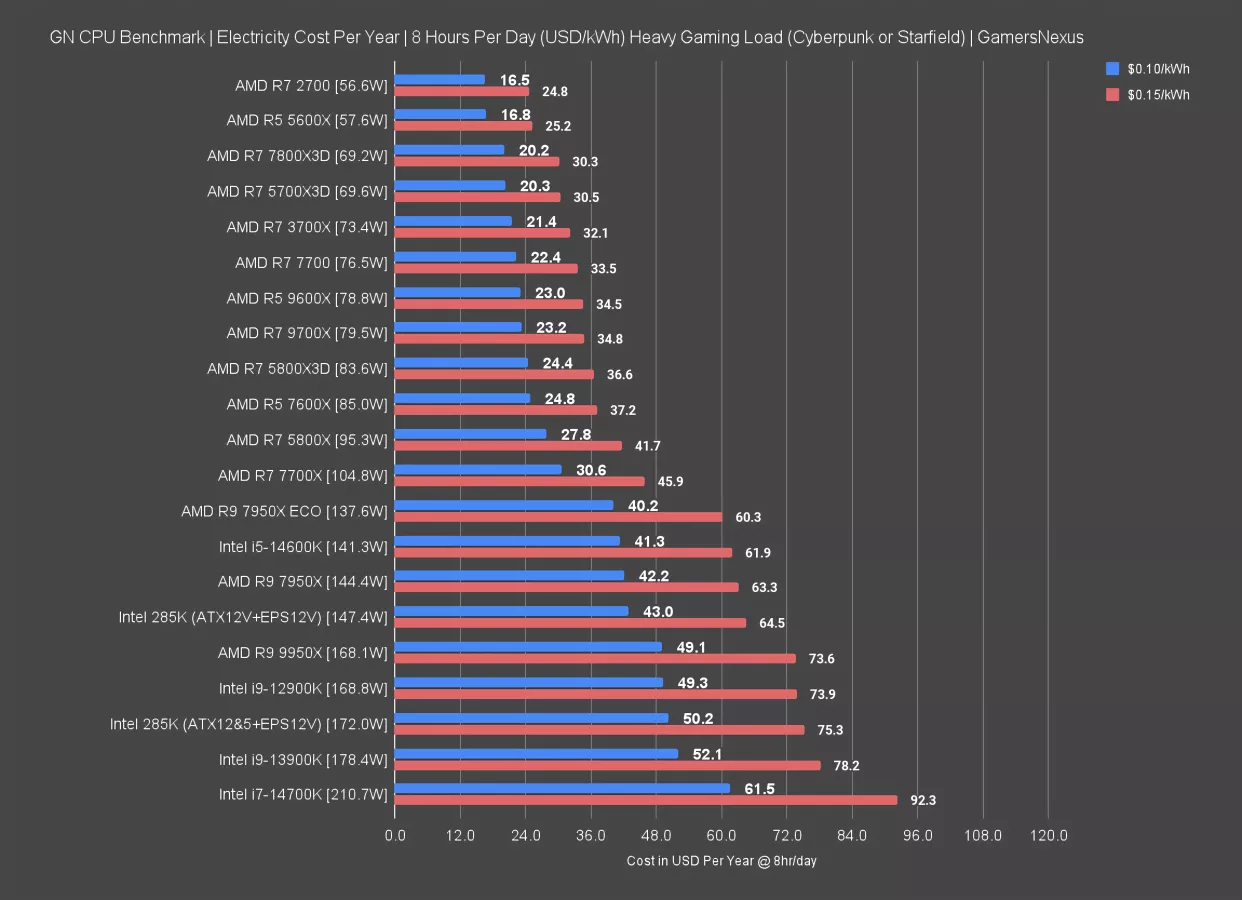
If your power costs $0.10/kWh like ours, then you’d need to play the highest CPU load games for 8 hours a day for an entire year in order to gain $19 of value in power bill reductions for the 285K against the 14700K. At $0.15, the shut-in gaming levels would give the 285K a savings of $30 over one year of literally playing Starfield or Cyberpunk as a full-time job. At the peak of degeneracy that we all strive to achieve, you’d have to play games at this pace for 10 years to have spent more on power than the cost savings of buying the cheaper CPU (it’s the delta, not total cost). Maybe throw in a cheaper cooler as well since power is down and call it 8 years.
Power Value - Moderate Power
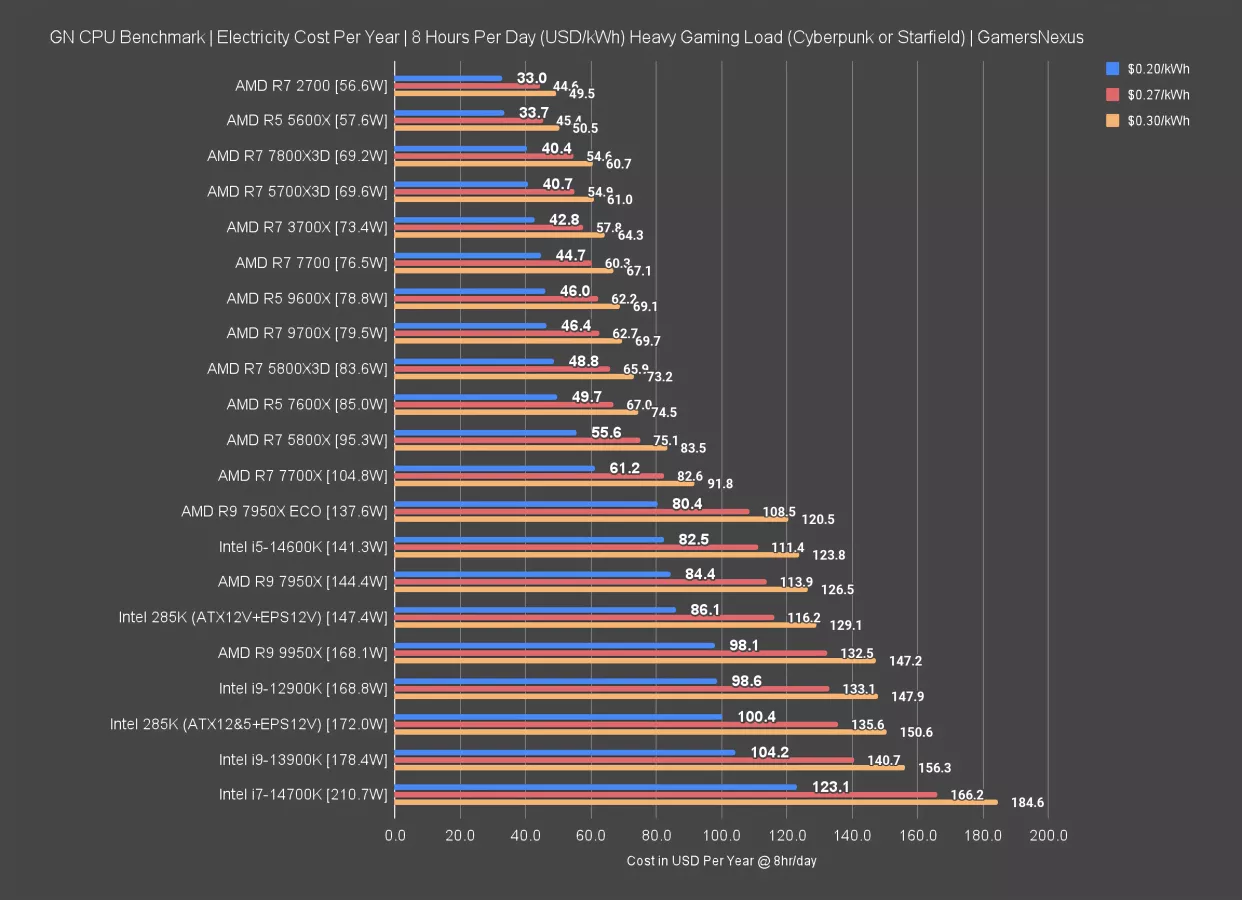
Even at $0.30/kWh, the $280 price savings from the 14700K would require 5 years to wipe-out with the power bill while playing Cyberpunk 8 hours per day for 5 years, or in other words, 14,560 hours of Cyberpunk.
Power Value - Expensive Power
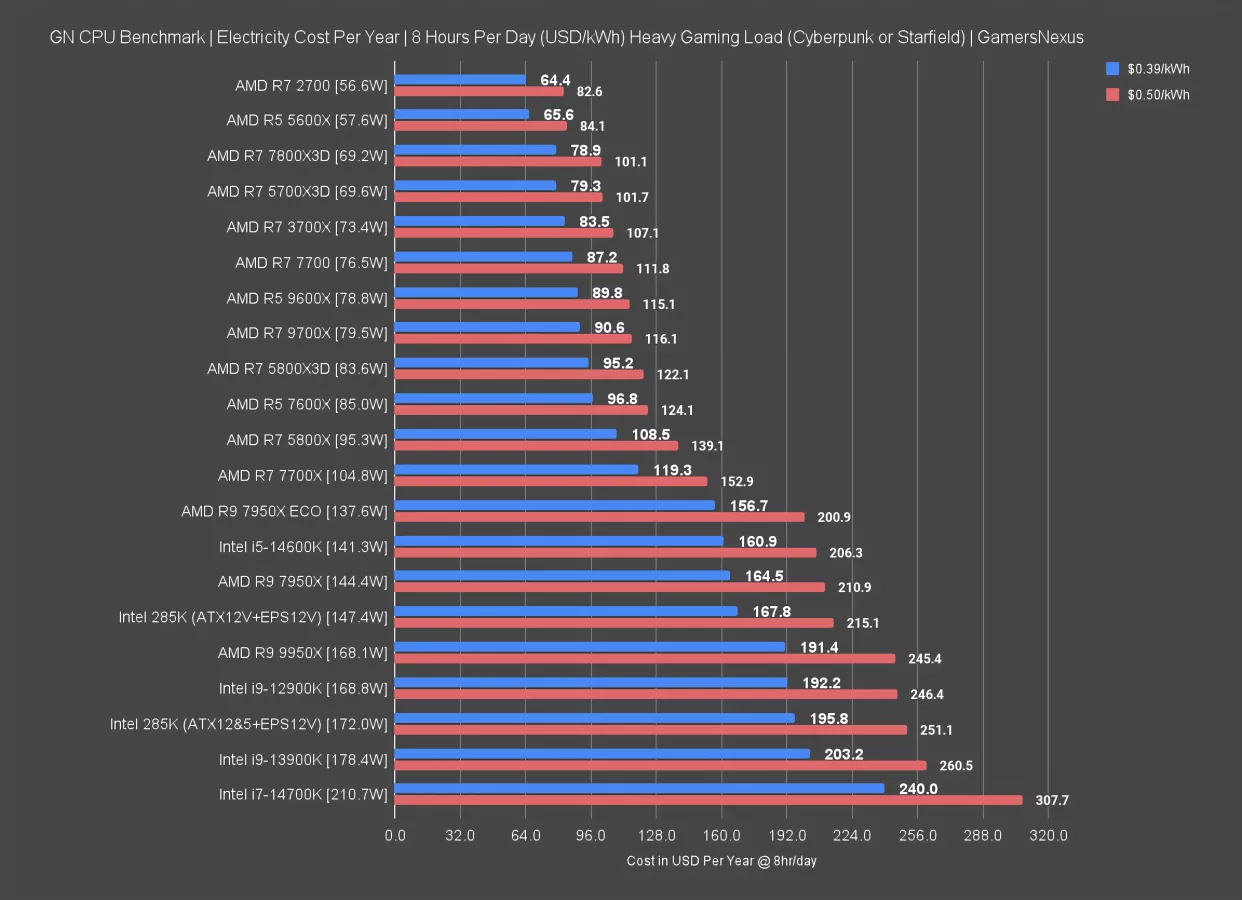
Let’s just say you pay $0.50/kWh. In one standard 3-year upgrade cycle, you can save the amount of money in power you’d save buying the 14700K -- which we still don’t recommend for gaming -- rather than the 285K. That’d be a savings of $92.60 per year (at $307.7 - $215.1).
Or, you go with the 7800X3D and get higher framerates and still a power cost reduction, even at these high electricity prices, of $114 per year at these crazy gaming hours.
And ultimately, no matter what argument is made for power savings, like room temperature or something, you can still point to AMD as an answer.
The reduction in power consumption is important and does mean cheaper cooling is possible, so that’s good. Intel is objectively getting more efficient, but regressive performance in games is hard to deal with. The production performance mostly improved at lower thread count, and that actually is great. The problem is that at $630, there are very few cases where the 285K makes sense right now.
Our approach to reviews is very consumer-oriented and value-oriented. That means for us, we need to see a strong value argument to recommend a part. Even forgetting completely about power as a factor and looking only at performance for the price, it just doesn’t make sense to us despite being an important building block.
The best news out of the 285K is that it might be a fresh start for Intel and that it is genuinely a lot easier to hit higher memory clocks than before, and that benefits it in tests like our 7-Zip benchmark.
But we just think there are better CPUs out there at lower prices.
